{
"cells": [
{
"cell_type": "markdown",
"metadata": {},
"source": [
"# Visualizing Naive Bayes\n",
"\n",
"In this lab, we will cover an essential part of data analysis that has not been included in the lecture videos. As we stated in the previous module, data visualization gives insight into the expected performance of any model. \n",
"\n",
"In the following exercise, you are going to make a visual inspection of the tweets dataset using the Naïve Bayes features. We will see how we can understand the log-likelihood ratio explained in the videos as a pair of numerical features that can be fed in a machine learning algorithm. \n",
"\n",
"At the end of this lab, we will introduce the concept of __confidence ellipse__ as a tool for representing the Naïve Bayes model visually."
]
},
{
"cell_type": "code",
"execution_count": 1,
"metadata": {},
"outputs": [],
"source": [
"import numpy as np # Library for linear algebra and math utils\n",
"import pandas as pd # Dataframe library\n",
"\n",
"import matplotlib.pyplot as plt # Library for plots\n",
"from utils import confidence_ellipse # Function to add confidence ellipses to charts"
]
},
{
"cell_type": "markdown",
"metadata": {},
"source": [
" ## Calculate the likelihoods for each tweet\n",
"\n",
"For each tweet, we have calculated the likelihood of the tweet to be positive and the likelihood to be negative. We have calculated in different columns the numerator and denominator of the likelihood ratio introduced previously. \n",
"\n",
"$$log \\frac{P(tweet|pos)}{P(tweet|neg)} = log(P(tweet|pos)) - log(P(tweet|neg)) $$\n",
"$$positive = log(P(tweet|pos)) = \\sum_{i=0}^{n}{log P(W_i|pos)}$$\n",
"$$negative = log(P(tweet|neg)) = \\sum_{i=0}^{n}{log P(W_i|neg)}$$\n",
"\n",
"We did not include the code because this is part of this week's assignment. The __'bayes_features.csv'__ file contains the final result of this process. \n",
"\n",
"The cell below loads the table in a dataframe. Dataframes are data structures that simplify the manipulation of data, allowing filtering, slicing, joining, and summarization."
]
},
{
"cell_type": "code",
"execution_count": 2,
"metadata": {},
"outputs": [
{
"data": {
"text/html": [
"
\n",
"\n",
"
\n",
" \n",
"
\n",
"
\n",
"
positive
\n",
"
negative
\n",
"
sentiment
\n",
"
\n",
" \n",
" \n",
"
\n",
"
0
\n",
"
-45.763393
\n",
"
-63.351354
\n",
"
1.0
\n",
"
\n",
"
\n",
"
1
\n",
"
-105.491568
\n",
"
-114.204862
\n",
"
1.0
\n",
"
\n",
"
\n",
"
2
\n",
"
-57.028078
\n",
"
-67.216467
\n",
"
1.0
\n",
"
\n",
"
\n",
"
3
\n",
"
-10.055885
\n",
"
-18.589057
\n",
"
1.0
\n",
"
\n",
"
\n",
"
4
\n",
"
-125.749270
\n",
"
-138.334845
\n",
"
1.0
\n",
"
\n",
" \n",
"
\n",
"
"
],
"text/plain": [
" positive negative sentiment\n",
"0 -45.763393 -63.351354 1.0\n",
"1 -105.491568 -114.204862 1.0\n",
"2 -57.028078 -67.216467 1.0\n",
"3 -10.055885 -18.589057 1.0\n",
"4 -125.749270 -138.334845 1.0"
]
},
"execution_count": 2,
"metadata": {},
"output_type": "execute_result"
}
],
"source": [
"data = pd.read_csv('bayes_features.csv'); # Load the data from the csv file\n",
"\n",
"data.head(5) # Print the first 5 tweets features. Each row represents a tweet"
]
},
{
"cell_type": "code",
"execution_count": 3,
"metadata": {},
"outputs": [
{
"data": {
"text/plain": [
"Text(0, 0.5, 'Negative')"
]
},
"execution_count": 3,
"metadata": {},
"output_type": "execute_result"
},
{
"data": {
"image/png": "iVBORw0KGgoAAAANSUhEUgAAAgAAAAHkCAYAAABIRZfzAAAABHNCSVQICAgIfAhkiAAAAAlwSFlzAAALEgAACxIB0t1+/AAAADl0RVh0U29mdHdhcmUAbWF0cGxvdGxpYiB2ZXJzaW9uIDMuMC4zLCBodHRwOi8vbWF0cGxvdGxpYi5vcmcvnQurowAAIABJREFUeJzs3XmcjeX7wPHPc2afMcPMWMa+72RfCkWJLJG0aFN+lZBQkWxpUKEoSRRSqSzfJEXIHkWW7Ma+L2NmLLPv5/n9cTlz5pgzG2MZrvfr5XXmPPvMd7nu576v+7oN0zRRSiml1N3FcqsfQCmllFI3nzYAlFJKqbuQNgCUUkqpu5A2AJRSSqm7kDYAlFJKqbuQNgCUUkqpu1C+awAYhvGIYRgHDMM4bBjGu7f6eZRSSqn8yMhPdQAMw3ABDgIPA6eBLcAzpmnuu6UPppRSSuUz+a0HoDFw2DTNo6ZpJgFzgc63+JmUUkqpfCe/NQBKAqfSfT99ZZtSSimlcsH1Vj9ALhlOtmUYwzAMoyfQE8DHx6dBtWrVbvRzKaWUUrfc4WPbiLxIhGmaRbI7Nr81AE4DpdN9LwWcvfog0zS/Br4GaNiwobl169ab83RKKaXULWYYxomcHJffhgC2AJUNwyhvGIY70A347RY/k1JKKZXv5KseANM0UwzD6AssB1yAb0zT3HuLH0sppZS6fsaVUe6bNDsvXzUAAEzT/AP441Y/h1JKKZXn/P1v2q3yXQNAKaWUuiPd5Lo8+S0HQCmllFJ5QBsASiml1K0UESHj/z/+mO2hRrBBjc9q5MlttQGglFJK3UqFC0PTpvDcc5keMmXzFIxgSRIMiQzJk9tqA0AppZS61TZudL69f3/o2pVSfqUo4VuCU2+e4pFKjxAeG37dt9QkQKWUUup21aIF1nPn6FytM52rydI3yw4v42L8RYr4ZFvsL0vaA6CUUkrlpa1b7XP6J0yAPn0gORkKFIC4uNxd64kncLnYj1bftkrbZI40qVq46nU/pvYAKKWUUnnpkUfks1w5OHGlKu/UqfK5di20b5+z6wQEcOSRJlRsWpEhzYfk9VNqD4BSSimVJ376Sd78L1yQ7yeclOT/7LOcX2/mTNZ1qkPFgIq0qdQmb54xHcO8yYUHbjZdDEgppdRNERMDZctCbCwkJmbcv2kTNGmS+flWK7z3HowaBZZrfz83DGObaZoNsztOewCUUkopm3nzYNy43J2zebO8+f/2G1y86Dz4m2bWwR/kvA8+gISEHN/aCDZoOr1p7p73Cm0AKKWUUjZHj8Jff+X8+IQECe4FC2Y+j/+VV3J2LS8vuZa3d87vD+wJ35Or4220AaCUUkrZDBkCS5bk/PiHH5YiPpGRmR8zfHiOLuU6ypUhq5wn+5WcUJLgtcGAvPXXnlIbkBkBMUNjcv686WgDQCmllLpWGzZkf0zx4jm6lIlJdGK0033J1mQSU+1DCzHJ1xb009NpgEoppVRea94c1q/P1Smp76Vmui9sUFjaz+bIvEne1x4ApZRSKqfSz5zb42TsvVYtyeBfty5Hl+vxaw/m752fRw+XO9oAUEoppbLTvbtk+lss8tm+PdSvb98fECCfEybIdL7Y2Kyvt2ABGAaRcRdJsabcuOfOgjYAlFJKKWeOH4ctW2Rq3+zZss2Wob9uHaSm67J3c5PegTZt4MgR8PV1vJat5yAlRf61bw8dOnA69hxrjq+54b+KM9oAUEopdXc6f16K91zt8GGZk//++9C4MQQG2vfZavnHxcmbvs3atfafK1RwvN7zz6cV9okuVohYbzeZ8rd4Mf2b9OfFOi9meIS45DiiE6OJS87l2gG5oA0ApZRS+V9oqHTNpw/K2QkKgq5dM26vXFmW4a1SReb350SBAjBnjvN9kyfDgQMAJB0IYeeuP9N2PXfPczQv0zzDKdWnVMdvrB8+H/qw49yOnD1DLmkDQCmlVP4XGAhDh+auhK5pwvLlGbd/+il89RUMG5b5/P46daB8eUkEDAuDHj3g2WedH+vvz/zkHRjBBoGFS3NftYezeCSTqVumEhodmrat3tf1cv475YJOA1RKKZX/ublJGd3sbN8O99wDLi72bWfPypt+1arg7g7HjmV/nTfekAp/tWpBSAisWJHl4U1KNmF86/FZHhMaHUrxiTmrGZAXtAdAKaXU3aN+fVi92nFbyZISzM+ccb6C39VatYKXX5YehK1bZajAiZikGGwL7pUtVJZBzQY5PS46MZpUayr/nvnXYfvGlzdijjTzbN7/1bQBoJRS6u5hmlK+9+ptr74qP+ckh2DNGpg1S35u0MA+7DBmjBQAusL3I1+Grhqa6WVSramcjz6P31g/SkwswWPzHnPYf+/Me7N/luugQwBKKaXuPmFXKusVLQq7dsGAATk7b/BgWS3wu+9k3D+9++5zyEGIHxaPu4u708ucjjpN6U9L2x8nNizDMT5uPjl7pmukPQBKKaXuPnXryvh9Sook9AUHZ39O1aowdqz0GKSf9mfz4IOEvNoFI9gAwNPVE4thD7PJqcn0+LUHl+IvMeGfCRgYWd7uWhf5ySltACillLozffwxzJvnfN/Zs9IL8Pzz8v3xxzO/zqRJMmVw8eJMpxpaTSsX4y9S1KcofRv1dXoZ9zHufLvzWwLGB1CnWB1MMh/bv1Hj/ulpA0AppdSdad06OHTI+T7DgEcegVWrsr9O//7SYKhQAX791elUw2GrhhE4PpBA70Amt5+c5eVK+Zaix289nO5b+uzSmxL8AQzTvDk3ulUaNmxobt269VY/hlJKqdvF6tXw0EPys8WSdeJfqVLw999Qtizs3ClTCDNhG9dPfS/VoevfJnhtMIsPLuZE5AnC48Izvc71NgAMw9hmmmbD7I7THgCllFJ3j6FDoW1b+/fssv4vX4YyZWRNgJo1nR+ScBkj2KCod1EGNxtMSHiI0+OqBFZh67mtWQb/m0lnASillLr9REWBn1/eXGvHDlmgp2tXeeNPyWL1PTc3oooVwqdUBVw2/Qt//CHbGzp/od4ZupOSviVxs7hhxcon/3xCEe8i1CwqjYW4pDiKfFyEdT3W8dnGz9LOMzDwdffFz8MPH3cf9vfdnze/ay5oA0AppdTtZc8eqF1b3s6NrDPlnTJNx/P+9z+ZuufiAklJWZ/bsCF+GzfC6XD47z+ZIZCFul/VZXX31SRbk3G1uJI0Ismh+7/jnI7EpcTRaHojx0fEJCopivODzuPp6pnrXzEv6BCAUkqp20vNmpCQcG3BH6B0acfqfH36SN3+pCQp3JOZgwfhn3+kAbF9u1QNvHw5y1uZI01alW+FOdJkyuYpuIyylxiev3d+pkv9FvYqjDnSvGXBH7QBoJRS6laJj5cgm5zsuN0wwMMj4/GRkbI8b1bJ61YrPPqolPR1dYWWLaVBcPiw7N+2LfNzK1e2X3vXLlmy1yfnxXh6NezF8f7HuRh/kYZfN+Tpn5/O9Nh6xW/MAj+5oQ0ApZRSt4ZhyJt2+oV5MnP4MFy6JMl4V/cMnDgBs2dL8HdxkR6EpCRITZVa/TmZ7WYbGrBYpNpfxYrw2mv2hohpwpAh0jORTvqZdDFJMZQpWIZ+f/Rj27nMGxpdqnZhy9kt2T/TDaYNAKWUUreGp6cE1qyW8E1NlYBfubIs2OMsmP/xB3TvLqvyDRki3fy+vrIvNjbrZ7BN67MdFxICw4fLcMCjjzoeO3YsXLjgsMkyykLFzyvy5ZYvKfxxYbac3cKPe37M9HY+bj4sPLCQzx/5POvnugm0AaCUUur25eICHTvCxo2ZF+3p3Vsy+2vVgo8+kpr82QV+m+++k0ZFoULyvVo1aTx88onj/QxDjitZ0uH0vX32UtK3JK//8ToF3ArQa3GvLG8XmyzP5eeRRzMcroPOAlBKKXX7slrh99/l58y68iMiZCW+q8/Ljq+v8yx/w5Bcgfr1szz9yMUjBHgFMLPTTKp8UYWY5Bi2h27P9rafP/I5nat1zv75bjDtAVBKKXXj2abmnTwJ4eHy72oXL8KZM/bv48c75gdcuGAv7TtmjL07/rvvpF5/TrVrJ8MP0dHw4IPOj0lNzfYylSZXovyk8pT0LZntsTabXt7EG03eyPHxN5I2AJRSSt14hgGffQbFi8u4e+3aGY958kkpvWs7vkkT+dnWA/DWW/bpfSNGSALhPfdAkSI5fw4vL2jTRmYgzJnjfFW/J5+EokX579x/aSv7Xc1W7S8hJQGfj3I2U2B86/E0KdUk5896g2kDQCml1M3Rvz+4ucG5cxAamnF/bKy89QP07AnlysHKlfa3dNt4Pcjn/ffD7t3w4ovZ37tcOYiJkez+t96S2gDdutmvFxkpvRMA8+dD2bJUCazC1x2/BmBXMYNNpeyNgcYzGmd7S39Pfzxc7NMZz0afTWtQfLP9Gy7FX8r+uW8gzQFQSil1e2jXzl5y96uv5LNsWefHmqbzWgGZuXhRGhW7d8PSpVC9uuP+V1+VioFXGgTnos/ReW5nNr+6GYB/R/fC1d2DplcO3/HaDipNrpT1r1OpHW0rtaV7ne4AGMEGT1R/AoCXf3uZwt6F6VS1U85/hzymqwEqpZTKH+LjZez+0UdhyZJru0YOY96hC4doOL0hke9GOmyPTYqlxpQanI0+S4qZQgG3AsQkxzi9xoG+B6gSaK9IGJ0YjbebNy6WHNQ9uA66GqBSSqn8z5aMd+AAeHtLkZ++feXn3BgyRIJ/DhsAlQMrpwX/FUdWUO2LahyIOID/OH9ORp0kxZQFhTIL/n0b9qVyQGWHbb4evjc8+OeGNgCUUkrdfkxTqu65usrKgH/+KdvDwiSXIC4uZ9fp3l2u9eGHsHx51kWHnHhnxTskpiQSkxRDtSnVSLYmZ3m8l6sXAD3q98C41rUMbhJtACillLo9tGoFX38tc/AtFunuP3pUlgV+6SVo1Eim/h08mPV1pk6Vz9OnJXHQ5sEHZaXBTITFhtF4umNy38f/fIwVK15uXjn6FbpW7wpAzSI1c3T8raRJgEoppW4PdepItn7durBzp7y5x8XJlMBvvpF1ALIzcybUqyfT/dJX7YuMlN6EmpkH5ujEaHae3wlIwt66l9bx3v3v0Xluzov2nI0+izkyf+TWaQNAKaXUzZeSIkV+DEOmBRYvLnUCbNJX6PPygv/7v6yvV60a7N8PhQvL9QYNctxfqJA0Lo4dy/QSFQMqkjg8kaWHlgIw/b/p/LDrhxz9OjFDYui/tD8zd8zENM3bvvsfdAhAKaXUreDmJgV5/v4bSpRw3Hf6tHyuWydj+PHx2V9v/37YsQM6d4bFi2HFCjhyRNYQAKkwmEXwN02T01Gn2XhqI1O3yhBCfFI8ni6eOfp1Bq8czIzOMzBH5iz47wnbwyf/fJKja98o2gOglFIq71itEngrV864LzXVXtr3wgWZx+/jkzEzf8cO+bzvPnjgAakI+O+/zu/n6QmJibKcr4uLrOT38svytl+4sNxn1y6pGGi1ZlxK+Iofd//ICwtfAKSAj7erNwv2L8j21x3VchTD7h+Gxcjd+/Sm05sYsWYEA+8bmKvz8pL2ACillMo7CxbYy/VezdUVli2TN/rAQMcFe+bMgfXrpWCPbRnecuXk01nwr1BBPm2r9D30kCQOjh5tP8/DQzL/bY2MTIK/1bTSpKS9RO+lhEtU8K+AxUmIdDfcHb4X9SmKyygXzsecd/47Z+KV+q8QPywHPRs3kDYAlFJK5Z0nn8x8rv3x4/DwwzKm/8orUKCAbN+3D559VoL4sWP27ekXBrra0aPyxh8fL0MFy5fL7AGbkSOhVCnMAQPkuldEJkTS/JvmpC+C5zLKhS82f8GolqPStu0J34MVxxUFDQySzKS078V8itG1elf29dlHsQLFsv673Ia0AaCUUnerI0fgRlRKzawBULasBG3TlLUAbLX3q1eXpMDkZCkFHOO8uE4GqamyHsADD8DevdCggawSeKVH4Ey7FlieDnEY+z8VdYq/T/1NUqo9kJ9+8zR9GvXh3ebvZnqre4reQ1GfooA0BADOx55n/D/jqV6keqbn3c60AaCUUvldXFyOlq/NYOhQaNYs75/HYoHp0zPfbxiSqFeunPxsGNIwWLBAsvVz46OPJOA3aACXLsHmzXL/++8n6L1xbOu5DaKi2FXM4N3l71CraC3MkSYerrKOwMELBxm8cjDVplTDfYx7prfZFbaLi/EXaVKyCa6GPX1u/MPjiUqMYt3xdbl77tuAJgEqpVR+5+MjRW5WrcrdefPm3Zjn2bZNpuUBbNggSXxubvJ98WJZ9c82Ju/mlunYfAZ//SVv/NWrSyngX3+F0qXh8GH5GxQvLlMAI6WEr4vFhfrF68Ply9wTBnU2fcyYhz/E1SKh79XfX6VEgRL8uPvHHN0+2ZrMv2ckH2HlCysJiw0DYM7uOfRa0ivfzP+30cWAlFIqv7NlwLvcPnXm09iCe9u2stpeUJAE6sOHZXtwMKxdK/+y4ukJs2dLjkG3bpI0eLWTJ6FMmQybM5uX7/uhL+UKlWNPeObVAQ0MTBzjpPU9K4sPLqZYgWI0Lpn9ssA3W04XA9IeAKWUyu/cM++6vuVMUxL0HnkEzp6VLvsjR6BSJRn3P3XKcTaAjZub5ATYJCTAf//Jzz9kUpzHSfAHsIyy8Mezf9Cucru0bUcvHSUmOSbL4A+kBf+//+9v7i11LxFxERiGwRtL36B95fa3ZQMgp7QBoJRSKm9YrRLQy5Z13N62rT0xsFQpyfIPDJQ5+lcrXBgiIhyDP0hZ38OHc7yaX3pbX91Kw+kNKeJVhONvHsfbzZsvt3zp9FhXXEkhxfGRvArTdV5Xzg08x5rja3j656cB+LKD82vkF9oAUEoplTfmzIHnn5fpe1dX9wPZXqqULPqzZo3za0REZNz288+SMNgw217tDFp/35raRWsDEB4fTvdfurP08FLiUpyvJnh18Aeo4F+BGZ1mcCHuAk///DSjW43m6KWj2d67xIQSVPCvwIb/25Dr574ZNAdAKaVU3klNlYI/oaFQ7Kq58Y8/DgsXyv6UjIHWgacnTJsGL754zY/y55E/WX9iPfWL1+fx+Y9TvXB1QiJC0vZbsGSY65/esX7H8HD1oMTEEljfs2IYBgciDlC1cNUc3X/3+d14u3lTMaDiNf8O1yKnOQA6DVAppVTujRljT/CbPdv+s4uLdOPv22c/dsIE2b5woXzPLviDjPnXrXtdj9j2h7b4efjxaJVHqRpQ1SH4A5kGfy9XWfq3nH85ivsWp1vNbgxdNZTt57bnOPgD1C5W+6YH/9zQBoBSSqnce+EFeyZ+q1bwxRf2fe3ayRj/jz/KdL2BA2Vuvk1AAPj6Or/uE09IomBsrNTvf+ABx1yBp5+GsLAcPWL8sHjeWfkOzy18jgMXDzCixYhsz+lStQv9GvcDZHlggKikKCZvnsz8vfNzdN/8QocAlFJKiccek+JAjXOZ2Z6aKgHeVpd/9Wp4/XWoVw/mzpVjGjeWIj0g+QFnz2Z+vfHj7cv5GoZU8rPV9zcM2L49Q+9AdGI0P+7+kV4Ne2W4nGmaWEZJA6RD5Q4sObQky19nVudZPF3zabzcvLL91W9HOgSglFIqd44dk8V4csvVFRo1ksx9iwXCw+Xt3Rb8AXbvlk8vLwn+QUFSxOdqffrYgz9Ig8IW/G3fnQwNbA/dTu8lvQGp7hefHI9pmtSbVg/LKEtat35WwX9u17n0btCbHot65Nvgnxs6C0AppZTYudP59vh46cqPinLedR8RIeP+rVvL0MCTT8K338q+11+HjRvtc/jjr6yAFxoqnxaLTB/8/nvJG3jhhRw96qRNk4hOimb4/cMBuL/s/bQo3YJ5u+bRbWG3jL9CivOV9x6t+Ci/H/kdgG4LulHStyTv3PdOjp4hv9MeAKWUUlnz8pJAblulz8YwpJJfYKC8/X/2mSQEHjwoxX/69IE2bezB/2rTpknwDwiQMf+xYzPPDbjKpYRLaaV4bW/760+tp9vCbni6eqYt7+uazXuuLfhPbDORrtW7cvqt04x7eBzZDY/HJTufRpifaA6AUkqp3DEMeWOfMgX+/Ve65d9/H0aPluz9wECIlgQ6PD1lW1Zmz5Y3/2uMR0awQbtK7Vh6eCmBXoFciL9AWb+ynIg6ke250zpMw8vNiwbFG1Braq20ev5GsEGnqp1Y1G1RhnO+3vY1ry1+7bat/Z/THABtACillMralCnQt689QP/9N9SpY39b//xz6CeZ807n+Pv5yfBBeufOSdGglSuv+/EGrxjMxI0TSTHlvrMfm80LvzofSqhQqAJHLx+luE9xzsWewxxpEhIekmFJ3wMRBwjwCqCIT5EM17CaVmKSYvDz8LvuZ78RtAFwhTYAlFLqOl24IOP4HTs6bi9XDk5k85advqZ/8+aycNHAgZInkEeqTK5C1cCqTH90Oo2mN+J09OlMj60XVI/todsBOPvWWUpMlIqFqSNSsVjujFFxbQBcoQ0ApZTKY8nJ8qZvtcrntcjD2LP2+FoGLBtAdGI0Ry9nX6L3qRpPsfnMZo5HHgdg4/9tpGnppnn2PLeaTgNUSil1fQwDund33HbsmKw+WLcufPopfPihbC9bNusEvpYt5fPxxzMOB4SFZdiWak2l1pe1iE2KJS45joMXDma4ZHJqMkawwZvL3mTn+Z05Cv6bXt7E/H3z04J/yoiUDME/1ZpKRJyTNQmu7LtTaANAKaWUc1u3wscfO25bsEA+d+2S+fpDh8rPJ07YE/+uZhiwdi089BD88osUDnr2WckNKFRI1gx4+GGHin8Ww8Le8L0ADPxzIFW/sJfgrTK5Cn0W98F9jDt+bn7sOL/D4XauhmOvhAULNQrX4IcuP9CgeAMA/Dz8iHo3CheLS4bHHbxyMEU+zjj2P3bDWFxH3zmz57UBoJRSyrkGDTIu6DNwIHz9teO2f/91fn716jIF0DShYkVZE8A0JeiPHg2//QaTJ0NIiMwcKFw47VTDMDBHmni7edOhcgd83aV34d6Z90oCnrsk4EUlS89BYS/7ubZkQHeLOwDTOk7j+OXj/Lr/V1xdXOlWqxsRgyLw9XDeY/FJm0+cZvi/2fRNTr+ZeX5BfqM5AEoppXLur7+kPr+npyT0WTNfTQ+QYQEXF/j9d2k8bNrk9LCk1CReX/I6Xz36FRbD/m66MGQhj89/nJQRKbhYXFh9bDWzts/ih90/ZPuoHi4eJKYmYn3PSv9l/SniXYT9F/bz0+6fbtspfHlBcwCUUkpdv337oFkz+TkpSRbjAZnbnz74py/Xm17RovDnn9CiReY9BUBCSgIzts/ANE3ORZ9j8cHFAHSp3oWB9w5M63r38/Dj530/5+jRE1MTqVW0FoZh8Hm7zzly6Qg/7f6Jxc8sztH5dzptACillMpcdDQcPSrz9T08oGtX58cdPy6fnp7Q8MrL52OPwd69sk6AaWaZ+e/n4Yc50sTF4sLcPXN5dM6jafuGtRjGu83epd/Sfrz060skpCbwSMVHMr2Wi+FCw+LyDO/d/57D9iLeRWhXqV3Ofvc7nA4BKKWUErGxUpY3KkqCPUgBoClTMh5bsCBERtq/BwZKL8C2bfK9Zk0J/lar1Ps/cQLKlMn1I/Vb2o/JmyenfbcV8MkJAwMTk3pB9YhMiORI/yO5vn9+pEMASimlcsfDQ7r509fuL1vW/nP6tQDSB3+Q2gAlS8Izz8Dhw7Bnj7zxG4YU/fn772t6pB93/5j2c6tyrbIN/l+3/5ognyAATOQFd3vodsoUzH3j40532zUADMN43zCMM4Zh7Ljyr326fUMMwzhsGMYBwzDa3srnVEqpO46rqwTte++V79HRUq63YkX5HhaW8Rzbkr5t2khjoVEjOf7nn+GTT2Rf3boy7S8Hxm0Yx/y989lwcgPBa4O5GG9fnnjN8TU8VPYhh+NrFKkBQCH3QgD0/KMnobGhafsvDb6EOdJkzUtrcnT/u8lt1wC44lPTNOte+fcHgGEYNYBuQE3gEeBLwzAyTuBUSqkb4exZ+PLLW/0UN1exYlCihLzFgywJfLVTp2D/frh0Sab07bgyJ3//fnud/6FDc1z5768Tf3H44mH+OvEXE/6ZkLbdy8ULgFUnVjkcvy98HwCXky7Tt2FfahSpQY3CNTj39jkOv3GYQp6FcvEL311u1waAM52BuaZpJpqmeQw4DDS+xc+klLpbrF8vS+LmJ4YBW7bk/ryICAn+nTvL98OHZbU/yPg3ePFFqFZNCvyEhsJ338n24cNh2bJc33rJc0sY2mIoQ5oPIS4ljiLeUpAnPjU+7ZhK/pXSfq5dtDZFvYsC8NvB34hLjmNfxD6CCgRRMaBiru9/N7ldGwB9DcPYZRjGN4Zh+F/ZVhI4le6Y01e2KaXUjff007mrX//MM7DmFnc7d+8uyXlXS02F6dOdb09IkIZDSgrMnQs9e8Jzz0kDwGqV6XxgTxL87jtpAPj5ZSwalIUUawoPff8QCSnOlwqev3c+qWYq4XHhGfYdvnQYAB9XH3aH7cbdxZ0Hyj7AH8/9wZ7ee/i287c5fo672S1pABiGsdIwjD1O/nUGpgIVgbrAOcDWB2Q4uZTT/zUahtHTMIythmFsDQ/P+F8epZS64U6cgMuXb+49w8MleKdeqVf/3XdQoULG48LCJLDb5vFfuAD//CM5AF5e8lZvS/77+mv48UoiXv360K2b/DxmjHxu2CDd/YYBS5bk+FG3nNnC6mOrefp/T3Mm6ozDPiPYoNuCbni5ejGgyQAs6UKVrSIgQGxKLAAbX9nI/CfnU7NoTXzcfXix7os5fo672S1pAJim2do0zVpO/i0yTfO8aZqppmlagenYu/lPA6XTXaYUcDaT639tmmZD0zQbFimSsZ6zUkrdcP/8A1263Nx7BgRAv35SeS8rhQtLTf9t26RQT3CwFPuxLYe7ZIlDXf40O9LV3K9fX3pEbEWCfvgBHnwwx48aHhdOUZ+i/HbwN/aE7QHAalop86k9Wz8+JZ7P/v2M9x6wz+WPTrKvN+BucefQG4d49KdHKfZJznsflLjthgAMwyie7msXYM+Vn38DuhmG4WEYRnmgMrD5Zj+fUkrdtlxcYNIkebNPSsr8uP0G/aunAAAgAElEQVT7paDPli0QFCTJe4bhWNnv5En5dHODWrXsdfrDw2UYYMwY+5DIV1/JKn9eXtJj0Ldvto/aqWon9vXZx8oXVvLIj48QOC6Q5NRkTkWdcnjjL+RRiPfXve9wbokCJXiu9nMkDE+gUkAlnqn9DCA9BynWlGzvrcRt1wAAxhuGsdswjF1AK+BNANM09wLzgX3AMuB10zTvnHUZlVIqrzRvbh+jT+/YMfmsXVvm7f/vf7K0L8g4vjPt28ucfltiYFQUzJ4t+Q222QH33CPBH2RbgvNx/atN3DiR1rNbAzC0xVA8P/DE38MfK9IQqRpQlfaV2mc472zMWX7c/SOWURYuxV9i4H0DGdZ8GHBnLdd7o2klQKWUyonU1Oy71m8X8fES4P387NvWr4f775eegWPHoOqV5XWPHLHP80/PMOxv+G5ucl5CggT6Q4eg0pVMfNu2y5elOqATO0J3EJccx32l73PYHhEXQaBXIJZRFsoVLEf3ut0ZtW5U2n4XXEhFAnoJ3xKUKFCC7aHbebf5u7Su0JpW37UCcFjYx2q1YrHcju+2N49WAlRKqbzk6pqjru1rdr0Jg0uXyts5SEBOH/xBAniFCvImX7OmbKteXZIVwbHHwM1Ngrlh2N/ybdft2dMe/EFq/5tmpsEfYMTqETz/y/MO245cPEKRj4tgGSVh6HjkcTae3OhwjC34F/YsjLvFna3ntmI1rczdM5dfQn6hamBVBt47kGd+liGApJQkXEa7sOPcDlT2tAGglFI5ce4cfPzxjbn2wYPg75+7aYZXa98efvvNcdvRo1KPHyRQr14thX1SUuCdd6QnwJa4l5gon35+sv/yZXjhBShe3J4cePGi5Avk0u/P/s7R/kdJSk3Cc4wnMUkxVAyoSMyQGIfjVhxb4fT8iIQIjkceB6Bztc4cuXSEZGsy3Wp1o37x+jQq2QgAd1d3fnj8B+oWr5vrZ7wbaQNAKaVyIijIPs6d16pUkS77/fuv/RqmKWV703vlFckHuHhRPidOtO/r3x86dHA83t1degpMU4YIvv9eivvYxvT9/e05A9fA1XDFzeKG70e+jN8wni82f0Grcq0yHFehYAXK+pV12PZE9ScAWPj0QqZ2mMq0rdNYtH8R0UnRvHXvW7y/9n0Anqv9XIbrGcEGm8/kXc74Z5s+cxiqyK+0AaCUUrcDiwVq1JDSunll9Wop0RsYKD0En39u31eypEwFtPH0lODfqZN837ZN6vmnnxmQjU2nN/H1tq/54K8P2H1+NwCVPq/Eicsn0vbHJMtb/+BVg3l31busOb4Gl6uqupf3L8+JqBNULGTPTXixzouMaz0OgJfrvcy5t8/RpFQTCnsXZvKmyQSvCyY0JhRnglsGU8HfST2EaxSZEElEXESeXe9W0SRApZS6U82dKxUJ9+0DX1/7wj3e3hAXZz+uUCHp8q9cWWoJXLgg5X8TEpzPJsjE2A1j+WLzF1xOuMyHD31Ivyb9qDK5CkueXcKkfycxZYt9WeFnaj7DnL1zHM5/rOpj/Hrg1wzXLV+oPMcuH0v73rVaV35++uccP9fdRpMAlVIqL8yaBadP3+qnyLnkZPkcPlyCP0jPwtat9kS99MHf09OegHjoEPToIcG/eHEpJWyr/JeF2KRYPlr/EUNWDWFHrx10qNKB/sv6k2JNYcmzS2gyowndanVj5qMzARjdanSG4A84BP+qgVVJGp7E6FajCW4ZTOLwxLR9C/YvYMq/UzKcbxP0SRDtfmiX7XPf7bQHQCmlsmIY8M03EhhvZ02awJtvStCfPVsSAEeOlH0Wi3Tl+/rKEr8AZcrIm35sLDz8sJT+nTZNpjru3SuJgAcOyO//5JNZ3npH6A7qfVWPT9t+Sv8m/TEMg6jEKAqOLciWV7bQaEYjinoXJTox2mFRn6r+VTlw6QAAdYrWYWfYTgDWvLgmbYpfy7ItWfPSGoxgg5DXQ6hWOJN6BelsPrMZf09/SvqVxMvVC8NwVkn+zpXTHgDXm/EwSimVb92uL0njxsEff8Bff0mwDgiQcf0zZ+QT4N57JZjbpgdGR9sT/U6elJK/HTrAihUytc/VVX7fP/+Et97K8e9eN6iuw1x8AG9XWTr4uYWSlBcWF8YLtV9g9u7ZacfYgj+QFvzbVmxLq+9a0ah4Iy7EX6BLdSmnPLHNREr7pa8Gn7nGJaWCvBFsMLT5UD546IMcnXe30R4ApZTKj5Ytg40boUgRx/oEx47ZFwAaNgw+yCL4BQfL7ICHHpLGQWpqlvP5c6rHoh58u+NbAOY8Podnfnkmbd/q7qs5E32GFxa+kLbNx82H2ORYDvQ9QBHvIqw+tprivsVp9k0z6hevz7ae267pOWKSYvBy9cLFkk8KOOWRnPYAaANAKaXuJKmp8iYfGChd/Lbu/6u5ukqSn6srPPYYLFx4zbcMjQmlzrQ6nB94HoByn5WjTYU2TN/uuOTw/9X5P5YfWc6ZGFn9r1+jfny+5XPqFKvDm03f5MCFA4x5cAymaRIeF86Ri0e4p9g9+Hr4ZrinypwmASql1N1kxgwZr7cV9LGt5mcL/qXTdZ97ekK5crLAT4ECMt8/B3aE7sAIto+nG8EGQ1cOBcDbzZvL8ZcZsGwA63usZ+OZjbSt2Nbh/G92fsOZmDNpS/p+vkWmJZ6NPktpv9J8tOEjTlw+getoVwatGETzWc01+N9A2gBQSqn85MsvZfzfNGHlShg7Vsb49+2T8f2335bjqle3V/ADqS8wf778nJAgwf/TTyEmRpIDc6CUXykGNxuc9r1NhTa81fQtggoEcaz/MWp8WYNJ/06izGdl2BO2h0vxlyjmU4wOlTvw5/N/pp33eLXH8XDxoFeDXvi6+/Lfa//xYIUHMUeaUgNgwAlmd5lN0vAkTkaeZNvZbczfO/+6/3TKkTYAlFIqPzlzRsbuy5aVVfpGjZJx+08/lUbBtGlyXEiIvP0HBtrXBXjqKVn457nnICwMHn1Upv517mzvMchCYe/CjG09FtvQ8fIXllO4QOG0/enf+Hs16MXms5s5H3ueJYeW0H9Zf0CSA7/b9R3hg8J5osYTRCdFs+jAIsZtGJd2rm1J33F/j6PsZ2VZuH8hvZf0vq4/m8pIcwCUUiq/OXlSGgAgC/s89ZR9yt/VGjeWqX0bryy0ExUlb/xWq2w/flyGA0JCMl8S+CpGsEG3Wt2Y09VxLv+by97ks38/A8DTxZOEVOfLAhf2LszgZoMZtGKQ/AqFa3Lk8hHih8VzOeEy/uP8SRiWgIdr5kWIElMSs9x/N9McAKWUyo+WLJE3fJA6/M688IJU7wOZ5rdpk/PjKleGzZtleMDG1t1vsciywWXLSs9BtWowaRKUKiX7ly6VBZCcGHH/CB4o8wBeHziujXAgQqb1BXgGZBr8LViIiIvgYMRBJraRtQk2vLyB+GFSH6CQZyHMkSYerh4kpyYTnxyf4Rpzds/B8wNP57+zyjFtACil1O3k6FGZlw9Sje/33zMeM2sWrFsHq1bJm/zSpY77u3SRBsKhQ/I9OVnyA6ZcVT3P86ogev/98MYb8nP79lJQyInRf40G4I3Gb5Ccmsw9X95DrSm1WHpEnuNiwsW0Ywt6FOTxao8DsOO1HViRpMQZ22fw1p9vAfD5v5/TfWF3vtj8hcN96k6ri/eH3pyKdFwf4amaTxExKP/X4r/VtBCQUkrdDKYpWfpZiY2F3r3tQfjqIdrUVIiIkKV8FyyQ8f558zJexzalb9UqcHMDHx+pF1A6m0I69erJvyv33nJmC0Uvn6BsIfvKfKZpUqNIDXr/0ZtCHoWIS45jd/huh8tMeHgCb6+QZMTIxEh83H0AqPtVXQbfN5hx/4yjTMEynIg8wcoXVtJ6dmvcLG6cjjpN38b2mgabX91MgY8K4OPm43B9F4sLgd6BWf8uKlvaA6CUUjeDxSJZ+5mZPl2m5Lm5Od9vtcKHH8qyxMuXw//+B716wddfSzXA3leS5Hr0sA8hPPQQtGgB9etnDP6VKsGIEVk+cuMZjen7R98M2/eFy5BCfEo8/Zv0p0/DPvRq0Is+DftQLbAab694my87fMljVR4DoHWF1vzeTXoyXmv4GhX9K/Jpm0+Z0n4KIREhmCNNfu/2O2uOryEpKSntPj7uPpgjTQK8A7J8TnVttAdAKaVuhn//hbp1M9//8svQs6cEdWdcXOQfSM/AV1/Z93l6wtSpUtDnm29kbD8gQKb7Wa2O0wFt3n5bEgSzEPJ6CJUDKjtsMwwDDxcP2lVqR6OSjaj1ZS1SzBSsppXOVTqz/8J+vF296bOkDx0qdcDX3ZcXf32RmCExDLpvEE1nNCUsLozp26dTJbAKyamyeNGa42sA2BWxi/Y/tidsUFiWz6aun84CUEqpW2nzZpmmV60aHDwo4/4tWsDrr8Orr8oxGzbA6NFSo98mMBAiI2UdAICuXWWef/pgbxiST9C69TU9WqvvWuHt5s2SZ5ekbVtycAl1gurg4+ZDwPgAvFy9iE+RRL03Gr/B5M2THa5Ru2htdoftpleDXlTwr8CPu39k/hPzqVK4itN77g3by7sr3+X3Z53kPqgc0cWAlFIqP3jkEWjVSt7eDx2Sef1t20LVqrLfMKBWLThyBNq0kUbA0qXQ7spyt/XqSQ/AggUZcwyu8QXv+OXjlCtUjsHNBuPh4jjVruOcjvSo24NZO2ZRzLsY5+POp+2bvHky3Wp0Y+6+uekeQZ5h2rZpadtORp3MtAFQs2hNDf43ieYAKKVUXjt3zv5mfrVTpxyL7ly8KME7PNxevGf8eHjgAdlfvLgU/ImPl7d5Hx+Yc2X+/ZQpsH+/9BxcviwNgJ9/znz6oM0HH0hjwonNZzZTflJ5APw9/alVtJbDfut7VmbtmIUbbmnBv32l9hhI42PuvrnUKFwj7fg94XsY1mIYcUPjGNNqDOZIk9YVrq1HQuUt7QFQSt3dbAVxzpyBEiXy5polSsC778JHH2XcV6YMPPywY3c+wJgxMl/fxQWKFoV77pGGREyM/Rhvb1ni11a7/9NPpWFw7JhUAzRNePJJOS4yUhb6caZ+/Ux7B4r5FAPkzb3pzKa82+xdCrgXYGiLoXy26bO0qXvJyNj9A2Ue4I/DfwDg4eJBYmoiPRv0pEzBMvwc8jNW04qfux9ebl4Mu39YhvsNXD6Qiv4V6d1YK/3dbNoAUErd3SwWCdaFC2d/bE5l1fWe2T5/f3mDL1sWTpyA9eszNkhiY+3n33efvP03bw7FJGhjGNIg8Pa2Jww6066dfQjhKkEFgujbqC/dfu6GOdLkUvwlAsYH8GqDV+lSvQuuFlf6LesHwLvN3mXc31LCt3X51vRp1IdnFjzDgOUDaFepHYu6LaLX4l5cjL/o9F4AEzZNwMfNRxsAt4AOASil1EcfSaGcm80w7D0BR47AmjUyFADQrZvzc7p2lc8dO2T4YN06x/2entKrkeC8El92Dl08RFhsGHvD9wIwa8csahetTbFPilF+Uvm04A8w9u+xmEiDJDw2nJcWvYSbixtzn5jL0sNLiUyMJMArgHH/jGNP2B4aTW+U4X7mSJOYoTEZtqsbT2cBKKXUzZKaKm/mSUky33/DBmjYELyulNQ1DOmRsC3hC5IMeEBK7FKqFJw+be8FMAypCVCqFNSwj7sTHi7DCMnJmQ8DpBN/eD9elasTmxhDgY8KABKYraYVl1EuTGk3hdeXvk5B94LEJsdSxKcI0YnR1ChSg6jEKNxc3Ngdtpuu1buyIGQBKSNScLFID0SKNYWElARCwkNo+0NbhjQfwqBmg677T6kyp2sBKKXU7cbVFXbuBA8PCfTNmkl3fePGEswHDpTx+TJl7OfYgj9I8H//ffv3sWNh9WpZECi9IkWkd8AW/G29CpnwDCjKpqal8XbzJnlEMmu6r2HGfzNwGSVBfPjq4QBEJkVSqmAp/L38iUmOYfu57ey/sJ/dYVIJcOQDI+ndsHda8AdwtbhSwL0ADUs05FLCJX7e93Pu/mbXadrWaRy/fPym3jO/0AaAUkrdLEePSnLfyZPy9j90qGz38JDx/qgoqepnmo7z+evUgQEDpMHw2mv27fv2SW+Cs55cf3/5XLpUegMyEREXgWVyIOVXbGHbuW3M3jmbVt+3Ym/Y3rRjHignMxL6Ne7H8cvHKV9QZgkYhsEDZR6gRZkWAHyw/gO+7PCl0/sYhsE3nb7hn5f/ye6vlKd6L+nN2uNrb+o98wtNAlRKqbxgGPDDD/Dcc5kfU14CJ6VLyz93d8nyj4yUBsHhw9Ij8OST8MsvUu536VI5b8QImS4YFGRfV+C777J/rnbtwDSpN60erhZXtvTc4rC7gHsBXA1X4pLimLV9FnP2yBTDyoH2CoC/HvgVF8MFPw8/AJYclsJASdYk1p2UHIQ9vfdQa2otZnSaQQH3Ak4fpUe9Htk/bx4zR97Zw9zXQ3sAlFIqL5QqBVu2ZH9cbKwEb8OQN/iFC6XhcPCgPRHxf/+TfIH+/WWxnx9+kOD/0EOy32KBBx/M+j6JidKwuGJm55lM7zTd4ZDQmNC0JX0rTK7AlA5TqOhfEYA9YXvwcpF97i7upJqpjFk/hhZlWlCraC3aV2rPzE4zAXAxXChbqCyn3jyVFvxN0+TqHLOOP3VkyYElqNuDNgCUUsqZkBBo2TLnxw8fnvXbv423t9T8L1oUNm6Es2dle5UqktBn4+kJ589Lg2HtWnj8cZnrD5ILsGBB1vfp0EGWBL6ifvH6acV64pPjefW3V/F19+XBcg9yb+l72dtHuvxfrPMir9R7hZblWhKfKiV+vV29+a6z9DYEeAVw9OJRBt03iJd/e5mR948k1UzF9yNfSvjapy0W/rgwpT4tlfY9ISWBJYeW0HFuR86cOZP930ndcDoLQCmlnNm0CV580TEJzxlbMO7Xz/lyvwkJEsyjomS1v2PHoGJF6cZ/6CGp2hcSIsl///0niXu2KoK7dkkZ4NTUHGXzZyU0OpTiE4uTMiKFiLgIgiYEYX3PSkhECPW+qse5t8/x24Hf6LEoYzf9aw1eIz4lnkX7FxGZKL0KYQPDKPpJUaoFViOkbwhxyXF4u3mnnTNx40S2nNlCZGIkq46tIik1iQqFKnD08lE6VerEoucWXdfvozKnswCUUup6NG2affAHGcsfMEAK8Djj5SVv/QULShd/pUrSuDh8WOb9t2oFL70kwR8ko//zz6XQT+3a8OijMmXw2DFZ6e8aGMEGW8/Ji5BhGBQrUIzE4YkYhkFBj4K0LNeSwPGB9FjUgzebvJnh/EUHFvH9zu/57ZnfMEeanBxwktikWAD2X9gP4BD8Ad7+822qFa7Gg+UfxMfNB4Cjl49ijjSdBv87/WX0dqQ9AEopdT22b5fAfvVUPJuPP4Z33oG5c2VM/rXX4OuvZRggIEB6BtKvG+DmJvP3ASIipAGRkCB5Ab16XdMCP4v2L6JtpbZ4unoCsOroKlrPbs2mlzfRdGbTTM+rF1QPP3c/1p1cxxuN3mBSu0mYmFgMC0awQZ2iddjRe0eOnsEINuhQsQOLn1+cYd+CfQt44n9PaMJeHslpD4A2AJRS6lrYMvErV5YpfFdX5AMJ7gULwqRJ0KmTZPOXKSMLAqX//95y5WS8fseVYFqwoDQWEhOvu0Lh5YTLDPxzIDM6zSAyIZKCngWxmlbOx5xnyaElLNi3gJCIEE5EnnB6fhHvIoQNCsMINuhSrQsL9y/E3cWdx6o9xvjW4ylbqCwAMUkxmWb/Z8dWKKhe8XrX/HsqOx0CUEqpGyU0VDLxU1NlCd/0wd/TU6rymSb4+spn//72DP6TJ2UVP490y+weP24P/tOmwaVLstBP+uC/a5cMGbzySq4e9UDEAWZun8na42spNK4QqdZUzkWfo8TEEiSkJFDUpyhBBYJoWrIpPer04Nyb5wAo5FmIGY/OoEaRGlSeXJnE4Yn89PhP/PXSX/z10l/Me2JeWvBPtUoSYGhMKFbTmuvufE9XTw3+t4A2AJRSKreCgmDbNvuCO+mL8bRsCW+/Lftq1ZIGQuHC8NNP9vMHDZK3e1tRH19f+bx8WbYZhuQVpPfMM9C7N8ycmatH7TKvC54unpyJOsPXHb/GxeKSlp3/xtI3+OvkX7xa/1VCwkOYtXMWfZf2pZBHIS4nXGbAsgFMbDORTlU64WZxw9XFlfL+5Wk6sylTt0xNu4eLxYXYobEEFQjCZZQLTWdkPqygbh86BKCUUtfLMKB1axg2TJL6bDp2hMWL5W0/MdHxnAkTpJt/1CipH1C5sgT3vn0l499yfe9nUYlR+Hn4YZomllFyLXOkSXRiNH5j/Xi+9vOsO76OU9GniB8Wn1YPAKBpyaZsOrMJF8OFhOEJuI12I3xQOFO3TOW9te9x+s3TFPUpipuLW4b7hseG4+HqkVY0SN18mgNwhTYAlFI3XGSkBPmUFPj+exkSCAuT+fvp9esHf/8tvQeenjKEkJwsBYGqVZOgv3mzrA2Qw4V8MmMEG6x5cQ0ty7Xkvpn3MfPRmVQvWh2A3ed3U6NIDVxHu/L9Y99TyLMQneZ2YlzrcQxeOdjhOtb3rBjppjc2nt6Y0gVLs+Apex2C5YeX06xMs2vOAVB5SxsAV2gDQCl1U4wcKcMAwcGOb++PPALLlklj4NdfpbjPtm0S4I8dkwTCM2ek9G/HjjLuv2+f4+p+6dmSD53uMtOCdWJKIjFJMRy7fIyHvn+IqMQoOlTuwO/P/I5hGDT/pjl/n/obAF93X2KTYrFi5WDfg9wz9R4SUhMY3mI4ox8c7XCPPw79QSHPQtxX+r60bUawwQ9dfuC5e3JQCEndcNoAuEIbAEqpPHN18I2Kknn606fLsr0258/LnP3PPpPFfVaskK59kOBfv75cp0IFmQ44eLB8/+AD+OgjiI52vO++fTLNMC5OagpERdnzBtIJGBdASb+S7O4tq/MZwQZVAqrg6+HLtnPb0o67r9R9nIw8iYvhQlhsGKu6r6Lnkp4cunCICW0m0HdpX2Z1mkW32t3Spg6eiz5Hcd/iefN3VDdUThsAuhiQUkrlREyMBN2YGPCRwjYkJkqATx/8S5eGYsXs36tWlcI+/fvLNMAGDeDPP6FbN6kNsHixNABME/buzRj8QdYZGDVKagKsX+80+AP899p/uFns4/IxQ2I4HXWakIgQuszrAsDOXjupM62Ow3n3zZK3+ZZlW9J3aV8q+FcgMTUxLfgDlJhYgsXPLCbVTKVT1U65+cup25TOAlBKqZwoUECm4tmCv62Wv6cn/P67bKtaVeb4g338vkwZyd6fNElW5vv4Y1kSuM6VILxhA3TuLD/XrCk9AFfz85PVAAGaNyfFmsKkTZMwTZO45DgOXjjIgGUDqPVlLaZvm876E+tZdXQV1aZUo9qUahTzLkaLMi0oW7Asj897HAB/T3+CfILSbvF3j79Z1E0q9B29dJReS3oRGhOatt8caZJsTabz3M7X/7dUtwVtACil7m6bN2e+r3dve5f/1Knw4Yf2feHhMnc/IUGGAfz9pVKfTUqKBPSTJ6W633ffSab/oEHylv/uu/LWf+6cVAZs3VqSAnMgIi6CAcsHkGxNZtyGcVT9oiqJKYmkWlP58+if3P/t/bSe3Zqw2DBA3vDXn1zPyciTHLl0hMJehbmUcAkfdx+8Xb3xdffl3tL34ufpxy9P/YL1PSvRQ6IJKhDE+L/HYwTL3+Cxao9ptb47iDYAlFJ3r9BQaNIk88A7Zoy9Rn+hQhLIbX78URoBAEWKSPGeN9+UGv/dusn4/15ZYY+tW+Hpp6Ux0batdOXbBAXJ91Wrcjz1L6hAECGvh+AxxoP3W74PQKOSjbg4+CJjHhxDyogUfnnqF5JSk9j26jbK+JYBwMSkRpEarO+xnk8e/oQjl44QlxJHraK1sIyycOTiEbpU74JhGGkZ/YNXDmZws8EZnsEINvgl5JccPa+6PWkSoFJK5cTo0fDeezB7tizh+9BD0NBJntWxYzLWX6OGdPeDzAD4+GNJ4rMF//37pbjP9u3X9DimaXIu5pzDEry2N/XMzOs6Dx93HyITI3lnxTuciT7DqTdPUcqvFCPXjOSvE3+x5qU1Ducs2r+I5mWaE+gd6LB96papPF79cYoVKIa6vWgSoFJK5aX27SURb/9+yeoPTBcQO3WC5s2lO79sWXtVwNhY6TmwLfbj7S29DRaLrB6YfhGgXDIMwyH4A4T0CSExJZFf9v/CD7t+4OjlowBU9q/MC3Ve4OkFT/Nc7ec4G3WW0JhQ/nz+T0r6lgSgTcU2jPprFGGxYRT1KZp2zc7VnI/5927U+5qfXd0etAdAKaWykn7qX3KyvT5/UpL8XKiQlPC1+fBDGDpU9lut8sYfGCjDBRERUhY4V7c32XV+F3WCJGnwnRXv0Lthb8oULIPVtOLm4sbBiIO8s/Idfu32K91/6c7s3bMdruFp8STBmmC/5lXj+JfiL9Hhpw5UCqjEzE4znVb4U/mHLgaklFLX6t9/JeibprytBwXBU09Jxb9q1STA2xbzsQX/gQPlc8IEmfLn7i7H7Nwpx0Ougz/AgQsHqPtV3bQFdj7+52P2hu+l3KRyeH/oTXRiNF9u/ZJFBySD/+rgD7DqxVXED40HJPv/ar+E/MLG0xt5v+X7GvzvItoDoJRSVwsNlWl7o0fD/PmS5FeypLzNV6ggx5QpI42CdesgJETqA1gs0KyZrORXogQUd1I4xzRlZkDZsrl6pC1ntuDr4UtUYhSNSzYmPjkeq2mlwEeSrPdZ28/o37Q/Q1YOwWpaGf/PeIJbBnM66jTT/5sOgL+HP2HvhOFq0dHfO5n2ACilVFYiIqBpJqvWBQXJm32FCvDcc5LUV7euPfgDbNokPQJbtkhy3/z50uUfFCTJgSVKSCPiaitWQLlyOXrEAcsG0PGnjiSlJtF4RmPeWv4Wj/zwCEawweTNkzkbfZYR949Zwl4AACAASURBVI+gR50eDFg+gGGrhrFw/0K83Lz4v7r/x8i1I5n+33RalGnBwb4HuZR4CbfRbsQkxWR5X48xHhy8cDBHz6jyL20AKKXuTtu3S1f/P/9k3Hf8OEybJpX+Xn9dtiUnw7hx9mMqVpRg7uoqwwVt2sjbfVgYDB8OS5ZI4+FqtuMyYZomRrDB2eiztCrXirYV2xKdKNUBP3/kc1LNVH5+8membZ1GlS+qMPqv0dQrXg+ADzd8iMWw0KthL6oEVqF56eYArD+5nq+2fcXmVzbz3v3vpU3xM4INPlz/IccuHXN4hvvL3I+7i+Q6LDm4JNvZBSp/0gaAUurOtmiRVOy72sMPy3z9Dh3ke2iovMGvXStv/CDBPDUV5s2T78OHy3K/+/dL1b/AQDmnWTOp1tezpzQofv5ZZg3kdMzfMKQxgmT3v97odQK9AulcrTMLQhbQdEZTulTrQnxKPFGJUVT0r0iqNZWaRWrKr1LhYXb33s2BvgdwtbhSfEJx3l31LhUDKtKrgRQnGvvQWFYeXcmov0al3fb9B95n2OphzN873+FxVnRfQblC5QBoVb4Vq7qvytnvofIX0zTv6H8NGjQwlVJ3sB9/NM3o6Mz3V6xomr16measWaa5fHnG/dHRpjlihGmCab71lmmeOGGatWrJ9y5dTLN2bdMcP16+lywp19i50zTLl3e8zpkzcsznn2f9vKmppjlhgmlarfZtr79umqdOOT18xKoRJu9jmqZpWq1W881lb5oX4i6YvE+GfxP/mWjO2zPP5H3Mvov7pm2fs2uOyfuY1vT3TIf3MV9Z9ErWz63yDWCrmYP4qEmASqlbJzpa3pzTF8jJLcOQrvjWrbM+rmFDGbOfPx/q1bNv9/SUrv558+Cdd+DAAdkG0KgR9OgBffrA//4nlf5On5Z9CQmS5R8VBZ98IssAjxghK/qtXSv3s60bkF5UFBQsaD//ipikGHw/8qVRiUZsfnVz2tK+Jy6fYPmR5fRs0DPt2Nbft2bzmc1EJzlZOCid8a3HE50Yzej1ozna7yjl/cs7PW5n6E5K+ZXKUOxH5U+aBKiUuv35+spCOtca/EHG07ML/iDleN3cJPnP5ttvJfj/+69M76tQwR6UfXwkwW/pUvl+7pxUArRYICDAXg/gyBGZLWAYUjrYNKFlSxkGcMbPT45JF/xPR53Gw8WDcoXKEREXQXRiNJZRFuKT4ylbqCw9G/TkxOUTGMEGT85/kmEthjkN/knDk+QW7n4ADGo2iCBfWfAns+APUCeoDi4Wl+z/huqOog0ApdSt1bHjjbnuwYMyVp/evn0y9g/Qtau83c+ZI+sBGAasXi1L+VauDG+/LcfZVvo7dkzG+tu3hxkz7MWB6tXLmNRnmvDiizl+1NKflubPI3/SunxrUq2pDF0ldQMenfMoYzeMJS4pjiErh8ivdeEgn276FIBAD8c39qd/fhpzpEnNojWZ2mEqAH0a9XEo/BOVGMXJyycdzotMiMR/nD+JKYk5fmaV/+kQgFLqzlS7tnSzHzqUcV9wMPz2mwT1ixfh+edlGd7SpWVb27aO53l4SE/BiBHw/fdw4kSWmfzXotfiXri7uNOqXCsal2zMg989yMGLByntV5qOlTsyddtUYofE4vORDCtMaTeF6KRoxv89nkntJvH8Pc8DkGJNIeiTIC7EX8AcaUpvgmHBx13O6/ZzN+btnceZt844lBJOsaZofYA7hA4BKKXuTrbAvGuX9AI4c+QIPPGEBP/4eJnjX0ZWzKNcOckDAPtsgNhYuW7HjjBgACxbJtn/994rBYDywIz/ZvDbgd/oUr0Lgd6BHLx4kAN9D3Aq6hSrj68GwOcjH+oF1aN56eb0W9aP87Hn+fOFP3m29rN8t+M7Uq2puI124+V6LxMxSIY6AscHUvHzijSZ0YRVR1cx94m5bH9te4Z1BDT43330P3Gl1J3j999lYR7TlDH8+Hj5efly6Q3o3Bn27JEV/RITpdiPvz+UKiX5AV26wK+/Sh3/6Ctj7ElJMsYfHCzXatxYtoeGSjGg5OQ8efRUM5VpHadhmiaPz3scgAr+FXis6mP8euBX6gfV57/Q/7gYf5Ei3kVINVP5dNOn7AnbQ6+GvXhp0UvUL16fpc8upVmZZsSnxPPW8rdItiaz4oUVDFs9LK3Mb92gunnyzCp/0waAUir/iouTzH5byd22bWH3bvl51SqYOFF+/vZbCdidO8syvcuXS7f+77/LfP777oOVKyX4gyT4XbgAgwbBmTMZkwxNU+7Zu7c0IHIpMSURD1cPh222cfpUaypLD0viodtoN9wsErT/C/0PT1dPwuPCORF5AleLKynWFH7t9is+H/owrcM0aherTe1itQHYEfr/7N13eJRV2sfx70kgoRelShOkKSAo1cKqKIINUBfFjl0sr3VXccUE7GtHQEVFFBvogqCiKKJgQVDpiPRelBoCSUi73z/OpJFCgEwmYX6f68qVmfO0M4+R555T7jOPF395kVY1W3HpuEtZdpcy+0lO6gIQkZJt1678s+fddJNPuZshKsrvt2aNb57/+GNf/uGH0LSpf6hHRsLnn8OmTVCpkh/d//bbsH493Hdf1uC+9eth1CjfilCrFvTtm3WdjPEBw4cf9MeZs3kO5Z4ol/m+1rO1uGnSTbjBjkYvNqLK01UyH/oAES7rn+mk1CTKlylPr+a9SEtPo2PdjlR8siLpj6Zza4db6fNRH+6cfCcAXRt1xWKM9y55L3NAoEh2GgQoIiXb+vW+f76w/1aVLQsnnggPPuib+f/xD7/wjnN+qd4zzvB9/507Q7dufmrfZZflPs+iRdC6tQ8QatXyx7vDT4lrZmxN2EqtirUYOmsoT0x/gr8T/87cPvC0gZSJLEPTo5py3afXcXuH2xnQcQBtXvXf7K9tey3vzn+XBlUa8OK5L/LPT/7pzxtjvPbba9SpVIc+LfscUt3SLT1HwCGlkwYBisiRoUGDgxtxn5Lim/U//hiuvdbP43fOT/97+GG/et9FF/mH/qJFftofwNlnQ4UK/rWZf/iPGOEX96lUKWtA4GFyzlGrYi0AWtdqnfnwf+PCN6herjoNqzXksRmPcd2nfhrhiN9G0P3d7rx14VsAvDv/XTrX68z63eu55IRLGHzGYBbctgCA2zrcdsCHvwXWGli7a22O8ol/TiRySCRnjT6Lak9XK5LPKiWbxgCIyJHngw/877Q0eOUV3+efnu4zBmZk8luyJOcx337rM/5lNOsnJ/uFfsCPA4gouu9L45eMp0b5GqSlp3FirRP55LJPaHZ0M95b+B53fOEXHxrQfgBplsbIOSPZsncLN35+I9OunUaZiDK0rNGSWs/VImJIBBZjPPrdo9SvUp/q5Q88HsE5x3Vtr8u1b9+P+9KqZitG9xnN7n27i+yzSsmlLgARKd3ee88P3vvkE5g/30/pS0vzD+wdO/yCPSkp/mHeowd8/bWfIZCU5PcrVw6qVfODBOfMyUoTvHSpP19e3QMHIS09jblb5tLhGN8im5yWTPTj0UQQQTrpmfstGrCI1q+25oyGZzB93XSaVW9GVJkoNu/ZzPnNzmfMxWNynDdjhb4/7/iTlsNbMuGyCTw/83l+uOGHQ6rnurh1REdGU7tS7UP8pFJSqAtARMJDhQo+lfDs2f7hD37gHviUvXfeCatW+feVKvlUvHv3+oc/+EBgyxb/Olt6XiZMgMsvP+zqTV87nY5vdMx8HxUZhcUYaTFppD2axoTLJ1C3Ul3mbJrj9183HYDlO5dzbLVjmXDZBN5b8B7Lti/DDXac+tapgO/zH3nhSFoOb8nw84dz8biLWbJtSe4KFFLDqg318A8zCgBEJDg2b/bN7odj0SI/0r8gl1zi5/W//75P0dukif9Wv2kT/PgjDBvmxwS0bw/jx/uZAg88AH/95Y9fs8b/PvNMP0UQfDfBwIGHX3+gW+NuWIyRkJKQa1u6pXPvV/cSlxTH92u/z7X9i+VfcMY7ZwAwfc10GlRpwDPnPJO5/eb2N/Nijxc569izGHLmELb9e1uuc4jkRwGAiATHMcf4VfIOx5o1MHmyX2Hv778L3nfHDv/QX7UK5s3zswC6dvXb6tb1zfstW/rpfOec40f2m/lBhied5NcByFCjhs/4d5ij/n9a9xNVn67Kxt0bqfhkRVbvXA1ASloKbrDjqxVfsSZuDQmpCYyaN4onuz1JVGRU5vF3dLgj8/Utn9/C2nvW0rWR/0xmxta9W7mnyz0cX/N4Bp0x6LDqKuFHAYCIBIeZX173YPYfNSrniP8LL/QP9Uce8Q/1vPzrXz7735gxfkrfBRf4pXjPPddvr13bt0YAzJ3rF+np0SPr+EWL/Kp/2R/25crBiy8Wvu75+GHtD+zet5t7p9wLQI/3/HUvHnsxAC/OfJH+7fpTv0p9rmpzFecedy7JaX5Fv17NezHsgmHMv3U+O/69g6PLH81tn98GwJX/u5L2I9tT67lah11HCV8KAESkZEhMhBtv9P3z69bB66/78g0b/Lf/jAd6hqQk37//6qu+2T/DjBl+xb4bb4Rbbslq6p850w8U7NLFv69VywcXbdv6GQBFYMbaGbjBjlFzRzFrwywGThvI7R1u59dNvwLw9DlP+6qnJNH8qOYs2baExJRENuzewPsL3+fHdT/Su3lvACYtm0RSahKr41bz72/+zfbE7VzWyg9I/OcJ/+TB0x7MscpfQZLTkjnSB3zLITCzI/qnffv2JiKlzOjRZuBfg1nHjjm3p6aazZ3rtzVvbta4sdnFF5vNmOHf//23We/efvvtt5u9/37WuW69Nev1JZeYpaf71z17Zp1/+HCzpKSDqjKx2GdLP7MBnw+w9XHrLSU1xcoMKWMDpw40YrGf1/1s6enplpqWasRiPcf0tBGzRxixWN1n69qI2SOs1fBWtmDLAiMWS09Pzzxv45ca2+PTHzdisX2p+zKvWfvZ2kasv097k/eamVl6eroRi62PW5+jbteMv+agPo+UXsBvVojnY8gf0MH+UQAgcoR47jmzMWOyXoPZsmVmtWv71+PG+d9g1rev2cKFZg8+aLZjh9mkSb78r7/MEhP9OS66yGzBArOEBLPHHzdr186XZwQES5YcVPViv4u1DXEbcpVvid9irUe0NmKxqk9VNWKxSz66xGr+t6YRi53+1ulGLPb8T88bsRix2Oi5o/O8xs7EnWbmH+iT/pxkT8x4wojFklOTjVhs295tZmb28i8vW0paSuZxOxJ2WFLKwQU0UnoVNgBQHgARKXnMfBN/+fJZZX37wvHH+1X51qzxU/p27vQj/I89Fs47z3cbHHUUbNvmz9GmjV8SODnZdw1kDAoE3+f/009w2ml+CmHHjvvX4pDtSd7D9DXTufDDC7mz050Mmz0s1z5pj6bx+PTH6XN8H+Zunkv/if0BGHPxGK4+8eoCzz/i1xH884R/ZmYUBIhLiqNquapF9hmk9FIeABEpPlu2+JX5isqDD2al5c04/8cfw5AhPsFPkyZ+4N9bPj0ua9b4sQD/+pcPCsCPHbj4Yj/gb/z43A//t9/2qwDu2uUHDRaBGybegBvsqPxUZS788EKiIqM4rtpxXNT8osx9opwf5R85JJLxf47nxNoncnaTswEY2nMoP63/iV4f9gJgyoop3DLpFpJSk3Jc547JdzB20djM97v37aZMhBK7ysFRACAih69uXbjmmqI735NPwu5AOtr0dH/+9ev9+5494Yor4Jdf/Op+rVr5Ff4Ann7aP/jHjoXXXvOzECZNgsqVs6YRmvlBf5dc4t9XrQrOsfjvxUxePvmgqplu6aSkpWS+f+ysxxh4+kAAFty6AIfjnlPuYWjPoZn7JFty5uv5f80HoHbF2ux8cCev//46P637iR7H9cjc/sbcN/hu9Xc5rjv2n2Pp2yprdcKqT1fl+OHHH1TdRULeRx/sH40BECmlUlN9X/zmzVllmzaZJSf71wkJfp+lS83at/f7du+eNQ4AzM4+26xNG/86OtofB2ajRvnX+/aZxcebmdkDUx6wqMeiCl299+a/Zy1eaZE5CM/MbMX2FbZ061IjFvt25bdmZnbjxBut7nN1bcnWJUYsdtuk2+zcMeda33F9jVhs7ua5RizWZkQbIxZ75sdn8rxe/L54W7VjVaHrJ+ELjQHwNAZApIRIS/P5+Ddt8t/oC+Orr3wTvnOwZ4//Jg++VeDXX/1qfaNH+7Ibb4SaNeGZQKa8SpX8MRlmzYJOnWDhQmjWzM/179LFlx/g30EzwwXyBGS8doMdY/85lvOankfl6Mos276MFsNakP5oeua+z/70LKt3rWZT/CbGXz6eyCG+peKaNtcwZuEY5t4yl7h9ccTti6NLvS7UqpT/vP7bv7idV397Nd+pf79t+o1yZcrRulbrA9xUOdKV6DEAzrm+zrnFzrl051yH/bYNdM6tcM4tdc71yFbe3jm3MLBtqHNFsDC3iBSfyEj4/HO/vG5h9eyZlaBn+XL/u1cvX/bbb/DOOz4IAJ/e95ln4NZb4d57ferfrVv9qn/bt/uHP/iBgeXK+dczZx4w3e8rs14hYkjWP5VRj0fR+Y3OWIzRq0UvqjxdhT3Je6hYtiIAl3x0CW6ww8zYnridhX8vZOLSicR+F5u5z0UtLmJG/xm0q9uOM985k8s/uZyjKhxVYD1GXDCiwHn/l469lPum3FfgOURyKEwzQVH/AMcDLYDvgQ7Zyk8A5gPRQGNgJRAZ2DYbOAVwwJfAeYW5lroAREqJCRPMzjord/muXWbvvZfVrD9pkm/6HzYsq8zM/x45MrNJP1NkpD9vYF79wdqzb4/N2zwv8/2anWus/evt7cRXT7T09HRr9GIju27CdWZmtnLHysypfMRiW/dutTHzx9hxLx9nxGLlHy+fuS3DuEXjcsz7D3fx++IPvJMUiEJ2AYSkBcDMlpjZ0jw29QY+MrN9ZrYaWAF0cs7VBaqY2czAh3sX6FOMVRaRYCtf3ufgh6wm+See8Ev1Xh2YFjd1qm8BOPNMuO8+OP10P8gvPd13Mdx8s2/6z27xYvjuO+jc+ZCqVTGqInUq1eGer+7xVcN4/cLXWfDXAn5a/xNDzhpCtXLVmLJiCscNPY4aFWpw80k3E+ki6fJmFxpXa0zcvjiqRVdj8pV+kOGC2xZknr9vq75YTFYXQ7ir/FRlvln5TairERZK2iyAesD6bO83BMrqBV7vXy4ioZKW5lfqS0k58L6F0aMHfPCBfx0RAS+84NcAePZZnxrYDI47Dv7xDz8jIDkZfv/dN+NHRmbNBNhfixZ+GuGUKYdctaXbl/LyrJep8d8aNH65MR3e6MC9Xe6l69tdWb1rNS/Pepme7/fkf5f9j7s730318tVJszTOPvZsTn/7dBbfvphd+3ZhGBZjtKndBoBz3j2HE4afcMj1yuAG+zEJR8KDc+/DezmnyTmhrkZYCFoA4Jyb6pxblMdP74IOy6PMCijP79q3OOd+c879tnXr1oOtuogURnq6n4e/b1/RnG/iRChb1vfvf/cd3H8/bNwI/ftDw4Y+0Gjc2Cf0qV/fL92bkOCnDGZMEfzqK/87IcEP7vvoI/++dm2oXv2Qq/aPRv/AYoxrT7wWgOe6P8eT3Z4E4KNFH9GoaiMALh13KQCfLfuM9EfTGTl3JE2qNaFWxVrUq1yPmhVr5jjv8+c+z5u93jzkeu1v6ba8GlZLlwplK6g1pJgELQAws3PMrHUePxMLOGwD0CDb+/rApkB5/TzK87v2SDPrYGYdatasmd9uInI4ypb138r3b3I/VBde6Efog1/AZ8AAn6mvZk1/newPhZ9+ykoClOHhh/3CPgCXX+5H+F9xhX9/770QF3dY1du9bzcvzvIrBD409SHKlS3H0J5D+XPbn6yNW8snfT+hbERZBn03iF1Ju5i2ehpPnvUkU66ewraEbWyM38jnSz/Pcc62ddpyaoNT871mSloKAz4fQLoVPFDRYoxXznuFe6bcc1ifUcJLSesCmAT0c85FO+caA82A2Wa2GYh3znUJjP6/FigokBCR0iItDf74A/780z/sTzwR+vWDlSv90r4//uj3q1ABoqKyjrv5Zh8ULFzo+/c/+shPL4yL89/2M4YIArz0ks8WeBiqRFdh0YBFAKRaKmnpadzV+S4sxihfxqcsfrjrwwztMZTNezZzzphzePi7h6kcXRkXaMQcOG3gQV0zISWB135/LWOQdIHu7HQnqY+mHuSnknAWqmmAFzvnNuBH9X/hnJsCYGaLgXHAH8BXwB1mlhY4bADwJn5g4Er8TAARKe0++8xn82vd2k8RXLDAP8zPPhuaN/e5+sF3ByQn+5z/APfc46f81azpt61c6cv/+gvGjMl5DbOs1oECrN65mq178+82zGiable7HWUey0q9u/aetcROj2Xg6QN59fdX2fnvnZnZ/P7vq/+jzatt6Ne6X6GX781QtVxVLMaIjMhnfIPIYQjVLIAJZlbfzKLNrLaZ9ci27QkzO87MWpjZl9nKfwt0IRxnZndaYUJiESnZnPNz8s3g9tt9WWIi9O4N55zj8wCsWOHLq1Xzv/v188l/Lr7Yp/vdP69A8+YHTOyTnyZDm3DV+KsA8vzWfXwNn263+3Hd2fqvrEBhV9IuVu5YSYSLYMm2JVSKrsSqnasAeLb7s4zuM5pH//Fo5nndYMe6uHWc8fYZfLjww0Oqq8jh0uoRIlL8MrICvvGGX5DHzCf06d07awXAbt1g2jSYO9d/e3/7bb9ferqfJRAEGd/Qz3rnLL5f832ub+yfL/uc1y54jarRVSnjyhCXFMftk2/ng4V+9kLZyLJYjLFi+wqW71jOla2vpG6lujSs2jDzHM45njnnGepUqkPTo5vmGhgoUlyUClhEgu+qq/wD/513ssr69PFN/ffe67/Jr1vnl/Fdtgyef96n+s0waZKf/58xGPD7731f/3nn+cGIRWDZ9mXUrlibquWqsnXvVvYk76Fx9cY59nGDHS1rtOTPbX8CUKlsJYZfMJyXZr7Eyp0r2ZO8h7SYNNxg31Xw4GkP8vQ5T2ce//myz7mg2QUa5S5BVaJTAYtImOnZ0/9kMPPT/k4/HQYO9K+nToWTT/ZN/E2b+v3j4/3SwPXrw6BB/tilS/1xvXvDMccUfN02bbLWBjiAFsNaMOg7f42aFWvmeviDbyH49eZfOanOSQDsSdlDhbIVuPSES9mdvJuKUT7V7xPdnqBauWoM6DAg89jElEQu+vAi4pPjWbljJVv2bClUvUSCRS0AIhJ88+bBSSdl9c3ffju8+qpfrGf37qwH+cyZfvpeBud8HoBly2DtWr/Ub4bly32AcPLJ+V/36afhjDPglFMOWMXnf36ecX+M45XzXqFTvU5UeaoKHY7pwLTrpuXYr/+E/ryz4B1aHt2Sb6/7lqrRVan0VCV2P7SbytGVC3U73GDHOU3O4ZtrSn/iHil51AIgIiVHfDycdVbW+5degp07/ZS/Y47xo/bLlMl6UDds6Kf2rV7tH/6TJuV8+INf0a9RIx8k5Legz0MPFerhD7A3ZS9/bv2TobOGAjDzxpk8dPpDuMGO+6fcD8Cm3Zt4Z4HvxkhOS6beC/WYsXYGAL9s+CXzXGt3rSU1Pf8peRZjevhLyCkAEJHCM/MpelMPcr75li3+2/0pp8CwYX7aX/Xqvu//zTd9S0Djxn5wIPiMfh98AGPHws8/w/XX5/2Qj4723QVFMCgw5vsY7j3lXt675D0AGlZtSNOjmjLoH4N44ZcXmLx8Ms1faQ745Xzv7nw3AOd/cD5AZnpfgGNfPpaXf3k58/1nSz/j3q/uLVQ9CgocRIqSugBEpPDS033O/S1bfHrd7O6+2y/BW6uWz9cfFeW/1QPs3esT9uzd6xPy3HQTfPONX9J3YLbkOBs2+Ln+jQP97/HxPt9/69Z+vn+dOrB5c5F+pH6f9OPB0x7EOcf//vgfx1Q+hgEdB9B9THemrppKzQo12ZqwlZoVarIrcRcplkKjqo1oVLURe5L3cHfnu5m5YSbnNT2P3mN7s+HeDdSrknOpkrfmvMV7C9/ju+u+O2B93GDHpH6TuKjFRUX6OSV8qAtARIpeRIRvBdj/4b99Owwd6hPynHeen8OfMTo/KcmnCz7+eF/+0kswcqRP/fvww74bAKBJE5gwwf+ePx+mT4cqVfzKfzVq+MV86tenqP266VemrZ7GSa+fxOM/PM7oeaNxgx1j/zmWy1tdTlxSHBFEsPj2xVzb9lra121PUmoSVctVJSktiT0pe6hWrhq9x/bmhnY3UP/F3HW88eQbC/XwB9h430bOb3Z+UX9MkdwKs2Zwaf5p3759nusli0gR+vRTM+fMZs8269TJJ+G96KKs7bt3+98pKWapqWbJyX6fsmXN1q0zGz/ebPt2X/b11/73xRf710XkuJePs/6f9rd9qfvsvq/us/T09Fz7rI9bbzsSdtgF719gxGJPznjSbpl0ixGLrdmxxojFiCVz/0HTBtnP637O83rr49YXWd1FDgbwmxXi+ahEQCJy+DZs8KPtTzoJZs+GcePgqad8E37lylDRT4/L7BKIjPStBtHRfluDwBpgGV2SQeiafO7c5zi22rHE74vnhV9eAKDDMR24os0VPjufc9Sv4r+99z2hL18s/4KHpz2cefze1L3Urlg785v8I9MeYeisoQw5a0iua83aMIsub3Uh/dF0zfmXEktdACJy+O64wy/hW6aMf3j37esz+F1+uc/sF5ktl/299/o5/StXZmX9KwZ9WvZhc/xmPlr0ERZjrNy5kp1JO2n7WluqP5NzqeBTG5zKPZ3vIdJFMvum2YzqNYpWI1qx5YEtHF/TpwO+us3VDD9/eJ7X6vJWF16/8HU9/KVEUwuAiBSNv//2eftPPNH3+Wd8i3/qqZxz9atVg9hYePxxnw1wwgQ/X799e+jePahVnL1xNpNXrPL1NQAAIABJREFUTOaOTnfwab9PSUpN4vym5+d6UDc7uhnJacmkWRoNqjSgY72OXH/S9QBs2L2BbqO7sXzncvq16sdR5Y/iguYX5Dg+dVAqEU7fr6Rk01+oiBSNBx/0K/fVrZuzfOBA6NEj6/26dT7N765d8L//+bJx4/ySwEGQmu6X7gWIOTOGWTfNAiA5NZkKT1Tg5JEn06haIyBrAaC5m+cy4rcRALz4y4sAPDHjCbYnbCcxJZG9qXv54fof2J64nYSUhFzXjIyI1Ld/KfEUAIjIodsaWBEvIcGv0PfVV3DssfDpp3n346emwqhRfoR/1apZ8/fnzPHTCIOg+jPVqflsTeZvmZ9ZdstntxD9RDSG4fAP6u7vdidiiK/PnuQ9REVGMebiMdzT5R4AHvnuEeb/NZ9mRzdj430bOb3h6Xx9zdf0bdU3KPUWCTZ1AYjIwdu718/Hb9bM5wSoVctn7uvZ08/jj4rKO1dAxtTArVtznzNIpl4zlS5vdaHd6+0yV/d7uefLlC9TnqGzh/Jd/+9IS09j6uqpPH3209w35b7Mb/3XTLgGgCFnDsm1MqBIaacAQEQO3kMP+Yx+2b/lz5zpxwCULevL9+3zaXpjYnyfP2St6vevfxVLNbcnbCfm+xgsxkhLT+POyXcy/Nfh/Pec/5Jmvlug7WttaVmjJRZjmav4je49mmvaXkNKWgrJaclUKFshx3lPfPVE9iTvYdXdq4rlc4gEg7oARCR/zvmlfPf3yiv+IZ+QkHPfZs3865EjoVw5n+3vjjuy9vkukAzn6KODV+dsdiTuYMrKKaSlp/Hqb68y/NfhfH3V1zzz0zMM/3U4P93wEwArd6xkwpIJPH/u8wBc1+46IlwECSkJVI6uTGREZI7zjr98PF9e9SXplo4b7Ni4e2OxfJ4Dif0+ll1Ju0JdDSktCpMsoDT/KBGQyGGYO9dsy5acZb/9Ztarl1l6uk/Ys3ixL//kE5/gZ9s2n+xn69asY1JT/bmKyPLtyy0lLSXf7SlpKZacmmxmZqPnjraWw1oasVhaepqZmR31zFG2K3GXmZl9tfwrK/d4OSMWS05Nts3xm6350OZWZkgZIxbrNrpbgXX5aOFHmecNNWKxmetnhroaEmIUdSIg51wjoJmZTXXOlQfKmFl80CITEQmtBx6Aq6/O3Y+/YwesWuUX9vn9d5/iF+Cf//Tz+x97zL8/9li/mt9XX0FcHPTrV2QJfpq90ozXL3ydpNQkehzXgxY1WuTY3nRoU9bGreXZ7s+yJX4L5zc9nyV3LAEg3dLZl7qPBi82oGp0VS5qcRGJ/0kEIDElkbrP+1kM3Zt057b2t7F5T8FrD1ze+vIi+UxFQeMU5GAUKgBwzt0M3AIcBRwH1AdeA84OXtVEJKQ++AA6dIC2bWHJEjjhBF/evTssWOBH8LdvDx9/DLNm+Yd7aipceaUPAtav92XnneePO4yHv5kRMSSCtfespWHVhpkPOjfY8cZFb+QKAJbcsYTuY7rzyLRH2Je2j36t+2Vu25W0i70pe/nx+h/ZGL+Rq8Zfxbwt8/j5xp+p8GQFrmxzJY+d9RhNqjc55PqKlAqFaSYA5gFRwNxsZQsLc2yof9QFIHKI0tPNLrvMbOpU39S/dq3Zzp1Z22+4wax8ebMzz/TbL73UdwEESb9P+llcUlye2/74+w9LTEnMfH/hBxfazZNutgVbFtgLP79gS7cuNWKxDXEbjFjsmvHX2B1f3GFJKUm2csdK2xy/2czMdibuzGzOT09Pt2snXGt7k/casVj/T/sH7bOJFCUK2QVQqOWAnXOzzKyzc26umZ3knCsDzDGzE4MYmxQJLQcschic83n+69Xzr8uXh8REvyywmU/xu369nwYYHQ3Ll0PTpsVfzcDo/YGnDeTOTnfy5pw3aVunLb1b9iYlLYWox6N4pOsj3HTyTVz4wYUkpiaycudKFty2gDa12+R5Tgu0Omy5fwtLty+lcbXGNKjaoDg/lsghKerlgKc75x4GyjvnugMfA58dTgVFpIQ79lj/O+NLghns3g2TJ/tgIGNp4Pr1/bz/0aOzZgEUM4sx3rv4PZ766SnqvViPmOkxREVG4QY7IlwE3Rp3I+bMGFLSU/g74W/u7nw3/z3nv7Su1TrHed6a8xaPTHsEAOccyY8k8/SPT3N6w9P18JcjTmEDgIeArcBC4FZgMvBIsColIiXAhRf6h3qdOv79tm1+tb927fLe/7rrgrKKX17MjEemPUJyWjLgB/ZdPeFqpl03jeRHfNn9X99PnYp1iIyI5Ntrv6XXh71o9koztty/hbs638W/TvtXrnS9cfviWBe3LvP9nuQ9vDTrJQrTUipS2hQ2AOgNvGtmfc3sn2b2hun/CJEjS0KCT96TYdgwaNgwK7HP00/DokW+FSDEDOOJH57InPMe4SI4v9n5xCXF8f2a7wFYsm0Jnep14oaJNwDw5YovaXlUSyKGRORIC5zdfafcx7sXv5v5vnr56liM5coDIHIkKOwYgLeBbsAM4CNgipmlBrluRUJjAEQKyTlo1AjWrPHv167N3Q0AsHGjb/ZPS8vK5V9C1H+hPr1a9OLKNlfSulZrJi2dxPaE7bSo0YLzm50PwJ2T72TQPwZRu1LtA5xNpHQq0jEAZnY90BTf938lsNI59+bhVVFESpS0ND+/P0OjRj6j36uv5tyvbl0/RTAiwgcNU6bkfb716/0iP0HQ56M+NH+lea7yDfdtYMQFI5i9cTbVn6nOtW2vZeXOlZk5/ccvGc/wX4fr4S/CQaQCNrMU4Et8C8Dv+G4BESntXnjBJ/SJiMga2Jfxjf/mm+G222DTJv9+2DC/2M8VV/j3I0dCx455n/fRR32egCAYfOZgXrvwtXy3X9H6Cj7u+zEAZx57JlOumsJ5753HQ1MfYmK/iQA8NPUhaj934EDg+Z+fz5xlIHIkKVQA4Jzr6ZwbDawA/gm8CdQt8CARKR2efBJ++SXrfePGUL16zn3q1fMZ/e66C1auzCq/+WY46qi8z/v220EbFNi2Tlu6Ne4GwDM/PsOouaOo+ERFfl73M9+v+Z46lerQ9+O+LN++nL4f96Xjmx2JiozirV5v0atFLwCuOfEanu3+7AGv1f6Y9rSrk8/AR5FSrLAtAP2BT4HmZnadmU0uLWMAROQAtm3LuWDP77/7+fzZpafDyy/Db7/BPfcUb/32M3vjbMyM0fNGY2bM2TyHdbvWkZCaQOz0WHq+15Nl25cB0HxYc3oc14Pnuj/HpGWT6Nqoa+Z5WtVqxbVtr818vy91H26wI35fzgznZx57JnNvnVs8H06kGBV2DEA/M/vUzPYdeG8RCanrr/er8BXW1q1Zr3fvhr//hipVcu7jnG8BGDIEpk7N+zxpaUX+jX/sorGkpmd910hMSaTzm53ZHL+Z6ydeT1JqEmP7jiX2rFgsxvhm1Tdc3PJijq5wNCfXPZnG1RozZeUUrmt33QHz5EdFRnFy3ZNzLf1bWqWkpbA3eW+oqyElWIEBgHPux8DveOfc7mw/8c650M8FEpHcVq6EnTsLt+++fT6L365d8OmnULWqz/lfrhxMn55zXzPfCjBpUt7nKlMGWrU6vLrnuJzR73/9GDJ9CLv3+X9uypctj8UYx1Q5Bosxypctn+OYc487l+7HdadGhRq8dsFr3NXpLizGqFGhxgGv55zj91t+L/Ypfx8u/DBHkFNUTh11KpWeqlTk55UjR6GmAZZmmgYoUkjPPQfPPAOXXQaDB/u+/ezT/Mz8+4ULoXXr3Mfv3OlTA+/fenCYMgbgbb5/M3Uq1cm1PSUthbKRZQ94nrsm38WAjgM4oeYJRVq/w5GRbnj5XctpelTRplBOt3TMlMMgHBXpNEDn3JjClIlICeWcT+STYeZM+Pe/c+7zwAO+FWDECKhRI/ccf+f8w/+EfB6g1asX+cM/w8l1T6ZSVCWGzR6WGRDcP+V+2rzahqjHo9iTvOeA5/hg0Qcs376cN+e8yY7EHUGp58FyzmExVuQPf/DJkfTwl4IUdhBgjna9wGJAwZnfIyJFr3XrnN/aV6zwD/v9nXZawf34rVsXe/KfpXcu5bjqx1GhbAWuaH0Fn1/xOQB9W/Xl7s53s+m+TVSKyrupe13cOn7b5FsAY86Ioc/YPtz82c38sPaHYqu/SEl1oDEAA51z8cCJ2fv/gb+AicVSQxE5fAsX+tz+Ga65BpYty3tf52DWrLzL958dUIT+/c2/eWfeO2zcvRGA0fNGU+vZWoxdNJaP//iYVTtXcXSFo7mg+QUAdKnfhZtOvom6lfOfkTxk+hA6vuHzFPRv15+fb/gZgOZH504iJBJuCgwAzOwpM6sMPGtmVQI/lc3saDMbWEx1FJGi0KePn8efYcOGvJfunTwZ2rbNXT5kiM8CGCSfL/uc/hP789C3DwFwUp2TuLX9rTz6/aMA/L7p98x9N8dvxg12pFs64Ffxa/da7rn6b/Z6M3P0f5XoKpzS4BQsxji+5vFB+xwipUWZwuxkZgOdc9WBZkC5bOUzglUxESliFSv6TH5paT6978qVkJrqF/tZtQoaBJa7Pe+8vI8fNCio1XvlvFd4c+6bjLnYDy9qW6ctbeu05bFuj+Xat2bFmjzR7QkinP8O0/zo5pzT5JwCz79211qOfflY0h9Nz7UKoEg4KuwgwJvwCwFNAQYHfscGr1oiUuRGjIBvv80aC9CkiV/45+STfRBQjD5Y+AGb4jflKItPjs9RNnre6Fyr9u1L3cfjMx4n0kXycNeHM8u7NurKc+c+V+A1V+xYwSvnvaKHv0hAYUfz3A10BNaa2VnAScDWgg8RkWK1fj2kpOS/vWpV6NYNmjXLWT5rFtTJPb0umK4afxWTl09mW8I23GBHSloKfVr2YXp/n3tgV+Iubv38Vr5c/mWO4/7a+xeDvstqichYDrgwBn47kC9XfHngHUXCRGEDgCQzSwJwzkWb2Z9Ai+BVS0QOWsOG8Fju5vIc9u6FE0/0gwLzsnNnzsyAQWIxxk0n38TR5Y/mk76f5JjHvyl+E9X/W53ktGRmb5yNG+xISEkAoGHVhliM4Zzj7blvU/2Z6vldIpfZN8/miyu/KPLPIlJaFTYA2OCcq4ZfD+Ab59xEYNMBjhGRYFm3zg/iy87MD9TLLnW/DHNnneW/7d9zD4zJI5XHKadA7eJbKtc5R+f6nVm1M2sZ4mMqH0PyI8lYjDFh6QTAJ8zZX/92/UkZlLPFY33cetxgl+f+IpJTYdcCuNjMdplZLDAIeAvoE8yKiUgBOneGs88ueB8z37e/Zk1W2ezZvrxRI6hZM/cxf/7pF/4JorT0NFbsWAH4fv7z3z+fk18/meS0ZHq+15PU9NTMFgGLMSzGqBhVkeTUZOo8Vyczv71zjjIROccx16pYi5gzYtTPL1IIhUoF7JzLa73PeDMroMOxZFAqYAlra9f6h72Zn8dfAry/4H2unnC1b8of7Bjacyh3db6LxJREKjxZgZRBKTke7MNnDycyIpIBXwygbERZ4gfGE10mOoSfQKRkK9JUwMAc/KC/ZcDywOvVzrk5zjllBBQpqRo18r8jIuDGG30QEOLm8atOvCpzbr7FGHd1vgs32NH/0/5YjOX6Vn/nl3cydZVfgTB5UHKOh/+Q6UMyUwOLyMEpVB4A4CtggplNAXDOnQv0BMYBI4DOwameiBSJBQugXj245JIS0xKQ3R0d72Dyssk8+t2jdG/Sna6NumZusxgjOS2ZbQnbSEhJoMpTVaherjqvXvgqd3e+m51JO9mZuJPq5Qs/IFBECt8C0CHj4Q9gZl8D/zCzXwC1xYmUVJdeCtOmQZs2fnW/SZPgq6+ytjsHP/4YuvoFvHLeK6yOW82Y+WNY9PeiXNujIqM4pvIxREdGU6NCDa5tey3NjmpG1XJVeemXl5i7ZW4Iai1SuhW2BWCHc+5B4KPA+8uBnc65SCC4I4ZE5NBt3+6n/mVYutSXZXj00bzTARcBMyvUYLyk1CQe/OZBkh9JJurxKC494VJe/+11bvvitsyuggyREZFseWBLzuvEaMS/yKEobAvAlUB9/DTAT4EGgbJI4LLgVE1EDpkZLFkC338PF12UVf7993DVVVnvBw8OWhKgiCERPPnDk2xP2J45cj8vK3asYOjsoZSJKIPFGLUq1uLKNlfy4/VZLRPzt8wvkr5+N9gR813MYZ9H5EhQ2LUAtgF3Oecqmdn+C2+vKPpqichhmT8fTjoppAP+Fty2gMbVG1P5qcp0qd+FmTfOzNy2L3Ufe5L3MGPtDC4Zd0mub/GVoytzWsPT2Lp3K/VeqMeegXuYes3Uw67TJ30/oWO9jod9HpEjQWGnAZ4KvAlUMrOGzrm2wK1mdnuwK3i4NA1QpOTp81EfJi6deMDm+11Ju+j0RieW3eWXLk5MSSQqMorIiMjiqKZIqVTU0wBfBHoA2wHMbD7wj0OvnogUmaQkeOKJkE/vy4+Z8fpvr/PY9Kw0xX1aFi6PWLVy1TIf/gAVnqxAt3e7FXiMG+z4ePHHh1ZZkTBS2AAAM1u/X1FaEddFRA7G44/DX3/Bpk3wyCMwdixcVvKG5Cz8eyG3fXEbYxePzSzr367/IQ3eS/xP4gG7Akb1GsWZx5550OcWCTeFDQDWB7oBzDkX5Zx7AFgSxHqJCMCePX6qXkICXHddzhH8gwbB3Ll+Wd+MtL/FOMffzNiTvP+QoCyL/l5EQkoCDas2ZN6t81h0u5/el5CSwKXjLiXdDn4CUbky5XIsHJSX60+6npoV80hzLCI5FDYAuA24A6gHbADaBd6LSDBVqgQTJkCFCvDuu7BxY9Y2M+jZEzp29NP7Lr3UtwIE2c/rf8YNdjz5w5NUfqpyvvu1ebUNL//yMs/+9CztXm/H6p2r2b1vN0mpSYxfMh5HyUtIJBJOCjUIsDTTIEA54p1wArz3Hpx8crFcLjktmTmb59CpXieSUpOIjoxm5c6VND+6eZ77p1s6kUP8oL3+7frzdu+3i6WeIuGqsIMAC5wG6Jx7tIDNZmYHWHxcRILujz+Cevp5W+Yxa8Msbu1wK+Cz8nWp3wWACmUrMG7xOC7/5PJ8+/QjXETmtu5juhMxOIIldyyhRY0WmftMXzOdM985k5RHUigTWdj8ZCJyOA7UBbA3jx+AG4EHg1gvESkhpq2exgPfPJDv9staXZbnwz8xJTFX2aheoxhz8RhaDm+Zo/zUBqcSe0ZsoR/+czbP4UhvvRQJtgIDADN7PuMHGAmUB67HpwRuUgz1E5H9paf7wX6bN+feNn48LF9epJe775T7iB8YX+A+C/9ayDUTrsmqoqVT4ckKrI/LmjyUlp5Gw5cacnaTs3MFDGUjyxJzZuEz9LUf2Z75f80v9P4iktsBBwE6545yzj0OLMB3GZxsZg+a2d9Br51IOFq8GJKT898eEQEffZR3Ct9LL4Vx44JXt3xsjN/IjDUzMt9HuAi2/3s7Dao2yCyLjIhk1f+tok6lw0893PGYjtw48cbDPo9IODvQGIBngUvw3/7b5JEGWESKWuvWMHIk3Hxz/vtcfnne5SFqFh/x6wjqV60PQGp6KmUiynBU+aOyVcuIGBLBsjuX5XeKg/L6ha9jqAtA5HAcqMPtfmAf8Ajwn2wrezn8IMAqQaybSHgqJX3bT//4NAO/HYjFGA+c+gArtq8gLT2Nso+VZeN9G/lrz19Ujq5M06Oa4pzjk76f0Lh64yK59kl1TyqS84iEM00DFCkJ0tJgwAAYPtwn9ElP92VlC056E0pxSXEs3b6UTvU6AT4F73fXfUfTo5pSv0p93GDHyXVO5vdbfw9xTUXCS2GnASoAECkJUlIgKgri433yn7ZtYcGCUtMakJdhs4dxZZsrc3QFiEjwFfViQCJSVOLicpeVLesf9pUq+fczZ+a9XymxZc8W7vryLqpGVw11VUQkHwoARIrTkiVQrdqBv9lXqABVSs8Qmw1xG/hja1ZCojqV6pAyKIW1cWtDWCsRKYgCAJFDNXWqX6znYLRs6af4FeOiPcF235T7aPBSA1qNaJWj/O25b3Pc0ONCVCsRORCNARA5VM75BXquuebA+x7B4vfF89fev2h6VNNQV0VEKKK1AESkAAcTPKelQZky8NdfUKtW8OoUZIkpiZQvWz5HWeXoylSOzn9VQBEpmdQFIFIcIiPh+eehRo1Q1+SQ/bTuJyo8WSHf7Vf97ypaDGuR7/bCWL1zNXM2zzmsc4hI4SgAOFhHUN+tFLP77vNpfEupUxucyn9O/w/Lt+e91sADpz7AC+e+kKNs5Y6VnP3O2YW+xsPTHqb9yPaHVU8RKZzS+69RKFxwgf9dt25o6yGht2kTjB0b6loUi9T0VDbFb8I5xxM/PsH1n15Pt3e65drvpLoncUHzC3KUbU/czpJtSwp9rQ8v/TDfZYVFpGgpADgYX3zh+33zWoVNwstnn0G/fqGuRbF4bPpj1HuhHgDL7lzGTxt+omLZioU6tlO9Tmy6f1Mwqycih0izAEQkT9sStlGjQs4xC2bGml1raFy9MW6w4/86/R8vn/fyAc9lZjh1n4kUC2UCFJFDNvHPidR8tmaucudc5oI+31/3PQO7DjzgueZsnkPEEP1TI1LSqAVARAqUnJZM9OPR7HpwF1XLHXxq39T0VOZvmU/7YzS4T6Q4qAVAJNicg969Q12LImVmuMGOFTtWZJZFRUZxfrPzqRRV6ZDOWSaijB7+IiWQAgCRQ7V4MYwcGZxzp6f7AGPLlqCc3sx4f8H7ucqdc8zoP4Mm1ZvkKP/iyi+IjIgMSl1EJDRCEgA45/o65xY759Kdcx2ylR/rnEt0zs0L/LyWbVt759xC59wK59xQpxFFEmonnAC1awfn3BERMGxY0LIGbk/cztUTriY1PTXXtq6NuhLh9N1A5EgXqv/LFwGXADPy2LbSzNoFfm7LVv4qcAvQLPDTM/jVFCmk+fOLPknUHXcELXFQjQo1sBijTETe2cD7ftyX79d8n/nezHh8xuOkpacFpT4iUvxCEgCY2RIzW1rY/Z1zdYEqZjbT/KjFd4E+QaugyMFq3Nin+i1lJi2dxDM/PpOrfHP8Znbv2535Ps3SGPTdoBxlIlK6lcR2vsbOubnOuenOua6BsnrAhmz7bAiUiZQMVar4VL+lzNJtS/lyxZe5yn+84Ud6teiV+b5MRBksxqhevnpxVk9EgihoqwE656YCdfLY9B8zm5jPYZuBhma23TnXHvjUOdcKyKttNd/5i865W/DdBTRs2PDgKi5yBEpNT83V3L9x90Zubn8z/zrtXyGqlYiEUtBaAMzsHDNrncdPfg9/zGyfmW0PvP4dWAk0x3/jr59t1/pAvvlFzWykmXUwsw41a+ZOZiJy2BYtggEDQl2LQklMSaTsY2WJ3xfP8u3LM/vx679Yn74f9821/71f3UvXUV1zlYvIkaVEdQE452o65yIDr5vgB/utMrPNQLxzrktg9P+1QL6BhEjQrVoFEyaEuhYFSklLAaB82fKsv3c9laMr03xYcz5Y+AEAFmN8c803uY67qMVFXH3i1cVaVxEpfiHJBOicuxh4BagJ7ALmmVkP59ylwBAgFUgDYszss8AxHYDRQHngS+AuK0TllQlQwtHM9TM5ddSpWllPJAwVNhOgUgGLHIHSLZ2/9vxF3cpaulok3CgVsEgYi3AReviLSIEUAIiEgQV/LeDuL+/Od/uf2/7EDVZyTZFwogBAJAws376ccX+My3d71eiqXN7q8mKskYiEmsYAiACYFX0q3xLIzBi3eByXtboMLachcmTSGACRvJjBr79mvT/hBJg40efcL+HT+opCUmoS/f7Xjz3Je0JdFREJsaBlAhQpkVasgE6dspbb7dLFr7j3++8+GDjClS9bXlMDRQRQACDhplkz3wqQYdSo0NVFRCSE1AUgIiIShhQAyJFr40bfzL//QFfn4OWXQ1MnEZESQl0AcuSqUQPuvTf36P5Ro6Bbt9DUSUSkhFALgBy5oqPhhRdyl19/PTRqVPz1KQLvzn+XxJTEUFdDRI4ACgBESpHrPr2OeVvmhboaInIEUBeASCmiKXwiUlTUAiBSit086Wbl8BeRQ6IAQKQUG3TGIL699luSUpNCXRURKWUUAIiUYg2rNqRb426Uf6I8E5Yc+amMRaToKAAQKUU6vdGJLXu25Crf/u/t9G7ZOwQ1EpHSSgGASCmyeOti4vfF5yo/qvxRRDj97ywihadZACKlyN6H94a6CiJyhNBXBhERkTCkAEBERCQMKQAQEREJQwoAREREwpACABERkTCkAEBERCQMKQAQEREJQwoAREREwpACAJES5qr/XcVpb50W6mqIyBFOmQBFgizd0okcEsn6e9dTv0r9A+5/S/tb2JawrRhqJiLhTAGASJBFuAi+uPIL6lWuV6j9zzj2jCDXSEREAYBIsTi/2fmhroKISA4aAyAiIhKGFACIiIiEIQUAIiIiYUgBgIiISBhSACAiIhKGFACIiIiEIQUAIiIiYUgBgIiISBhSACASAmamdL8iElIKAERCYOTvI6n5bM0cZXdOvpOrxl8VohqJSLhRACASArd2uBWLsRxlpzY4la4Nu4aoRiISbrQWgEiQzNsyj8+WfsagMwYVav8r21wZ5BqJiGRRC4BIkMzbMo+XZ70c6mqIiORJAYBIkPRv159t/9ZAPxEpmRQAiIiIhCEFACIiImFIAYCIiEgYUgAgIiIShhQAiIiIhCEFACIiImFIAYCIiEgYUgAgUoTum3IfQ6YPCXU1REQOSAGASBGqWLYiVaKrhLoaIiIHpLUARIrQY90eC3UVREQKRS0AIiIiYUgBgEiIxCXFkZyWHOpqiEiYUgAgEiLVnqlGj/d6hLoaIhKmNAZAJEQsxkJdBREJY2oBEBERCUMKAERERMKQAgAREZEwpABAREQkDCkAEBERCUMKAERERMKQAgAREZEwpABARER04cK6AAAKvElEQVQkDCkAEBERCUMKAERERMKQAgAREZEwpAAg3OzeDaYc9CIi4U4BQLipWhUeeyzUtRARkRDTaoDhJikJypYNdS1ERCTE1AIQbqKjIUL/2YPllw2/kJKWEupqiIgckJ4EIkXolLdOYdrqaaGuhojIAakLQKQIWYwGWIpI6aAWABERkTCkAEBERCQMhSQAcM4965z70zm3wDk3wTlXLdu2gc65Fc65pc65HtnK2zvnFga2DXXOuVDUXURE5EgQqhaAb4DWZnYisAwYCOCcOwHoB7QCegIjnHORgWNeBW4BmgV+ehZ3pUVERI4UIQkAzOxrM0sNvP0FqB943Rv4yMz2mdlqYAXQyTlXF6hiZjPNzIB3gT7FXnEREZEjREkYA3AD8GXgdT1gfbZtGwJl9QKv9y8XERGRQxC0aYDOualAnTw2/cfMJgb2+Q+QCryfcVge+1sB5fld+xZ8dwENGzY8iFqLiIiEh6AFAGZ2TkHbnXPXARcCZwea9cF/s2+Qbbf6wKZAef08yvO79khgJECHDh00MVtERGQ/oZoF0BN4EOhlZgnZNk0C+jnnop1zjfGD/Wab2WYg3jnXJTD6/1pgYrFXXERE5AgRqkyAw4Bo4JvAbL5fzOw2M1vsnBsH/IHvGrjDzNICxwwARgPl8WMGvsx1VhERESmUkAQAZta0gG1PAE/kUf4b0DqY9RIREQkXJWEWgIiIiBQzBQAiIiJhSAGAiIhIGFIAICIiEoYUAIiIiIQhBQAiIiJhSAGAiIhIGFIAICIiEoYUAIiIiIQhBQAiIiJhSAGAiIhIGFIAICIiEoYUAEix6fVhL75Z+U2oqyEiIigAkGKUlJpEclpyqKshIiKEaDlgCU9fX/N1qKsgIiIBagEQEREJQwoAREREwpACABERkTCkAEBERCQMKQAQEREJQwoAREREwpACABERkTCkAEBERCQMKQAQEREJQwoAREREwpACABERkTCkAEBERCQMKQAQEREJQwoAREREwpACABERkTCkAEBERCQMKQAQEREJQwoAREREwpACABERkTCkAEBERCQMKQAQEREJQwoAREREwpACABERkTCkAEBERCQMKQAQEREJQwoAREREwpACABERkTCkAEBERCQMKQAQEREJQwoAREREwpACABERkTCkAEBERCQMKQAQEREJQwoAREREwpACABERkTCkAEBERCQMKQAQEREJQwoAREREwpACABERkTCkAEBERCQMKQAQEREJQwoAREREwpACABERkTCkAEBERCQMKQAQEREJQwoAREREwpACABERkTCkAEBERCQMKQAQEREJQwoAREREwpACABERkTCkAEBERCQMKQAQEREJQwoAREREwpACABERkTCkAEBERCQMKQAQEREJQwoAREREwpACABERkTCkAEBERCQMKQAQEREJQwoAREREwpACABERkTAUkgDAOfesc+5P59wC59wE51y1QPmxzrlE59y8wM9r2Y5p75xb6Jxb4Zwb6pxzoai7iIjIkSBULQDfAK3N7ERgGTAw27aVZtYu8HNbtvJXgVuAZoGfnsVWWxERkSNMSAIAM/vazFIDb38B6he0v3OuLlDFzGaamQHvAn2CXE0REZEjVkkYA3AD8GW2942dc3Odc9Odc10DZfWADdn22RAoExERkUNQJlgnds5NBerksek/ZjYxsM9/gFTg/cC2zUBDM9vunGsPfOqcawXk1d9vBVz7Fnx3AcA+59yiQ/wYUjg1gG2hrsQRTve4eOg+B5/ucfC1KMxOQQsAzOycgrY7564DLgTODjTrY2b7gH2B178751YCzfHf+LN3E9QHNhVw7ZHAyMB1fjOzDofxUeQAdI+DT/e4eOg+B5/ucfA5534rzH6hmgXQE3gQ6GVmCdnKazrnIgOvm+AH+60ys81AvHOuS2D0/7XAxBBUXURE5IgQtBaAAxgGRAPfBGbz/RIY8f8PYIhzLhVIA24zsx2BYwYAo4Hy+DEDX+5/UhERESmckAQAZtY0n/L/Af/LZ9tvQOtDuNzIQzhGDo7ucfDpHhcP3efg0z0OvkLdYxfofhcREZEwUhKmAYqIiEgxO2ICAKUXDr787nFg28DAfVzqnOuRrVz3+CA55/o65xY759Kdcx2yletvuYjkd48D2/S3XMScc7HOuY3Z/nbPz7Ytz/sth8Y51zNwL1c45x4qcGczOyJ+gHOBMoHXzwDPBF4fCyzK55jZwCn4PANfAueF+nOU5J8C7vEJwHz8wM7GwEogUvf4kO/z8fh5vN8DHbKV6285+PdYf8vBud+xwAN5lOd7v/VzSPc5MnAPmwBRgXt7Qn77HzEtAKb0wkFXwD3uDXxkZvvMbDWwAuike3xozGyJmS0t7P66zwevgHusv+Xilef9DnGdSrNOwAozW2VmycBH+HucpyMmANiP0gsHX/Z7XA9Yn21bxr3UPS56+lsOLv0tB8+dge7DUc656oGy/O63HJqDup+hygNwSEKZXjhcHOI9zu9e6h7nozD3OQ/6Wz4Ih3iP9bd8iAq63/jVXB/D37PHgOfxXyJ0X4vWQd3PUhUAWAjTC4eLQ7nH+HvZINtuGfdS9zgfB7rP+Ryjv+WDcCj3GP0tH7LC3m/n3BvA54G3+d1vOTQHdT+PmC4ApRcOvvzuMTAJ6Oeci3bONcbf49m6x0VLf8vFQn/LQRAYQ5HhYiBjgbY873dx1+8I8ivQzDnX2DkXBfTD3+M8laoWgANQeuHgy/Mem9li59w44A9818AdZpYWOEb3+CA55y4GXgFqAl845+aZWQ/0t1xk8rvH+lsOmv8659rhm6PXALcCHOB+y0Eys1Tn3J3AFPyMgFFmtji//ZUJUEREJAwdMV0AIiIiUngKAERERMKQAgAREZEwpABAREQkDCkAEBERCUMKAEQkk3MuLbBa2yLn3MfOuQqHcI43nXMnBF4/vN+2n4uqriJyeDQNUEQyOef2mFmlwOv3gd/N7IWiOJ+IlCxqARCR/PwANAVwzt0XaBVY5Jy7J1BW0Tn3hXNufqD88kD59865Ds65p4HygRaF9wPb9gR+j91vTfjRzrlLnXORzrlnnXO/BhaOubW4P7RIuDiSMgGKSBFxzpUBzgO+Ciw8dD3QGb/YyCzn3HT8muObzOyCwDFVs5/DzB5yzt1pZu3yuMRHwOXA5EDK0rPxmfZuBOLMrKNzLhr4yTn3dWCpWBEpQmoBEJHsyjvn5gG/AeuAt4DTgQlmttfM9gDjga7AQuAc59wzzrmuZhZ3ENf5EugWeMifB8wws0TgXODaQB1mAUfj88OLSBFTC4CIZJe4/zf2wOI3uZjZskDrwPnAU4Fv6kMKcxEzS3LOfQ/0wLcEfJhxOeAuM5tyqB9ARApHLQAiciAzgD7OuQrOuYr41dx+cM4dAySY2XvAc8DJeRyb4pwrm895P8J3LXTFL15C4PeAjGOcc80D1xSRIqYWABEpkJnNcc79f3t3bKJgEIRh+JtO7MbU3JLsQAwOSzC0CAXbsIM7uDFQEf7YbJ4nXVjY7GWHZX/y+ab10N3Xqlon2VXVf5K/PGf4S/skt6q6dPd2sXZOckxy6u7f995JVkkur5uHe5LNVw8EJPEMEABGMgIAgIEEAAAMJAAAYCABAAADCQAAGEgAAMBAAgAABhIAADDQAzlW1HWsEqE/AAAAAElFTkSuQmCC\n",
"text/plain": [
""
]
},
"metadata": {
"needs_background": "light"
},
"output_type": "display_data"
}
],
"source": [
"# Plot the samples using columns 1 and 2 of the matrix\n",
"\n",
"fig, ax = plt.subplots(figsize = (8, 8)) #Create a new figure with a custom size\n",
"\n",
"colors = ['red', 'green'] # Define a color palete\n",
"\n",
"# Color base on sentiment\n",
"ax.scatter(data.positive, data.negative, \n",
" c=[colors[int(k)] for k in data.sentiment], s = 0.1, marker='*') # Plot a dot for each tweet\n",
"\n",
"# Custom limits for this chart\n",
"plt.xlim(-250,0)\n",
"plt.ylim(-250,0)\n",
"\n",
"plt.xlabel(\"Positive\") # x-axis label\n",
"plt.ylabel(\"Negative\") # y-axis label"
]
},
{
"cell_type": "markdown",
"metadata": {},
"source": [
"# Using Confidence Ellipses to interpret Naïve Bayes\n",
"\n",
"In this section, we will use the [confidence ellipse]( https://matplotlib.org/3.1.1/gallery/statistics/confidence_ellipse.html#sphx-glr-gallery-statistics-confidence-ellipse-py) to give us an idea of what the Naïve Bayes model see.\n",
"\n",
"A confidence ellipse is a way to visualize a 2D random variable. It is a better way than plotting the points over a cartesian plane because, with big datasets, the points can overlap badly and hide the real distribution of the data. Confidence ellipses summarize the information of the dataset with only four parameters: \n",
"\n",
"* Center: It is the numerical mean of the attributes\n",
"* Height and width: Related with the variance of each attribute. The user must specify the desired amount of standard deviations used to plot the ellipse. \n",
"* Angle: Related with the covariance among attributes.\n",
"\n",
"The parameter __n_std__ stands for the number of standard deviations bounded by the ellipse. Remember that for normal random distributions:\n",
"\n",
"* About 68% of the area under the curve falls within 1 standard deviation around the mean.\n",
"* About 95% of the area under the curve falls within 2 standard deviations around the mean.\n",
"* About 99.7% of the area under the curve falls within 3 standard deviations around the mean.\n",
"\n",
"\n",
"\n",
"\n",
"In the next chart, we will plot the data and its corresponding confidence ellipses using 2 std and 3 std. "
]
},
{
"cell_type": "code",
"execution_count": 4,
"metadata": {},
"outputs": [
{
"data": {
"image/png": "iVBORw0KGgoAAAANSUhEUgAAAgAAAAHjCAYAAABVQKdLAAAABHNCSVQICAgIfAhkiAAAAAlwSFlzAAALEgAACxIB0t1+/AAAADl0RVh0U29mdHdhcmUAbWF0cGxvdGxpYiB2ZXJzaW9uIDMuMC4zLCBodHRwOi8vbWF0cGxvdGxpYi5vcmcvnQurowAAIABJREFUeJzs3Xd8jdcfwPHPzRSJICQ2sWdra0uMaoxaLdWWouavKC01alWLGlWqrV1FFa1W7U3sPSL2JmJGJILIvrn3/P44iMhNchOJ+X2/Xn1J7nPOeZ6bP/o9zxnfY1BKIYQQQohXi82zfgAhhBBCPH3SARBCCCFeQdIBEEIIIV5B0gEQQgghXkHSARBCCCFeQdIBEEIIIV5B0gEQQgghXkHSARBCCCFeQdIBEEIIIV5Bds/6ATJazpw5laen57N+DCGEEOIxCjBATCgYAAe3J2rt4sWLFChQgCNHjoQopdxTKv/SdwA8PT3x9fV91o8hhBBCJLTlXXj9e8hR5YmaCQgIwNPTk40bN1KnTh3s7e0vWVNPpgCEEEKIp8UYDocHg9kENf5+4uAfGhrKxx9/TGxsLN7e3tjZWf9eLx0AIYQQIqOZ4+DeebDLDM6FQJnAIXuamwsODubnn3/Gzc2NvXv34uDgkOo2pAMghBBCZLSQvXBiNBhsoHhXsE19wH7AZDKRKVMmbG1tUUphMBjS1I50AIQQQoiMcvpXOD8DPLzgjVlP3Jyvry/NmzcnS5YsfPnll2kO/vAKLAIUQgghnrqAvyFfMyjQHOyz6s+eIFiHh4fj7+9P5cqV+e2339LlEWUEQAghhEgvcRH63/CLEBMMzgXBIesTN+vr68uCBQswGAzkyZPnidsDGQEQQggh0kfsHdhQHd49BOWGpEuT69ev59KlS3z22WfUqVMnXdp8QDoAQgghxJMIOwuBG6BkT2joC7aOT9yk0WjEZDJRvHhx3N1TzOmTJtIBEEIIIdLCFA1xkXo734MtfXaZ06XpsWPH4uzszFdffZUu7VkiHQAhhBAiLc5OBRSU7guF26RLk/7+/tjZ2dG/f/9UJfVJC1kEKIQQQqTG0e8g9BCU6q2Dfzpat24du3fvxtHREVtb23Rt+3EyAiCEEEJY4/YRyF4ecnvrbH6G9HuHXrJkCa6urnz++efp1mZKZARACCGESIk5Dg71h+gQ8KgJjk92ct8DSimUUri7u5MzZ84nbs9oNFpdVkYAhBBCiKREXIKDX0HNxVB3Q7o3P3bsWHLmzEmXLl3Spb0zZ85YXVY6AEIIIcTjooN18HerDOW+eaIsfpaEhYVha2tL+/btcXFxSZc2b9y4QdmyZa0uL1MAQgghxKOUgrvHIWizDvxuldL9FuPHj2fBggXkyZOHLFmypEubXbp0wc/Pz+ryBqVUutz4eVWlShXl6+v7rB9DCCHEi+DEGHB0h2LpMyT/OD8/P1xdXSlcuDA2NjZPdJjPA0op4uLiMBgM2NnZYTAYDiqlqqRUT0YAhBBCiEAfMIZD4fbg2TrDbnPo0CHOnTuHra1tugR/gI0bN9K+fftU5w2QNQBCCCFeXUrpYf6gLeCUF7JZP4eeGjNnziRv3rx07tw5XdtVSuHt7U2lSqmfppARACGEEK8mUyysfwNiQqHC6AwJ/iaTCaUUFSpUoEyZMunattlspmHDhly9epUcOXKkur6MAAghhHi1mKLhxkbI1wS8Fqbbnn5Lhg4dSrFixejUqVO6t21jY8OECRPInz+//kApCN5pdX3pAAghhHh1KAXGe3BtNeRtBC6eGXKbwMBAnJ2d6devX7pt83vU9OnTcXFxoW3btvEfGu/CmV+sbkOmAIQQQrwagrbCvk6QyR2qTUvXVL6Pmzp1KmvWrMHNzQ0HB4d0b79Ro0bUrFkz/oPQg2CbWScsspKMAAghhHi53bugh/1zVgeXohl6Kx8fH/Lly8eIESPSbZX/o65evcoPP/zApEmTErZ/7jco0UOfVWAl6QAIIYR4OT1Y4X/rAKg4vcjPuUCG3jIkJARnZ+cMCf4AOXLkoHHjxvHtRwWCMsEbM1LdlnQAhBBCvJwO9oI8DcGzVYbf6scff6RUqVK0bp0xOQSUUowePZpPP/2Ud999N/7CjY0Qc0sfTZxK0gEQQgjxcrmxCTxqQ6mvwClfht7KaDRia2tL48aNyZUrV4beq2DBgmTPnl3/osxw9wQUbpfm9qQDIIQQ4uWhFFxeqOf6XQpn+O2GDRtG4cKF0+00P0v27NlDWFgY7do9EuzvnYdjw8BrUZoPKpIOgBBCiBefMRy2NYY6a6Habxl+u9DQUAwGAwMGDMDJySlD76WUIsG5PaEHIXulVK34t0S2AQohhHhxmWIgeBfYu0CVqWCX+ancdubMmfz777+4urpib2+fIfeIjY1lzpw5vPnmmzRs2FB/aIqFI0MhNvSJ25cRACGEEC+uyKtwYbbe4pdBefwfderUKYxGI/3798+wlf4PhIWFcfbs2fgPQv3AtTS8vSZd2pcRACGEEC+e6+vh0ADIUhTenJXmefDUOnXqFCdPnszw4L9582YcHR0ZPXo0Njb3Q7X/HLh7PN3uISMAQgghXhwxoTqpj/tbOvg/JRs3biQoKIg2bdo8lfutX7+ePHnyULp0aQj3BwxQZWK63kM6AEIIIV4cAfPBxgGKdwN716dyS6UU+fLlI3PmjF9fEBISwq1btxg7dmz8h8G7wRyb7rsapAMghBDi+Xdmol75XvLLp3rbxYsX4+fnx6hRo57K/fbt24efnx9Dhw7VhxaFHoTCbVOumAbSARBCCPH8igkFh+w6+GfQyX2WKKUIDw+nfv36VKtW7anc89SpUzRu3JjGjRvrD8IvQuB6yFUnQ+4niwCFEEI8v3a3gdt+4OEFmfM/tdsuXbqUfv36kSVLFgoUyNjzAwDu3LlD165diYmJ0Vn+Li+CbK9BhTEZdk9DguQCL6EqVaooX1/fZ/0YQgghrGU26XPtS/QAbMA2/Y/TTUp0dDQXL16kVKlSREdHZ3iSH4DAwEBy5cqFwWDQuwti78KRQVDpZ7B1THV7BoPhoFKqSkrlZARACCHE88McBwYbQIEp6qkGf4D9+/czdepUDAbDUwn+AAMHDmTz5s06+F9eBAZbqDo1TcE/NWQNgBBCiOdD7F3YWBMa7IfS/TL+fnFRELIbgrYQfGYD2w/684GXG7UaOcOpn/RhQoaMe082m82Eh4cze/ZsbG1t9TkGoQch51s6s2EGkxEAIYQQz1ZcFFxfBw5Zoe5GsM2UcfdSZgjcANtbwBJ3ODoUUIQV6MF5ly5QeyVUmawPFDr1U8Y9B7B27Vq+/PJLHfyvrYZ75/Scf+aMPcHwAekACCGEeLZib8G1VfoNOJNHxtwj+iacHAsri8PhAZCnAbx/jYvF/2LA33EUefNTBgz9AVxLgnsNqDQBLv2dMc8ChIeH07hxY6ZPn64/iLkFcfcy7H6WyBSAEEKIZ+PmTh1kq06FqpMz5h7h/nB8JFxZAgVaQPUFkKMqGAwopciVyx4vL6/EqX3ts+nkOxngzp07eHl54evrS6Z7fhAcBEU+zZB7JUdGAIQQQjxdxjCIuARulaFEBiX2ibgM+z6DdVUhcwF47yK8ORtyVgODgYCAABo0aICTkxNNmzZNXD/cHxzd0/2xoqKiyJYtG/v27SNTpkxg6wR2zul+H2tIB0AIIcTTdWUpXPoX7Jwga6n0bTvyGhzoAWsrgmNOaHoWXh+ukwndFxYWRqFChZg8eXLSh/pcWgAFP0rfZwM++ugj9uzZg7Ppuh6ZcKsIeeqn+32sIVMAQgghno4LsyBTHijSPv3bjrqh5/gv/glFOkGTUxbXEwQFBdGgQQN8fX0pUaKE5baM4XB9NVT+Nd0ez2QyoZTir7/+IkuWLBB7Wyf6eYZkBEAIIUTGignVq++zvQ5ZS6dv29EhcOhrWF1G36PxCag03mLwP3z4MLly5WLPnj3Y2SXz/ntpAbh7Qab0mwKYNWsWw4cPx9XRiGFvR7DPAvnfS7f200JGAIQQQmSsA92g+Ofpm9PebIQzv8KJMXqovtHRZFMF3717l/79+7Ny5crkE/wYw+HYMKi5NN0eNS4ujo4dOxIVFQUOLlCoFdjYp1v7aSUjAEIIIdKfUnBqgl7wV/2v9A3+N3fC2koQ6AP190K1aUkGf7PZzOzZs3FxccHHx0cvvEvOqXHgUUcvFkwHAQEB1KpVCzsbcPVrA9HBkLdhurT9pGQEQAghRPoyG/Ubro0DmGLA3jV92o0OgcNf60Q+lSZAwQ8hqUV89xmNRs6cOUNUVBQuLilk14u8Bmcnw7t+6fK4ZrMZT09Pli5ZgsHWHl77LuPyHKSBjAAIIYRIP3FR+u3cGAYle6bPPLoyw/mZsKas7kw0OQmFPko2+JtMJvr160d4eDhjx45NOfgDHBkMxT4D50JP/shK8fbbb+Pv70+u870gZD/kqJJih+VpkhEAIYQQT84Uo9/M8zeFd7ak31v/7aN6DYEyQ511etucFWxtbalUqZJ1gR90JsKb26HREUJDQwkICKBixYpJbxNMhlIKg8HAX/PmkL+AJ3iMBeeCqW4no8kIgBBCiCdnvKe3zplNkCln+rTn1xc2e0ORDlB/t1XBXylFq1atOHPmDJ988gmOjlacqBcdAvs/44BdD6pWfwdPT08aNWrETz+l7SyAkSNHMnv2bPLfmq63Jbp4ZuihQmklIwBCCCHSLvQQnP4Zqs+FatOfvD2l4Mpi8PsKcr0DjY9bPW9uNBqxt7dnwIABFCtWzOr73dvcBh+/THy9YDrjxo2jadOm/PLLL1y6dCkNj6/o0b0rtoY4cG2pM/09p56/LokQQojnX1wE3DsP2cpB2YHp0+a9C7C1ERz7Tu8ceGtOqhbNtW7dmp07d1KxYkV9wl4K7t69y/xR73Ll5CYuZf0fJ06coHnz5tjZ2bF7926qVUvdToD9+/fTtm1b3MLWkPXyz3oa5DnY7pcUg1LqWT9DhqpSpYry9fV91o8hhBAvl6vL4dYBKD/yydsyxcDJH+Hsr1C6P5T8CmwdrK4eEhJCtmzZuHPnDjly5LBq3t7Pz48vOr/P2l7BxNVcjVvRug+vnT17lurVq3Pu3DmyZ8+eTCvxlFKYTSaunNuPZ6m3wByTsccaJ8NgMBxUSlVJqZyMAAghhLBewAK4tFBnsUuP4H9jE6x5HW4fhIYHocyAVAV/gKFDh7Jq1Spy5syZYvBXSvH777/TpFF9lvd3wrXqdwmCP8C3335Lnz59rA7+UVFR1K5dm6jrO/AMHqdX+j+j4J8aMgIghBAiZXGRel9/2CmwcQTXJPLoWys6BA72gpBdUHmS3j2QSv7+/jg7O5MjR47kU/veFxkZSffu3Tl48CDbf66Im8NdqLUswQK9Q4cO0ahRI86fP4+zs/Wn9Pn7raBIpWZ6EaRNytMPGUlGAIQQQqSfwwPg8iJ9gM2TBv8rS2HNa+CUW+fuT0PwB1i+fDlbtmyxKvifPXuWN954A7PZjO+iPrhF7YG35iZanf/NN98wePBgq4N/t27d2Lt1OUXuTAJz3DMP/qkhuwCEEEIk7doqyPEGVByn3/yfREwoHPwSQvZBzUXgXiNNzRw5coSIiAi++uorq8r/999/fP7554waNYr/ffgmhs3vQN1N4JAtQTkfHx9OnDjBkiVLrH6WIV3ewqNcA3Bs9lwl+bGGdACEEEIkLey0zoz3pBn9rq2G/V2hwAfQ6DDYWT+8/ribN29y9+7dFMvFxsby9ddfs2LFCtatW0fl14rBuipQ6WfI/nqCsqGhoXTq1InZs2dblTtg4cKFXDh3ikF1zoChCRie/zn/x0kHQAghRGI7W+nc9aX7PVk7sXf1nv6grVB9/hMdCrRnzx6OHDlCt27dUix75coVPvroI3LmzMnBgwfJni0r7GihD+Ip3DZBWaUUXbt2pWXLltSrV8+qZ2lSJoSgCu9DifJp+i7PA1kDIIQQIl74Rf1v2cGQ5Qnn+gM36Ll+G0d9XO8TngiYN29eSpRI+Zm2bdtG1apVef/991m+fLlezX9sBETfhIqJs/vNnTuX06dPM2bMmBTbvnLlCi1aNCeTCqVwgVxp+h7PCxkBEEIIoZlNsOdTqPFvoiHyVDHeg0P94fpaeGMW5LHurTope/bsYd68eUydOpVChZI/qGfevHn07duXv//+G29vb/3hxfk6JW/9vYm2GPr7+9OvXz82bdqU8lHBQL6wv/m+3yfYvPZhmr/P80I6AEII8aozRcOp8XoPvvf2J1vMdnMH7GkPud7Wb/0OWZ/o0YxGIxUrViRLlizJllNKMXz4cObMmcOWLVsoW7bs/efZDn59wHsrOCV8Y4+Li6Ndu3YMGjSI119PvsPz4IyBiQPqUbZSnSf4Rs8PmQIQQohXmdmk9/fbuYAypT34m2Lg0ADY9TFUmQhvznri4H/8+HEaNmyIo6Mj5cqVS7JcTEwM7du3Z82aNezduzc++IedgZ0fQo2/IWuZRPXGjBmDk5MTvXv3TvFZDCdGMaJrNdwrdEqfI46fAzICIIQQr6roYNjSEBrshVIpB8Ek3T4Ke9qBS1F490i6BMgbN25Qrlw5/vnnn2Sz+4WGhtKiRQuyZ8/O1q1byZw5s74QHQJbG0P50ZDbO1G9/fv3M3nyZA4ePIiNTTLvwkrx04SfKO+ZFe+mbSG5si+YF+6bGAyGhgaD4YzBYDhvMBjS6QQKIYR4hZjjIGSvDtR1VqX9wBqzCU6Og83vQKk+UHNxugT/a9eu8d5772EymXB3T7q9CxcuUL16dSpXrsyiRYvig78pGna8DwU/hKKdE9ULDw+nTZs2TJkyhfz58yf/MGd+4dNqtyhX40NwsC418IviheoAGAwGW2AK8C5QBmhtMBgSj+sIIYRIWuQVODtZH73rlCdtbYQHwKa34foqaHAAirRPl0Q4e/bsIV++fOzatSvZE/327NmDl5cXX375JT/99FN8WaVgbydwygvlR1ms26dPH2rUqEHLli2TfhBlZte29Qz94yLubw4id+7cT/K1nksvVAcAqAacV0r5K6VigX+A957xMwkhxIvhznE4MhRcCus9+WkJ2EqB/xxYXxXyN4O6m8HFM10e7+7du4wZM4aoqKhE6X2bjSxHRHg4oDP7NWvWjJkzZ/L5558nbOTYd3or45t/JkrzC7B06VI2btzIxIkTk3+YS/9SzWEZLT/prI/1fQm9aGsA8gFXHvn9KvDG44UMBsNnwGcABQsWfDpPJoQQzyulIC5cZ/TzqJn2dqKDYf9nEO6vU+k+yVbBBI+n+OOPP2jXrh0rVqywWGbF0BM0O+lKjfJjmDx5Mj4+PlSoUCFhIf8/9Za/BnvBzilRG6dPn6Zr166sWrUKV9ckgrrZROjVw3TstYBF/86nfKaXM/jDizcCYKm7mug4Q6XUDKVUFaVUleTmj4QQ4pVwdRn49QX7LJCnftrauLYa1pbXyYEa7E+34A96O965c+eIiopKsowxNpbcLl1YsGABe/bsSRz8g7bA4a+hzmrI5JGoflhYGM2bN2f06NFUq1Yt6Ye5tY/sV39h8OAh2L/EwR9evA7AVaDAI7/nB64/o2cRQojnW9gZffBO/vf01ry0MMXCwa/gQHeovgAqjgXbJzwU6D6z2cyAAQMIDQ1lzJgxSb6V3717lyZNmnD16lV27NiReOHe3dOwq5V+vqylLd6nQ4cO1KpViy5duiTxMEbUjS183PNXLrh/yxtvJBpcfum8aB2AA0Bxg8FQ2GAwOACtAMvjRUII8aoL94d75/VcuG0aDqu5dx58qkPERXj3MOSqnfo2DAa4cMHiJRsbGypWrJj0cDxw+fJlvLy8KFq0KCtWrEicECjyGmxtBOV/gNx1Lbbxww8/EBgYmPy8f+RVDJf+4uv+/SlStGiKX+tl8EKtAVBKxRkMhp7AesAWmK2UOvGMH0sIIZ4vZybqxD5FO6W9jYAF+uject9CiZ5PtsK/WDG9DuERHTp0oE+fPrRq1SrJasePH+fdd9+ld+/e9OnTJ3E+gOgQ2FwPineDoh0ttrFu3TomT57MgQMHLJ/yZ4oB/z8YtTCYkiUb0rJllVR/vRfVC9UBAFBKrQHWPOvnEEKI507UDbDPCvma6fn+tIiLAN8vIXgHvL0B3Co+2TM9FviNRiP29vb07t2b0qUTD9c/sHPnTj744AN++eUXWrdunbiAMQy2vqunN8p8bbENf39/2rdvz6JFi8iXL5/lG5ljISqQNq3b4poth9Vf62Xwok0BCCGESMqJUXDDR2/Lc0xDMLtzDNZVBbMRGh588uBvQefOndmwYQMVKlTA3t5yAqKVK1fSokUL5s2bZzn4m6Jh23vgVlln+rMgMjKS5s2bM2TIEGrWtLDzwRQDfn3Ztm0rvWffxbNIcdzc3J7kq71wDEolWkT/UqlSpYry9fV91o8hhBAZ59x0yNsIMue3uPc9RUrB+d/g6FB9XG6RT9PnuVavhsaNAb2Qz8nJibCwMNzc3JJMv/vHH38wePBgli9fbnm1vtkIO1qCrRNU/wtsEicLUkrRtm1bbGxsmDt3ruVUwkpBwHyiPN7n8tXrlCxZ8om+6vPEYDAcVEqlOJfxwk0BCCGEuM9s0gHQzhmUOW3BP/YO7Psf3DsH9XaCazoFwk8+gQULHk4BjBkzhpIlS9KxY+K5esNwAyj4wekHpk2bxtatWy0HZGXWWf7MRvD6z2LwB/j11185efIku3btShz8lYJdrQkp0I/Wn81lzZpWL1XwTw0ZARBCiBeRUrDZG6pMgayl0tZGyF7Y1RryNYGK49K2UyApRiNERnIrLo7o6Gg8PDyws7NLEJC3BWyjzp91wAxsgLL3yrJ+/XrL8/VK6UWJtw/D2+vBLrPF227dupVWrVqxd+9ePD09E16832FSwXvBrQrHT57itddeS7ev/LywdgRA1gAIIcSLJniP/veteWkL/soMJ3+E7e9BpZ+hyqT0Df4A9vaQNSsrV65kwYIF2Nvbxwf/oUPB0ZFyHuVoU6YNzU41I09YHj4e/3HSi/WOfQfBO6H2yiSD/5UrV2jdujXz5s1LHPwBdrVCBe+mWadR+AdceimDf2rIFIAQQrxIzHFwahxUnQaZ86a+flQQ7PkUTBH6EB/njEmXHhwczLlz5+jQoUPii+3bYy5VEnuTPaF/hGJra8sHoz8gZ46clhs7NQEu/Qv1doBDNotFoqOj+eCDD+jduzf16tVLeNF4D+ycUZV+xpA5L2PHjqVIkSJP9gVfAjICIIQQL4K4CNjfVc9/11oCTrlS38aNjbCuEuSoCu9sTV3wNxhg/HgwmaBcOf1v06ZQqZLF4ufOnWPbtm2W2ypWDOdT/yNr2ay4u7uzdOlSJr03ie5Vu1to6Dc4OxHq+lhM8Qt60V/Pnj0pVKgQX39tYUvg4QFwZTHf/vAb/y78jzJlylheGPiKkTUAQgjxvDOG64V+V5ZAgeapX+xnjtND6P5z4K25kPud1D/Dg4BZujScOpXw2iNxJCgoiFWrVtG5c2fL7ZQty8kCHlQ+vpeatWuybt66JHcE4D8Xjg7RnZUsSWfnmz59OpMmTWLv3r0JMwVGh+iFgjaZUDaOBN64gYuLS7KZB18GsgZACCFeBlFB4FMDlAkKfpD64B9xGTbWhtCD0NAv9cHfYEiYBfDx4P8Yk8lEZGRkktf9v/oK70NHcXjdgfXz1ycd/C//B0cG6mREyQT/LVu28N1337Fs2bLEaYIv/gkBC1i/aTs9v/iCvHnzvvTBP1WUUi/1f5UrV1ZCCPHCiQ1T6soy/bMxIm1tXF6i1GIPpU78qJTZlLY2XF2VatZMKf2en/A/W9uHxW7evKm+/PJLFRcXl7C+2azUxo1KKaWOHj2q8uXLp6ZOnZr8Pa+s0M8dejjZYmfPnlUeHh5q06ZNCS9EBuq6ZrMym0wqJiZGXbx40dpv/MIDfJUV8VFGAIQQ4nlkvAvBu3SoTWLVe5JM0XCgJ/j1gaA2UOjz1I0cmEz6rf/ffyEsDFZYOHNtxQqIi3v4a9asWalZsya2to/tzb90Cby92bN7N97e3owbN47u3S3M9T8Q6MPtbR/w1vlbkL18ksVu375NkyZNGDFiBHXrPnYIUKgf3NhE0M2b1KxVCxsbG8u7Al5xsgZACCGeJ7eP6qx8VaekrX7YGdj5MWQpDm/8Do7ZYf9+qFrV+jaMRsiZEwoVgmPHEl/Plg3OnAEPDyIiIvjwww9ZuHAhLi4uFptbv349bdu2Ze7cubz77rtJ3/fmdtjREq/zweyKBvWd5fhkNBpp1KgRZcuW5Zdffom/EHkVQvZAwQ9RSmEwGLhw4QJFX5HT/R6QTIBCCPEiUUq/9buWgMJpTMXrPxcO9YXXR0Kxz/RbfGpf8tavh4YN9c+Wgj/o0/08PDCZTDg7OzN8+PAkg3/h/xUmfHk4y5Yto0aNGgmuzTg4gzhzHJ9X/ZzGv+Zkjlso7vV82PlB8usUevfujZ2dHePHj094IS4SooNRSuHt7c2MGTNeueCfGtIBEEKI50HQZjj/O3j9AznfSF1dU/T9E/y2wzubIdsTJLh5//2Uy1y7htlsxsvLi//++4+qSYwuzJgxg4B/A/j8l88TBX+AAT4DMJqNfF6sOrOz36L9DViTwiLFKVOmsHXrVnbv3o2d3f0QFh4A52dA+VGYXYphYzAwc+ZMGfZPgXQAhBDiWYq8DuHnIVddcPdKff2IS7DjA3AuDA32g/0TrnKPjk762oULULAgdyMiyGpjw+LFi8mb13IyogkTJjBp0iTO+Z2jWLFiFsvcHngb7pyAzd7kqrOINQU/SPbRNmzYwPfff8/u3bvJmjWr/lApyOSucxsYDAwcMIBKlSrRqlUrq77uq0wWAQohxLMUcUlv0TMYwNYxdXWvr4f1b0ChT8Br4ZMH/+S8+y4UKQJ2dnz88cccPHjQYvBXStFzYE+mT5/Otm3bkgz+gF7vsKUeVJqgtzgm49SpU7Rt25b//vsvPotfeABsbaRPBizQHLPZTL9+/WjWrNkTfNFXiDVbBV7k/2QboBDiuXR1lVInx6Wtrtmk1NHhSi3Jq1TQtrTdKdWWAAAgAElEQVS1EROj1NChSmXKpNRnnym1d69SFSok3uq3aJH+d+5cdfnyZRUdHa0iIyMtP1bHjmqgm5vCHbX+0Prk7x96SKnFuZUK+DfFRw0ODlZFixZVs2fPjv8w9p7eYnjnhFJKqZUrV6pu3bpZ/fVfZli5DVB2AQghxNNkjgNzDBjDICYUspVNXf2YUNjdFuLu6bd+pzypf4a4OH1YzwO2tuDkBOHh8Z9VqwY//wzVq+vUv5Mm8cWSJTRs2JDGjRsn/lpmM1/lzMnO27fptftPPqzyIU72TpbvH3pQv7lXmZrim39MTAze3t54eXkxZswY/WH0TdhcDxoeBBs7TCYTSimCg4PJkycNf4+XjGQCFEKI59G5qXDqJx24Uxv8Q/1gXRVwLaUX+6U2+BsMULGiDv7ly0PB+2cBmEx669/bb+vfbWwgMFAHf+Dc0qVcKVaMiRMn6uCvFDRvrjsMSnE7pyttW7fkQKlSbLp9m/Yb2rP7ym7LzxCyXwf/ajNSDP5KKbp06UKuXLkYNWqU/vDuSX0mQP3dYGNHYGAg1atXx2AwSPBPJekACCHE03D3JNw9DcW6QdnByZc1GuHxkcsLs2BLA6jwA1SeADb2Ca/7+SVM2ftAUJD+3GyGlSvh8GH9+ZEjcPlyfLmYGNiyRf9sNie4tmXLFnbu3JnwAJ1lyyAiAmNcHP+7c4/j506xYcMGsmXLhvpO8U6RxKv5f1/fibANtWl84SaHbQsl/zcARo4cyZkzZ5g7d65OGWwMgwOfQ1wU2DljMpnIkycPS5cuTZyASKRIOgBCCPE03PKFsJNg6wA2KWzAWrcuPnGPKRr2dYFT48F7OxT6yHKdnDmhY8fEn2fLBg4OMHiwPr0vOTly6KkAR0fYvp3TBgObN27ks88+o3Xr1vHl7ucXOMMdPvr4IyLqNWTfLr8kcwEAcHMHbe78x4fXolkTCVsubEn2URYsWMCsWbNYsWIFmZ2c4OJfYOcC72wBOyeUUtSuXZuLFy8muRNBJE86AEIIkZHOTIarK6DIp1CghXV1mjbVw+zhAbChhn7zbbAfspZOuk7BgjB7dsLPTCaIjIRvv4WxY5O/54QJcOuWPvI3OBiKFCHE05PrN25YLB4VFUUpr1JcvnOZZcuW4eSUxHw/cPPCQm6uq0WzS+FsuH9OUJ9NfTh+/LjF8rt27eLLL79k5cqV5M6dG8yxEHoA4sLBYMBoNGIwGFi0aBGFCxdO/nuJJEkHQAghMkJcJCgzeNQEtxTXYyV2fS1seAMKt4Ua/4J9lsRlunTRATtBvevw2mswYwbY2YGbG3zzTdL3sbXV7XTsCL16QY8enFy2jF8WLcLr4kXatm2bqEp4eDiNGzfmk2qfsG/DPhwdk96+uGJbL9j1MR/dgE1R+jPvAt4AlCtXLlF5f39/WrZsydy5c3mtbGk41B9MkVD5l4fbHHv37s2iRYt050CkmXQAhBAiI/j1gStL9YE2mVMxRK3McHSYHvb3WgSlvrI8tw+QNasetn9UZKRewDdihP49pWF/kwlmztRTBb/8AkqR3ds7Poue2fyw6NlbZxm1YRT169enaNGizJ07Nz4b32N6runJvYBFeF2ZygeBsO1+8K+YuyI+nXws5vm/c+cOjRs35ptvvtFnBhhsIVt5sM18/1HMxMTEMGrUKN63JmOhSJZ0AIQQIj3d3Amxt3VyG2uH/B+IuQVbG+u0wA199ehBcn76KfG8f7FiEBIC167p31eutO7e773HhQsX6NSpE7lz59YBdts2PUJw34ajG/imwzdUqVKF3377LdHCu2th19hxaQd15tTB/8QUorZ/SJNrcex8JLlgUHiQxdsbjUZatmxJ/fr16fH557CtGUQE6BGQ+wmS5s2bx5AhQ8iWLVuSHQ9hPfkLCiFEegraBDYOkLNa6uqFHoQdLaHAB1BhTOJV/sm5fRu++ALmz4d581J339hYcHRENWxIwYIF6dSpU/xqfy8vuHABpRRBQUFM/2I6A9sPZPTo0Ql3BNw3ZucYphyYQlNn+D0XNL0O+2MSlinqlvhwHqUU3bt3J1OmTEz4cZQe8Sg/Cpw9H5a5d+8ebdu2JTIyMnXfTyRJRgCEECI9HBqg89q/9l3qg//5mbClIVQcB5XGpy74g97q99df+mcfH1ixIulpA4A37h82tHw5xMZyKzgYr/nzUUrh5fXIeQS2tqjChbHpa8ObNd6kVatWiYL/t1u+pc6cOtyKvMWUA1Nom92Z3z2gsYXg/1mlz9jecXuixxk5ciSHDh3in3/+wXbne3DnmD7Q6P59Tp48SePGjbGxsSFLFgtrIUSaSCZAIYR4EnGRYJcZgrboxX6WFuslWTcKfHvqM+xrLoGspZIu27o1ZM4Ms2Yl0VacDpjWDI1Pnw6urpA7N1F16+KkFBcuXEhwdK7JbGLd+XWUtitNzTo16dOrD3379k3QjMtoFyKMEQCUcCtBk0zR9HO8TKPrcPix4A9YnPefM2cOw4cPZ/+mBbh7VtEL/h450yA0NBQ3NzciIyPJnDlzyt9NSCZAIYR4KrY2gjvHIdfbqQv+4f7gUwPiIu5v8Usm+APUrw/e3pavTZigs/tZ+0I3ciS8/z4xb71FtTJluH37doLgD3A65DRNJjahdu3aDB08NFHwB5jYYCIA/7T8h0qxZ+nneJkG1xIH/5hvYiwG/w0bNjBw4EDWrl2L+40pEOqbIPhHRUVRu3ZtwsLCJPhnABkBEEKItLixETzqgCkqdYEf4Noa2NcRygyGkl8mP1xvDWvr29vDkCHQsyfXcuYkX2wsYVFRuLomPkXw6NGjNGzYkMA3Atn+y3ZqFrK8ILHG7Bp4xV2kt9MNvK8qTsZavvXjHYDDhw9Tv359Nv39Da95tQJH9wTfIygoCA8PD2JjY5PdZigSkxEAIYTIKErBpX8gKjB1wd9sgqPfwv7PwGsxlOr1ZMH/0qXU1TcaoWRJlJsbbb28OH/pksXgv3//fspXL8+gUYNYNGoRx29aTtgDUDpsH184BlL3SuLgb8Dys12+fJkmTZowdepUXssbrY9Efux7dOnSBT8/Pwn+GUhGAIQQwlrmOPDtAeVHg2OOlMsD3LsHWbLoLX67PtEnAdb4B5zSmMTm5k292r9PH52/P1OmZIub8uXjbN3XKX3+DuzZw5HDhylZsiT29vYW8+f/ueJP+nfpz+36tzk84TBLTy/lr2N/carHqYdl6s+rj9FsZFXV97h14Cu8r8E5o75WMXdFQiNDGVZnGB0qdkjU/u3bt/Hy8uLnL16nfstekPPNBNdDQkJwcnLC0dFRtvqlkYwACCFEejJF6xz+eRsnmKdOkasrLP0F1lWG7K9D3Y1pD/4A+/ZB3776jTlTJp3nPxm3Cuei9Ly1sGcPhIQwY8YMjhw5YjH4b9myhQ6tO9Dzh57EFY8j0hjJkJpDEgT/c7fO4ePvQ+nbWwn17cvbjwT/ynkqExoVSsBXARaDf0xMDM2bN6d+/frUf68TOOZMVGb69OnMnz9fgv/ToJR6qf+rXLmyEkKIJxIXpdSqskrF3E593XPzlFqUU6mAf9J271y5lKpZM/53o1Gp3r2VAqXc3JRycdE/P/6fq2t8nchItf+nn9TF0qWTvM3GjRuVu7u72rp168PPgsKDFMNQRpPx4WcMQ33xM8p/DspzJIphqLaL2iqGoXyv+ibZvslkUq1atVJzBr6uTBf+THQ9OjpaBQQEKLPZrMxms5V/HGEJ4KusiI8yAiCEEElRCm5sBttMUG8XOGSzXM5shu7ddVKdh3XNcGQInPgG3t4AhT5OWGfJEli1KuVnaNkSwsKgYkWdq790aZ2yFyA0FMLDLddr3jz+Zycn/P74gzN371os6uPjQ+vWrVm8eDG1a9d++LmHswf7uuzDzsaOvuv70nZJW/plg17ZoM5VCIjT5eYfnw9AoWxJH/E7aODXBF6/TKt+C7HJ1zjR9R07djBmzBgMBoPFJEMi/ckYixBCJCUuHM7/BjnfAoesyZedPh3GjNFD8sYw2NUGjHf1Fr9MHgnLRkXBb7/pg3qaNEl4LThY/+voqHP9T5wIU6boz65f150Ba8yeDVev4legAMFr1tDV3R2GDk1Y5uBB1oeE0K5dO5YuXUqNGjUSXFZKUS1fNc6EnGHC3gmMzgHvZ4Xa1+BaXMKmXB1dORt6lpzOiYf1J0+ejNvNuaz5qTuOOUomusexY8fw9vbmnXfese67iXQhHQAhhHhczC04Ngwq/Qxe/6Zc3sYmfg9+2DnY/h541IbKi8H2kTn6mTPhwgX44Qc9WmBvIeNf+fI6qc/Nm3p/f506OrnPg8+s4empnyl3bmL69iUyOlqfG1ChQnyZW7dYW6UK7d3dWbZsGdWrVwfAMNxA+/Ltaft6W+rNq0e/t/oxYc94pnlAZUeoeQVuxZ8PRKXclTgRdIKwmDCyZUo8QrJiyQJmTh7JslXbyGzh6N7AwEAGDBjAqlWrLK5LEBlHOgBCCPEoUwzYZwOPWvo0utS4vh72tIPXR0Dxbomv+/nprXigD/GZP99CG9f1vw+GwV1c9El9ISEp379wYfD3B3T63DVr1tBv/HjdObGx0Z2PIkUAWL13Lx3d3VmxYgVvvhm/En92s9mM2TmGpaeX6scwG/krN3jYQt2rEP7YxjG/G34Pfy7jXibBtT179rBh5mes+fUT8hYrnehx9+/fT9WqVVm7dm3K302kO9kGKIQQD0RcgR0toME+MKRiiZRScHoCnBoPXgtTPsUvOWaznvdfujT1daOiHm4LDAoKYv/+/TQtVQratIH9+x8WW7lyJV26dGHlypVUqxZ/bsGDeHAn+g5uP7rhZIDFeSBGQasb+t+kmL41YfPI3+zC8Z180bkZX3w3//7Rvgnn9U0mEy1btmTq1KnkyZMn9d9VJEm2AQohhLXMRgjeA84FoO6G5IN/dLROy2sy6d/jomDPpxAwHxrstRz8ldIB8MERvY979IS73Llh61Y9/28NZ2f9b/fu4OTE5cuX6dixIx4eHjRt2lQfFBQQ8LD48uXL6dKlC6tXr04Q/AEyj8pMjh9zkN0pO9lswCcfBJmgZaDl4O9sr++9s+POBMH/5s2bfNPrI77t7s27jRolCv4HDx4kIiKCpUuXSvB/hqQDIIQQEZfh/HQdqB2yJ1/WZNIn7hkMUDYvTHLXHYh6u8D5/ir4DRvig96RI7BzJ9SoAcOHx7djMMCOHXD8uA7iZjNcvAgHDkDjxpDEiv0EDAY9RaAUfPMNCsh79izt27ePX0lvY/NwYeGQKUP4tNOnrF27lipVEr4ghsWEEW2K5nb0bTzHZGJrfjgQDZ2CwJTUn80YwbU+16hRMH7xYGTgAWYPqkYJr//xZoeFFustXryYY8eOpfz9RIaSDoAQ4tUVdhaOjYAsReGtP61Lq+vsrAPurX3wnQkqd4MaC/SJgA94esK0afrnkSOhbVvo2hXOnYsvs3OnPpa3bFkd7Fev1vPznp6W1wY8ysZG7zjo0UO/4Y8eTbirK7WLFSOmVCnq1KkTX7Z6dVCKxYsX8+vQXynSswiVKlXipyY5mDnz84fF6szRdQrZgU+eGBaFw1chkNIk8aKTi9gWsA0Ao9FIj96DcMlZmGHDhiUq6+/vz8mTJxk9enSiHQfi6ZNFgEKIV5M5DjLlguzlU1/3wh9weADUmA35miS+PmoUzJ0L3brBf//Ff96uXfzPjwbAmzf1vL+tbfzUQnKUgv799ahB6dLE9emDy+DB/LZiBc758+syBgOcOQMlSrBw4UJ69erFxg0bebOKXvDXbksos3Kshy66eKPijYgOPcT6vDD2NswMdwQsnOkLRA2JwtHWkXOh5yg5uSRjvcdSWN1hzfT3uXa7HjPmr7W4l//w4cOEhoZSpkwZC62Kp01GAIQQr57gXbCrld7bn/896+uZ48C3F5wcA97bLAd/gD//tP5o3h499DRBbKx1wb95c3By0lsDb97E3K0bXhUqcPnyZUqXfmSl/aRJUKAA//zzD7169UK1Vby1+q2Hlz0iFIP+vADArsu7aJAtO5vzweBbBqbchRhT4uBfq1At1HeKTHaZMBgMuDq64l3Ym6/f7M2CBUdY61uARYsWYf/Y9sawsDDWrl1LixYt6NKli3V/F5HhZARACPHqMBshPEAn9qlSLHV1Y27Bzo/Axl7vEkhprUBygoOhdm04cQKmToW//7a+7oPdAYsXc9fFBVeDgRUrVuDh8ViyoZ49+fvvv+nXrx8+Pj6UKRv/1h0dF41ZmXGyc2LO4TnM9+nEgtzQ6Sasjki649KqbKsEv+d2yY3Pe79y458KTJsRwe7dey2eLnj9+nV2796tdwOI54aMAAghXh0he+HUj3qVv1Mu6+vdOQbrq4FbZai9Om3Bf9o0Pc8P4OEBp07pufzff4c7d6xvZ+ZMvWvg/ffpUKkSu7dvTxz8gfnz59O/f398fHwoV64cNgabhyv1i04sivNoZ3qs6cGKTZ1YkAc+vAGrIyzfsmulrmxst5HuVbvHf6gU3LvAxgPXqfNNMKtXryFv3rwJ6plMJubMmUOJEiX4/vvvrf+O4qmQDoAQ4uV37zwE/KO36FWbkbq6V5bCprrw2nCo+CPYWJEcSKn4hD8TJuh8/X/9pU/yA1i0CJo2hapV4X//S76tzPcXF771lk4D3LkzQWFhREVE8Le/PzUqVkxU5c8//2TAgAH4+PhQtmzZh5+HxYRhGG7gXM9zFMtejKiz05jqAQ2vwfYoy7evnKcyv/n9xoQ9ExJeCPfn7qY2fPJJa2b8uTjBfR6IiorixIkTGB/8LcRzRToAQohXg+l+hLP2oBllhmPD4WAvqLMWCre1/l716sUf09u3L5w8qVf9d++uF/y1awcrV+otf8n5+GNYsED/vHs3ZMkCwK+//srSlStxUkofN/yIP/74gyFDhrBp0ybK/leWpguaopTi7K2zuDq68uf7fzLr0CyaqPOMyGFDnatwyPJaPwAOBh5kRasVrG5zf/QiLhIuLeTcDTOlugfw++8zqVWrVqJ6c+bMwWg0Mm7cOBwdHa36s4mnS9YACCFeXoE+ELgOKv0EWVIx528Mh73tISpQH+bjlDt19125Mv5kwLAwWLtW7/Fv104P/7u7w+XLSdevU0cnAxo5EvLl050HIDg4mPDwcEY2aIDNpk2Jqs2aNYthw4axefNmSpQowZmeZ8ieKTsb/TdSf359OlXsxLLTS+ntdJuuWaHGFTNX4hI1A0Be57xcj7iOg40D1fI9kjAoLpzwy1tp0H4A338/kvfeS7yIUilFYGAgMTHJ9CzEMycjAEKIl4/ZBDGh4F4dilnIyZ+ccH/Y8Jae539nS8rBf98+vb8/JgY6ddJb85yc4jP5deig3+TXrdPTAteuJR/8QQf/3Ll1ToAePeB+kN20aROLFy/G5ty5hNsLgRkzZjB8+PCHwR+gRI4SuDu7U39+fZzsnPjj0GxGuNymkTPUvEqSwT+3c26+f+d71HcKJ3snouOiIeoGHOjBnSg7avTcRZcu/7O4on/58uUcOXKEQYMGkTt3KjtO4qmSDoAQ4uVzdSkc/RbsnMG1uPX1bmyGDdWhWFeo9jvYWjF0XacODBum8/D/8Ufi60uW6GAdGakTAlmjTRt9KJC9Pbz9NqFTprB5zBharV5Nvz594PRpeCST3vTp0xk1ahSbN2+meHH9fcftGsfRG0cxDDfglskNZY5lWcEslHWAt69BSDI7Dj1cPDgadBSAOwPvUMg1PzjmIMatNu+935w6deowaNCgRPVen/Y6K0+t5GU/Y+ZlIYcBCSFeHpFXIfIa5KgGKk5v2bOGUnB2MpwYBdX/htx1dSKfkiV1tr7HnToFpROfbpeIyaT36+/eDT//DL6+cO9e8if7eXvDsmUQEaHLenpy6OhRVlWqxNCKFfWIg4ODzh7o6sqUKVMYN24cmzdvpsj9k/5AH+vraOtIjCmGMtk8GZs5ALOCj29A9CP/28/lnIugiKCHv09qOIlGJRpROFthncwn8jrsaEHc29v48ONWODk5MX/+fGxsEr4/Hjp0iO8XfU+/bv2oXqB6yn8bkWHkMCAhxKsn7AzcOqAX+lkb/E0xsK8LXPgd6u/RwR9g4EA9d/84sxnKlIGrV/VbvcGgV/k/8O23Ou0v6OAPUKuWHgW4fNly8K9QQf9bqRJs3AitW0OuXNzNmZPpv/9OhQoVGDptGnz3HcyerTssrq5MmjSJ8ePHs3Xr1ofBXynF1bCrgE7m82vdEUxzCeC2CT4ITBj8gQTBH8DBzoGiE4uy7dI23aHKnBfl9R/de/QkMjKSOXPmJAr+AE5OTnR8s6ME/xeILAIUQrz4rq+DiItQvDvkfsf6elFBsKM5OOWBervB3uWRNq9brmNjkzDL3/bt+kAe0HP833+vA7+Dg07vu2gRxN2fbH8801+uXDqX/+HDULgw+PnBrFl6LcH58xhjYwkLC9Mdit9/xzjsW+z/WQhduzJ58mR+/vlnrrS4wi2HW3jiCcCqs6to9k8z7g68y7++k6hy5ht2xEDv4IR5/W2xxdbWllhTLHbYEUcc7k7uVMpdCfWd0n+b7e9BvZ0MHfMbR44cYfPmzTg82N1wX1BQEJMnT2bEiBGUKlXK+r+9eOZkBEAI8eJSCqZOhLvOkMPCUH1y7hyDDW9A7nrg9V/C4P9ASql5ldLz9Q/299vb689sbWHyZB38kxMUpEcQPv9c7xL4/Xfo3JmIe/foX7w4Lr6+fN2vH4ahQwlZ+S8OjMB88gTTpk1j/PjxbN68GZOriX3X9j1ssmnJplz56gp3bh2hyeWxLI+AXsGJD/UZVmcYPav21F/z/nl/IVEhLD+1WOc+cMoF9Xczaco0/vvvP1avXo2LS+K/UebMmSlZsqTF3P/i+SZrAIQQz150tH5LthBgknXuNxjcDd69/9ZsrWtrYG8HqPwLeH5iucyZM1CqlB7yTy645cgBoaH6Z5NJjxBERED+/Cln+HNwiN8u6OICR49C4cKYTCbmzZ7Np6NGYRMUpBcYAqFRoSyet4gR3bqSe2Axdo44jqNdwoWKb/z+BrlMoUzJfIHxtxUTLTyCq70rYcYw8mbJSxb7LJwNPYu630VQg0IxHRrAXPsqOJ11pX///uzYsQNPT88EbURHR9O7d29+/PFHi+l/xbNj7RoAmQIQQjx75cvD2bPWH6ATHawT+xT+FBa01av9raEUnJkIp8ZCreXg/lbSZUuUgAsXdPBXCrZsgbp146//9ZdOzHPrFuTNq9/mba3IEgh6YeGBA/HBf9o0KFcOc5EidGjXjh8aNKDDZ5/pjoXZ/LDasgXLGPH996x3zcKb6jzHbh6jSl79//lDgYcYtGkQjqEH+D2Pol8IzL9n+fZhxjBsDbZcv3cdRxtHFIpzXX1xODkabJ05U6Q3nfqWxWO9Bxs3bkwU/AEcHR2pX78+We4nJxIvHpkCEEI8e2fOWB/8Aa6tgKsrwM7J+uBvNsKBz+HCTD3fn1zwBx34H6yqv3ED3nlHf/bllzoot22rT9wDvV7g33/1AT8pBcTXXtPtjRunf793D7p1Q9WogY1SdOjQgVwffaQPDMqeXY8wAHPnzmXo0KFs2rSJMnfCCBujHgZ/AN/rvmQJ8mFxXmgXlHTwf8CkTHqXgDkG9a2Zq1F3UG5VwMaeiIAI3Ne5s3jxYl577bVEdbt3787p06dp0aKFDP2/wGQEQAjx4rixUXcUinZOXb3YO/okP4Md1N8F9qkcss6TR9931izo0gV++gm++UYn+6lVS3cIDh/WQ/8pebB//949aNbs4bRHhw4d6NGjB3UfjDLkzPmwyt9//83AgQPZtGkTJReU5Nta3zL87eEJmr3uO4hf3M3UvwaHrUjAFzE4gkx2mQi9qxMfdTgeQM0i9fjG6SzNmjVj5syZeHl5Wazbpk2bBFsOxYtJRgCEEC8GpcAmE9hmSl29exd0Zr+sZaD2CuuCf0yM5RGJzp315/b2MGIE9O8PgYGwa5cO/o9OATw4xOdREyfqfydN0lv9li8nLi4OpRRDhgyhUqVKiar8+++/9O3bFx8fH0qXLs3hroeZ4TeDFv+00Nv9lBmTX18+dryF1xXrgj/ApH2TsIkOxufKAbzOXMFg58TYN8bSsGFDRo0aRbNmzRLV+f7771myZAleXl6S3/8lIB0AIcTz78xkODcNPLz0iX7WurkdfGpAyS/1gj8bKwc9M2WCr75KMP+ewN69erHf//4H58/Hf24yxS9kjIxMWKdoUT19EBYGX3wBq1YBMGjQIP766y9KlCiBnV3C51u8eDG9evVi/fr1lC1blin7p7A1YCs3wm+w9MxSdvhvZOUfWfE/O48aVyAgidS+DzjZOQHQ761+tCrVmCif2nRe+glFC3hjG2NLgwYN6Nq1K50sLKhUSvFGwzf4YP8Hyd9EvDBkCkAI8fyKiwQUFPwAbBxSLJ6A/59wqD9U/wvy1Etd3dBQfRCPra3lkYD7h/OwZInuCDzaUXg0KdADxYvrRYTZsoGzMyiF0WjEGBnJ4MGDcXZOvI5h2bJl9OjRg3Xr1vH6668TFhPGuVvnMJqNFM1elEymGHL5duSOGV4/G54owY8lV766wgzf39ixbwiF6v1ITMODzCu2jkaFG1F/Qn2qeFdhwIABieotXLiQw4cP8/W3XzPgbuLr4sUk2wCFEM+v4yPBPiuU/ML6OsoMR4bA5YVQexVkTSZlb0yM3up38qQ+wKdWLb26v0ABvQivTx+dEvjBQrfFi+H2bf3mnxwXFz0CYDbrpEA1a8LmzQmKTJs2jcDAQEaMGJGo+qpVq+jcuTNr1qyhcuXKgE7t2+fNPvzU4CfyjTSwNh9si9IJfsyAvY09RrPR4uNkdcxKDqccXOh1AeIiOL32HZzfmkP+HCUxmUy0aNECV1dX5s6dmyjLn8lkIqXbBX4AACAASURBVCYmhtDQUPLnz5/89xbPBdkGKIR4cd05puf7ywwEg5Vb6wDiImDPpxB9E+rvg0w5ky9vZwcBAXpOH3SO/9u3dQcgKgrmz9cdgL17dbKf3r31yvwHihbVWwUfFx6uOwFOTrp+8eJ65X9MDHH58nHjxg0+69yZuHPnElVdu3YtnTp1YtWqVQ+DP0DMkBgcRzlSI2s2dheAFeb8fBl89eH1pDoAXgW92Hl5JzGxd+HwQCj3HaX99oFfaea+P5etE7cSGxvL7NmzEwX/Y8eO0b9/f9atW0dmS2saxAtNOgBCiOfPLV9wdEvdSX6R12F7MzDlgfobwN4p5TqPD/EHB8f/XLDg/9k777Coji4Ov5cmiCB2sYu9FzDGFiu2qDFqYo9dY/k0GnuJqLHHEnvvvcTeRbGgUcTeEEQERFCRXhZ2d74/xgVWUMGYRM19n2ef3b135t7Zm8iZOXPO74Crq9Tvr5EiZbB2bThwQMYJxMbKsr3BwcbXLVVKpjZGR0PTpvJYjRrg4cG5EydYv3496xo2xPSHH4zuf/z4cbp168b+/fup6mQcEGhhZsGllrNwejSbrqGwJSoQrwFelFpSSv58bSymiik6Yaxe6B/hz77v95LfNh/E3wQTMyn1i4w/uH37Nq6urqkkfjUaDeXLl2dtWhUOVT4L1CBAFRWVjwff9fDkIBTrAQW+SX+/sBtw/Eso2AZaHISLHhm/d3BwsuiPq6vcDmjYEGbMkOcNUe9//infu3SRGQDm5km5+gA0ayZ1AcqVkwF/r9C7u+N56RL169dnzZo10LWrkfF3dXWlS5cu7Nmzh23h2zCf8loxo8c7qOwzjVmiEoUqjgZIMv4GUhp/KzMrCtoUJCTSn6JXu+OYq4RMn3xVJGn+/Pns3bs3TYnfyMhInJyciI+Px97ePsOPUuXTQJ0AqKio/PvodXLv3q482KajzG5KnhyGU85Q5TcoN1Ya1a++SrvtkiVvztW3sYF69WRQn04n0/iEgAkT5PkqVSB//mQvwapV8j0gQKoBGjhyRHoPYmKMRIEePXrErFmzEEKkcrXvPLSTjh07smvXLmrVqsXMRjN5NvwZ/hH+KJMUpizPztOznfnyYSRj7pxkhvuMdz6WOG0cG1v8jkaAfYP9YGGXdG7z5s3MnTuXY8eOkTOn8TZJZGQktra2nDt3DiurdHhRVD5Z1AmAiorKv88tF3i4BrI7gk2x9PfzWgSXe8v8/sLfv7v9wIFw547xMV9fqcpnbS2Nd48e0KSJPLdmjTT6Dx7AvHnw5Enqa06fnvzZ1FQG/nl5JeX8CyE4ePAgDg4ObN++PZVy3rlz5/j+++8ZPHswX72auGQyy0Tu33JTZH5hdhYrSO+sUN1fy7WEN6QlvsLWIlnj4FjHA9Tx/oXAgTfJaZ+cOnnkyBGGDRvGkSNHKFSokFF/IQTNmjXDx8cHOzs7VD5v1AmAiorKv0fcU0iIgNJDpa5/etHr4MoQ8F4Czu6Q88v09RMCvvhCfj58WEb8nz8PI0fKYkSWljBoEAQGws6dUvgHZF2ALVvSvuaYMbIkMMjUQRMTGSxYQsYvxMTEsHv3bmJf1wUALly4QNu2bTmx7wTju40HIM9veQiODsZCga15IbcmgLLeYQRoQeHNsrvdK3Ynb5a8AHi0mk2TrS3pl1iF/DkrIISgw64OHD91nB9++IG9e/dSrly55HEEXKDinIro9XpOnjxJ8eLF0/c8VT5p1AmAiorKv4f3Ugg6IgP+TNOZ558YDWdbQ8QdaHwBshRNXz+NBlIGtB08CMuXQ4sW8rtOJ/f3HR1lJb+OHeVxg7pf9TeUG65XT245hIfD8OFyQjF7NpQuzcaNGwFYu3Ztqlz/S5cu0bp1azZu3EijRo2Sjj+PeU7XbS04kd8EE6BVSCbK5a8FkFSxLy3W3VxHn6p9EBMScIq5wsshD1jYYkXS+e0nttOpfSe2bNlCjRrGdRAUFF4eesmBAwdUt/9/CHUCoKKi8s8TdATC70CFSVCkQ/r7xT6Bk1/JWvX1jxjta7+Te/eMSwYvWSJX7nnyyO+lSslIfUOw36FDULSonBiA3BowULiwfLezkwI/Qsi6AGZmUOuVsRYCb29vYtKIOfDw8KBly5asW7eOJobthlfs+noeO7IF80CfmfGa4mxsuxP3APc0V/8xY5Ov7Vy0PgMyv6ToXHvGahzIZlcCSzMpm/zgwQPy7s/LiuUrcHY2FkWKioqihFUJ/I770bp163c+RpXPB3UCoKKi8s+TGAnaqGSBnfQQdl1G+hduD1+sTIpmTzeVK6et6peQIMWADIF8Go1040PyO0Biihz7x49laeC5c9O81dq1a3nw4AGTJ08mj2GC8YqrV6/SokULVq9eTfPmzY07ht+i2p2fuGXtRIcfnvIgzIdW26Qmf1qr/1yzcgEw23k2j8L9+fXPJTyLDSWlwJu/vz+NGzdm+vTptGnTJtU1du7cydKlS1PJEKt8/qj/xVVUVP457kyDrOWlEc8ITw7Cnz2h2hIo1C5jfR8+lII8+fIZH/f2hv374eefZeW9+/eTzxmkfdMS+TFw6pTsl9Iz8ApLS8tUefUAN27coHnz5ixbtoyWLVsanww5TeLZtuSvu5lC6zvDpbTLCmcyzYRGp6GJQxOO+R7jmxItKHNnBDGRcCB7efZ12UUjB7mlEBISgrOzM8OGDaN79+5G10lMTMTb25uePXvyuSvCqqSNKgWsoqLy96ONkcp+UQ/AKi9YZHt3HwNeC+DuDKizB3K+YR/+bZiYyH36lFK8L15ArlzJ32/dAltb6do3eCVS/m3Mlk2K+iQmyn558shyvr6+0oMQEwPW1mz/+Wcsw8P5ZvNmoyEokxQaZG7A3bl3sWhhwaV5l5IC9oQQ3PYYT6nHS2n8KIwzcen/aWJsJMo0WypZgL+JHdvb7cC5mHTxh4eHU69ePVq3bk187Xi+K/sdjvmSlQWvXLnC1DlTGTh1YNKEQeXzIL1SwOoWgIqKyt/PtVEQsEvq8qfX+Ot1cGUw+CwH5wvvZ/xBruZf0+HHxgZSlrutUAF27ICyZaXhf31hFBYmDb+lpdQBcHGR2wAmJtCmjfQEWFlRctMmivv5yXTDFOyut5s7c+8wb948/Av4s+32NgC8XzxgxAIT7O5Pw9EnbeNvZWqFmWLsrG1WvBlNizUG1/oUMINiDm3wGfwwyfjHxsbSokUL6tWrx8SJE9l4cyP3XtwD5ITj3LlzODk5UaBrAZpvbp7qnir/DVQPgIqKyt9H+G2wsgdTK/lK755/YhS4dwR9AtTeCRZZP/zYnj5NvS3Qo4dxpgDIvf7gYFn5r3RpOHYMnJ2NfsupU6c4f+YMv0yYABcuQN26SZMILy8vGjRowKxZswgqEoSdpR1ty7bFzsKGhcss6Jg7D188eMFjrY7MZpmJ1cbimNcRz2BPo2EUsi2Ef6Q/e9vvxePmIqbdO4l+XAwPIgIplLVQUsBfQkICrVq1wt7entWrV6cSHXrx4gX9+/dny5YtmJtnMI5C5ZMgvR4AdQKgoqLy93FrsszRt2+c/j5xT8Hta8juBNUWZzzYLz1ER0svgKGUb44cxmp+KcmVK1n9b8gQuHZNZg+k+NsZFhaGn58fVapUAaTL3+d/PijhCnXr1mXKlCl0794dZZLC8hbL6VOpK8rFriTGBZP7kjt5spXCK9QrXUMXv+iIc/uGi7nakjV7BZxWOiVp++t0Ojp27IhWq2XHjh2pAvsOHz6Ms7Ozavg/c9QtABUVlX+Pxzvg5TWo8EvGjH/EfTheEwq2hS+Wfzjj7+2dvGJ/8AD27pWfDcF+KY2/pVxJY5DINRh/T08Z9X/2rCwTDNy7d4+2bdtiZ2eXZPwBnB2ceRn8koYNG2LdwJrOXTsDICYKRh/uR9TRmqCYUc07lHA9JGgT0vUzhtgBiZFY1T+A23NfnFY60bdqX3ltIejXrx9hYWFs3bo1lfHX6/Xs27eP0DdNdFT+c6gTABUVlQ+PqRWYZDDJ6Lk7uNaDChOh/LiMpQi+i7x5pVt+xgyZ779unXTn50yjXHDDhlIt8MULWfkPYOFCqFpVegyEgDlz0Ol0lCpVismTJ6eS913faD2dvunEgEED8HLwSkrhiw+7w6My9ix/fJ2vH0dw48V9mjg0ISwu7I1DL5uzLM2KNQOgU4XOoNcihKBLxS70qtyLqQ2nIoRgxIgR3Llzhz179pDJoGXwisOHD/Ps2TOWL19O3rx53/85qnxWqFsAKioqH47bU8G2VMZT9QL2wOV+UGMj5Gvy7vZvvVaALMaj1ydPIgYPlkY/Ksq4bffu8vjbKFMGOnWS1f+KFgW9nvCICBo2bIi7uzuWBo/BK54/f069evXo1KkT48aNSzounp0n+GgdXEJhny4PITEhmJuYk6hPfP2OqdhtrzD8ueCRFjpV6MSWW1uS3P4AU6dOZfv27bi5uZE9e/ZU/efOnYuzszMVKlR4571UPn3ULQAVFZV/Dl086LVQuAPkzWBK2YPFcGUQ1D/6140/SEU+kEF+Bjp2lMbf3Nw48C8t4z90qHz/4w+52r97F8aPl0WBBgwg7uhR7Ozs2L9/fyrjHxYWRuPGjfn222+NjD9+W0h0a0n3EBDF+zCq1igUlHca/6s/nKJ0ztL8+lLgp5XHgiKDKGBTIKnN4sWLWbt2LcePH09l/M+fP8/58+cZNmyYavxVUqEKAamoqPx1bk2CLMWgeO/09xF6uDFWrv6dz6df0/9d2Noap/HFx0PBgrLIz6JFMuc/R47U/bp1g/XrYeZMOHMmOU2wfXuYMgVKlkTv6UmdbdvYc/06BQsWNOoeGRlJ06ZNqV+/PlOmTOFS4CVWeq5gWdEChN+ZQz2/GO4kAFdXvnHopoopOqEjW6ZshGnCSDjdgLhwuG8w/sOCsLexT2q/adMmZsyYwblz59J07cfFZUBUQOU/x0c3AVAUxQXoA7yKvGGsEOLwq3NjgF6ADhgshDj2rwxSReVTY8MG+PrrtA3fXyHmsRT4KT8BTC3f3d6ALgEu9YRoX1nNzzKNvfgPRfHisoxv1ary++vPQFHkhOHWLSnoY1DwM6TPnT4NgYGE5shB9osXORUVha2trdElYmJi+Prrr3F0dGTOnDkoisLTCD9ahu1GsXCg/MMYQnTJ7c0wQ4s21VB1QjaqahJGn28388OpMRTN78DtTgeI0kQZGf/9+/czYsQIXF1dKVKkiNF1vLy8cHNzo1+/fhl/Xir/GT7WLYB5QojKr14G418W6ACUA5oCSxRFMf03B6mi8snQrVtqMZwPgf9OCDkFZplBSeefk8RIcGsu1QEbnHy78V+2TO69vw8vX0LNmmAwglevymp/AAMGJLcTApyc5Pm1a8HLyzh+4NkzaNCA/v37c/bs2VTGPy4ujm+++YbixYuzaNEiGRCoCaX10yV849AAU+fztKwoPSNZ09AzaFlSSgJ3rdgVU8WUwrYF6WQDw/Z3pkC24rg9diOLRRYj43/69Gl69+7NgQMHKFu2bKprWlpaki1bBtQWVf6TfHQegLfwDbBNCKEBHimK4gN8AVz8d4elovIJkNFg32nToFkzSJHaZkTwSTDLAmWGZ+y6sUHg1gxy1QbHBWDyjjl81qwyXz8twsPlij1/fuPjQkjjHRcHFy/KV5cusuxvy5ZSA8DKSlYDNHD9uiz7W7QolCxpdLnnz59jaWnJpk2bUun7JyQk0K5dO57qn3Jw+UEpuhPpDWe+hgLfQOWZCBRWXVsFQERCBIDR6v/AgwMAnH7kyvQcOg6Z2jI9sTjXhroDsPHGRqN7Xr58mfbt27Njxw6cnIzjvJ4/f87MmTOZNWsWhQ0VC1VU3sDH6gEYpCjKTUVR1iiKYpjG5gcCUrQJfHUsFYqi9FUU5YqiKFeeG3J4VVRU0s+cOTLv/U3otZCO6HUjIu7CiZpQuCM4LXqz8S9USGrsgwzeW7o07XadOkGB5GA4YmNl4J+JiZwAHDgA/fvLc5s2QefOMqf//Hlp7AEmTpTv3bvLsr8rV6ZKP1y5ciXbtm1LZfy1Wi0dO3ZEp+i4W/suv1/+nciAQ3CyjpwYVZlNnwP9MJks/8we73I81U9wspcGXAECo4K4Gg8ne17E+3/e5LbOTW7r3Pxc8+ek9nfu3KFVq1asWbOGevXqpbqejY0N1apVS6X+p6KSFv/K/yWKopxUFOV2Gq9vgKVAMaAy8BSYY+iWxqXSXNYIIVYIIZyEEE65Uhb8UFFRSR+hodA7jYA+n5XwcC3kawq566T/es/OgWt9qDgFyo1+e45/9uzSGL+LPXvkKn/7dqnjb20tI/xtbSFzZmn8d+wAgyCO4ZpNmyZfw7D/v3IlzJsnC/ssWwbIoD5vb2/GjBlD79eehU6no1u3bsTGxtLBpQOYwq3LozF1/x5qbIDifdlzb0/Syj9flnw03tSYMbXHANClnNzWuPL0CibA+QJQNWte5vV7ivl0W/oe6Jvq5/r6+tK0aVPmzp1LixYtjM4lJibSs2dPYmJiaN8+g5UWVf6zfNQ6AIqiFAEOCiHKvwoARAgx/dW5Y4CLEOKtWwCqDoCKygdArwOhg7gnYJIJMud7dx8D/rvAYwDU3Az2zh9uTPb2cn++cWNp9HfsgNy55bF3MWaM3ArYuFFOdkxMYOdOcHeH+fMBODJgAOcyZ2bab78ZddXr9fTt2xdfX18OHTqElaUl3JqE8F1HhxfWeMTE4TvEF2WSgoKSJAIEYKKY4JTPictPLgNQ2Ay+rzaCpvZlaVChOwDVVlbjatBVzE3NiR8fD8DTp0+pXbs2w4cPp7/Bq/Eahw4dolmzZurqX+XT1QFQFMU+xddvgduvPu8HOiiKkklRlKJACeDyPz0+FZX/JPfngtd8maqXEeN//3fw/AkaHM+Y8TdI975tgRIYKFP8jh6V5XlBbgO8jrk5NH+t4t20abBggYwjOHRIHmvXDubNQ6PRcPr0aZotXcq0tm2Nugkh+Omnn7h37x779+/HysIELnYl2Hst9rcfs+PJXarmrYoySeF45+NGxn/Tt5vQC32S8TcFduQzZ8Pl2TT8owfNNkm1v21tt2FmYoZGpwEgNDQUZ2dnevfunabxHzBgAFevXuXrr79Wjb9KhvgYgwBnKYpSGene9wP6AQgh7iiKsgO4C2iBgUKIdPgJVVRU3htNKOg0UHIQZCTpRujh+ih4chAau4N1BgPSChSQK/HXtwqKFJGu/jt3pFDPoEHyuEGQJzo6ucCPgcREOHxYThImT4b69eV1R40ynmBkyQIODvj/8Qe7du2inl6fSuJ3zNgxuLu74+rqShazODjVDCzzkKPFTW40iWe062jOPz7PyJojabzZuAZClz3S7W+mmHKpQX/OUJBNEQHsa9SF9rvbc/ThUUafHM2MRjPQTJDGPyoqiubNm9O8eXNGjx5t/IiFQFEUevXqRbly5TL2fFVU+AgnAEKIrm85NxWY+g8OR0Xl08fXF4oVy3gmAEDAbqnyV2pw+vvoNPBnd4gNkDn+mVJL06aJIXofZJT+kCGp2zx+DL/+Cv7+Mor/2TOoXFlW7DOQ0vhnywZhYfJ6L15A377yupUrw4gRxsO+d48tBw7QpXhxFi9enOrWU6dOZebqmXSf3x07JQiOt4TCHQh2GIj9DDucHZw54XsCAEd7xzf+TL3QcdVrG5ODXhCuhyE1fqK/U38ehT+iYp6KPI95Ti7rXPi98KPoF0XpXr87M2fOTDUZmTx5MsWLF6dz587veLAqKmmj+otUVD53smSB1q0z1uflVXh2For3TZ/xL1lSRtQnhMPppqBPgPon0m/8Qa7cUwbopYUQ0pBXrAgeHvLY9evw2uqYnj0hUyZp/C0sZGaBIQiwVSupA/CaIFBstmxce/iQhITUlfnmz5/PunXruOZ+jWV12sDJejwp3BsqTSWXdR5+rf9rkvEHaL87dSCeGfBH/kzYmUCfwBesarsLgCeRTxjtOppGDo3o/EdnNt/aTEJCAj/+8CNkhhXLVhgZfyEEOp2O3r1707Jly7c/LxWVt6BOAFRUPndy55YR8xkhIRw0L9PffsgQaPoFnKgDdhWg1g4ws8rYPR88kIqFKQkKkl4BvV4G7CmKzBKIiJAaAAavQcpVP8CaNaDRvPotCTJW4MYN+b1hQ+jTJ6mpEIKFCxei1+uZO3duqkp6K1euZP78+bi6ulJZXCCTRx9eOK6gwN6xFJxXkJDoEEbWGskvX/2S6if99MVPAFgqct/ysD4/YXpoX649dQrX4XS30/x+6XcASmQvgZgoGOQ0iC5dupDJPBMJ1xIwNzcuiTxm3hgGDR1E/vz5U4kSvS+xibHEJqYRP6HyWfPRbQGoqKj8iwTsgdgnUGpQxvp1rgt7a4KrKWz4/f1K+ZYokfqYvb3c63/0CH74AVavhl69ks9XrWq8tWFuLvf83d2hcGFp+OvUkVsHFSumeVshBPHx8aTMiDLsr2/atIlJkybhdvokuYOmwouz4OzO+Se3AAiMDKTskrJo9VpiEmOoU6gO5/zPJV1n/uX57Px2M6U8O1M3EFY99eVs97N8te4rviv7HW3LtmXd9XWsaLGCyssrc7f/Xeq0rkNoSChxd+JSGf+4uDhmhs3EpalLxp/vW8g1OxdmJmZEjI74oNdV+bhRJwAqKirSiAot5KgGtmUy1jfEDdzbQ9Ex0CDv+xn/N6EocPu2nBx06JBs/Nu0kRODa9eM25YoIav3DRsGly5BSIgsD/wGUaMFCxbQsGFDRrwWD2Ay2YSR2Ucya8wsbp13J7/fAM76nabRD6Hs8jmJxxOPpLYRmgjK5yzP7Re3k4y/Q1YHfCN8aZOrAN/t6UwhKztqFqvFYe/DHPCSyn+5zGXcwrrW6wDoXbU3AwcOJFNkJuhAqkqDV69eZcyYMYhjHz51O2ZszAe/psrHjzoBUFFRAd91EOUFlWdkrN/j7XDlf1BrG+RtAHU/8LiyZoXISKnRX7Om9ASUKyeNf0oMwX5378rvTk5QpoyM/A8LSyXva6Bw4cKpSuiGRIcw3n48y8cvp9r/cuLg1wWr/E1p0P0welMzdt/dzaOXj5La963alxVXVxhdwzfCl1HZYIDNM1xDoYZDE8xNzBEImhZvypw/51B3S/LD0v+iZ+TIkXh4eHDvwj0j175nkCfEgWNVR3bu3Pk+T1FFJU0+aiGgD4EqBKTyn2XNGrliftu/cW0sJLyETLlk4J75G3T30+LeXPCaB3UPQba03esZwlCAp18/mDVLRu5bplFh0NZWTgpSUqGC3Ov38pJZAqNHSwXAa9fk1sGtW0bPYf369VhbW9OuXTujyyiTFAqFFcJ/pT83Dywjf/AQ/PJ15LDiwBGfo1wIvMDWtlt5GPqQ8W7jGVljJLMuzjK6RiYFtMKE2lmsiTDLSvPyP1DYrjAdynfANpMtsYmxhMeHU2VZFUrlLMWlwEuM1Y9l9+7duLm5pZqQKKMU7HbYEeIVkkqOWEUlLT5ZISAVFZUPRNOmcs/8bQTuB+/lYJop/cZf6MFzKPiulml+72v8hQCtVu7Pg9Tnr1hRyvL26wcFC8qVPcgVvQGD8a9fX7bz8ZEGvmFDWLdOKgOamsKxY1IO+ObNVJMgJycnKlWqlGpIk4pNImZzDLd3jKVC2ASy19vDTbu6TDozmdWt5LPsuLsj10OuAyQZ/x+r/ph0jfUFstLSWs+Z6ChO97vFtPPT6HewH1lnZCVRl8iAQwPIPzc/ISNCONvjLFOtprJlyxZOnDiRyvg/evQIMVMQ4hXCIs9FXAq89H7PWkUlDdQJgIrK50q+fDIdLi2iHkLwKSjSASpOTv81dQlwoTOEXQXn82Bd6P3H9913MmivSBEZ1f/8OZw7J421s7Ms5xsWJicyBi/e7Nnyd4E07MuXy2wAkJOEkSOlMiDI9D+DQuArTp48ybhx4yhXrhwlXgs6vH79OkuGL+LiMmfKabdAw1Po8jbG1dcVrdASkxDDsC+H0aNSD64+vQpAzsyylPGyq8uomsmULAqElRmHa2IWAOquS3bzD/1yKOam5qxrvQ4xUU5IlixZwpIlS3B1dSXPa2PV6XT88MMPBAUFYWFhwZwLc5JUBFVUPgTqFoCKyn+R5xcg8h4U6/Xutga0sXCuHZiYyz3/jKb5vU5srHzlzJn6nCGQcMoUmDAh+biZmfQaGMiSRU4UataUk4S3/D0TQhAVFYW/vz/ly5c3Oufl5UXTRnU5O9uBgtmBr/YSoNFQaL6c4JTNVZZn0c94EfcCgEq5K3Htx2s4rXBCCMG1kGtMzwHHYk1xi9MlGXgDQ48NZf6f842Or1+/nvHjx3PmzBkcHByM2t++fZuSJUtibm6eSgBIReVdqFsAKioqqQlxg3u/Qa6aGTP+CeFwuglkygl1dv914w+yYl9axh+gaFH5ntL4g7HxBynos2ePNP4hIW+8lZeXF61atcLGxoby5csbpfydvHqSDt9+xeXpmTkbfpGReiewzI29jT1Lmi9hVqNZONo78iLuBcqroqTVC1THZLIJV4OvUiv+Gm3syzAmFNzidEz4agIWUyy49/weFwMuEh4fzoWACyROSC6fvHPnTsaMGcOJEydSGX+AhQsXcu3aNdX4q/ytqFkAKir/FfQ6sC0Nphk03nEh0vjn/goc54PyN60b/vgD2raFCxdktD9I0R9TU7k9ULIktGgBc+cm9ylQANq3h/XrpeBRGuh0OkqWLMmcOXNQFAWdXofZFDOe/vwUJUZhfF9nDgyFXFWmUSBzDRrlKkPTTU1pUqwJV4KusOX2FnpU6gGQVNzn4IODADRxaEJAyDGuPL8HwJpWa6hbpC4eTzywNLOk5pqabG6zmctPLmPy6rkdPHiQQYMGcfz4cUqXLm001rt372JjY8Py5cs/2GNVUXkTqgdAReW/QOABuDIQrPJCzurpHXokFQAAIABJREFU7xfzGE7WgYLfguPvH8b4168vI/Pj42H7dpnWd/Gi9AhUrQo//SRjA+zspHv/+XPZ78ED+Pbb5OtYWcm+OXPKvP80iI6OxsnJidjYWEq+SgU0NTHler/rWGotWfxzNVwHZ6ZAs/1Qbgx1i9Yjl3Uujj08xrw/57Hl9hb6Ve3Hjjs7KJ2jNL989QvPhz8nKDqITXmgmkUCmYt2ZFHbPZgoJthZ2uGQzYEjXY5QNFtRxERBpwqdEBMFCy4t4MjxI7Tu2Jotu7akGYR45swZPDw8Uh1XUfk7UD0AKiqfM3otxIdAvqaQ88uM9Y24K3X9ywzPWDGgd9GjB3TrBqdPw7ZtMtCvZs3U7cLD5buFhUzxA1kACORkoFs3WRnw7FmpGKgocovAVFYt1Gg0ZMmShcOHD2NtbW106RJZinJwSmkG1o8lcysPsCubdM6wUn8a9RSAPff3EKON4X7ofSafnYxZfBAKsN20IgfvnyZqTDQXAy6iF3ruPLvDpDOTuP6jzBI4+OAgdQrVwTaTLUNXDCX7/uzo2umo6lTVaDyPHz/m0aNHaZb7VVH5u1A9ACoqnzPBJ+D2ZBm4Z5nr3e0NhHqAawOoNPXDGn9IXv0HBkLt2nK1v3nzm9snJEgXv6LA1q3S2JcoIbcKAgOhbFmpF1CiRJLxF0Lg7OzM/fv3sbe3N75c1FO8lhclf84oSgdGoKQw/gYUFLRCxhs8i31mdK584DocM8GBoJsUy16cHXd24LzJGYAdd3cQHB2c1Lbl1pYceHAADw8Pch3Mxbat2xBrBdmssiW1idRE4uvny/379zP2HFVU/iLqBEBF5XMk/hkEu0K+ZlBtacb6hpwGt6/hi5VQ9I3Vud9MrVqyBDEkv7+OwXUPsmjPmTNptzO49rt1S47w37Ej+XzbtvK4paX0CgBRrVsjqlRh//79lPb0hIcPk5rrQm/wclsJHkdm53mztSxovQFlkmJktKM0UQgEWcyyYIpp0vFONmBnAm2CtFzRQNGsRfF56cNpv9OMqTWGQlkLcbTLUYKHJ19LTBSU15enZcuWzF86H2dnZ6Of9/z5c7K2y8ovvr/w448/oqLyT6JuAaiofI7EPoGXVyBvw4zt2wfug0t9oPYOyFPv/e4dECDz+h8+hOLFkxX+UnLunCzPW6CA/K4oshywoapf3rxQqZIM+Bs7FqZNk8fLlk17uyAFo83MqNesGd/Z2UGXLjB/PgwZggjYQ6xrJ9ZdceCn3z3peagnL2JfMKrmKHJmzsmYk2M4738eO0s7AKK10WSxyEJ0QjQAVW1zU6dqd/qfmYVugg7TKXJysPXW1iRvwUrPlSiKgn+EP6tareLu3bs0a9aMqXOm0vl2Z1ZFr+JUt1MA6PV6tFotvzv/zuAeH9jLoqKSDtQJgIrK50TYdQg6AuXGQPYqGevrux6uj4b6RyC7Y8bvbdh/9/dPPvZ6Xr5WK93/PXpIpb4//oAXMrfeaAIQHCxX/TodjB8PTZrIoMA3VPQDiI+PR6PRMGfTpuSSvkLwMNSbXFeGo7+9nKF/FGPhlj+xtLQkn00+rj29xgnfE1hbWDPD3bgOgpWZFcWyFmOwcoOZYTD8yTNc6zcBZmE6xZRB1QaxyGMRJXOUxDfcl/0d9tN4U2Mq5amE90tvRpUZRePGjZk9ezZdunRhwdIF5MmSLPbTpk0bJkyYwODBqvFX+ZcQQnzWL0dHR6Gi8p9Arxci/oUQQccy3vfefCH2FBQi/F7a50GIn356+zVe1RQUrq5vbtOkiWxTo4YQZ88m99m7V4j9+4VQFCGyZBGib9/kc4cOpX0trVaef/FCCCHEqlWrxNixY43bJESJncsQl383F/WqlxKhoaFJp4rMLyJKLigpcEEMOzpMXAy4KL7d9q2ovLSy6Lizo8gyCYELIibolLD51VLggrj77K5YfGmxwAWhSdSIkgtLilvBt8T++/vFKs9VQgghNBqNUIYowj6/vVi5cmWqYcfFxQm9Xi8CAgKEXq9/+zNVUXkPgCsiHfZR9QCoqHwOPL8IDxZAra1g3zj9/YSAWxPh8TZwPgfWhdNud/YslCr19mu5u8v9/zp10r6PiYmM2ge4f18W7TFQpAhUrixT+6Ki5LGSJaUeQO3aad/P1BTq10efOTP+fn707NkTnU6XfD76EZz9hkKU54fFMZxyO22ktV/IthClc5XmWewz2pVtR43VNZLONSveFNeC5nR5mkjNvUPRYUImk0wMPz6cvR32ctz3OJmmSi/DqJOjKJurLB5BHvSq2osnT54gNggcuzqyTL+MTomdyGyeOenaY8eOpUqVKnTt+h7xFSoqHxBVClhF5VMnIQzMbCEu8M0GPC2EHjyHwPPzUP8YWKYtpPNOgoKkPn9iIhw4AM2bQ926cP68jPAHGQzYtCl4eyf3q15dVu8zpPv99hv06SOr/RmoXBlu3HirxK+npyfTp09n165dyQeDT8GFTnjENqbRsL18Pa0FW3pvSTodmxhLbGIsOTPnRJmk4GTvxJWn8u/E9tr96HR+ORYKxKW4bV7rvATHBHO933WuBF3hzvM7jKg5Anub5CyDkJAQ6tatS69evfh5+M+YTjYlZmwMmc0zk5CQgEajASBz5syYmiYHGKqofEhUKWAVlf8C4bde6fObZsz46xPh4g8QdgMaur2/8b96FfLnl5+XLoWWLWVA3+XLcsWv1crvxYpJ4z9okGx7/DhcuiQL+ZQrJ48NHy4nEynx9JQTizdw8+ZNHB0d2blzpzwgBHgtggsdcWcALYcfZ+jiYRQvVtyoX8utLck1OxcddnUASDL+APlC3fj1y/5Gxh8gOCYYBYXKyysz5OgQ5v05j8DIwKTzoaGhODs707FjR0aMGIGJYoKYKJJW/xs2bGD69OnY2Nioxl/lo0D1AKiofIoIvQz4y14VdBpZzje9aOPg/PeAHmrvBLPM7+xihF4vjbvReF65+P395cq/c2dZ7W/bNinRW7q0PF6/vvQE1K4NzZpJb8Hdu7Ky35Ej8pxeLycOFhZvHcbLAQNof/s2h06exMLCQj6HKwPhxSWWvmzGgB9n43HGg0pVKmFmYpZKV3/48eHMuTgHE0wQ6PGu2YLqfx4kVJ/cplWpVuz32o+pYkpu69z8Wv9XSuYsyc/HfuZSn+TSvOHh4TRs2BBnZ2emT59udC+dTkdgYCCFChUiMTFRjlVF5W9E9QCoqHzOxPjDnanQri08e5n+fgkR4NYUzG3hq71pG39FSVbce51ffkkS2zHCx0eu6jUa6N1buv6rV5cTgxcvpPHPlEmmCC5eLGMFIiPl1kBK4w/y+pkyJccCpIG7uztZly7lxMSJ0qDGBUvhIs1LruRYyIRhaygzoAxOTk5Y/GpBu53tiNLI60VqIqm7ri577+2Vt0OPAKbeO0P0q/WQpaklAPs67ANgXJ1xPIt5RuvSraldqLaR8Y+KiqJ58+bUqFWDXyb9kmqicfnyZcaMGYOiKKrxV/moUCcAKiqfEto4eLhGuvvr7Ibdf8CTJ+nrG/8MXOtD1vJQc6NUB0yLS5ekWl9ajB6dtrjPihXQuDE8eyZL/CYkyHGlnCxoNNJL8OKFPN6xIxR+tW1hMP4gK/sBHD2a5hD0ej2LFy8myN8fGjaE0Ctw7Auwb8yd7JNo0boD036fxr0s9/AO9SZ0ZCgbWm/AdoYt/hH+xGvjOfv4LA/DH2IOPCyZjRFVe7I2LAqNAO//eROviwdAmaQQMyaGSfUnoRM6Tj46aTSWmJgYWrRoQfny5VmcfTHWM5Ilh4UQeHp6UqNGDTa/TelQReVfQp0AqKh8Sug1EO0L4lW0uxDg9E5Pn/QYnKgD+b4Gp0VvFwf64gvIkiXtc5kzJ5fqXbcORo2Sn2fPlmPJlk26/DNnllkBr/PgAWzYIPP7t26FnTuTgwANODrKa333Xaru58+fJywsjC1btlCwYEF4tBncmoHjfHytu9KkaTPmzp1Ln459GFN7DCUXlSS7VXaszK2Y3nA6hecX5rsd3+Fc1JkalpDFMhtf+EYz++qapHt4vfDCvacce7dK3bCeLo16nUJ1OP7wOBHxEfiF+xEbG0vLli1xcHBg2bJl+Az2wWugV9J1nj59yuTJk9HpdGpZX5WPEnUCoKLyKZAYCZf7g6klVPoVTDKQwRtxXxr/Ej9CpSmpVfnel6goY9GfgACp1GfwAgQHy3sZ7mcnFfaYNw9+/z05sv/evbSvnyULHDpkdMjNzQ0fHx9Z2vjaSLg5ARqe4qlZDRo1qE+bBhXp2LEjJpNNmH5+OmKivIfpZFNsLGwAOOt/lvN+JxiTXSFBE0aw1jjIsMXWFhz1Psr5HudZ3Wo1EaMjAOhTtQ+dKnRi4OGBFP2tKN988w358+dn1apVmJiYUCx7MUrmlBUHjxw5Qt68edm3b58a8Kfy0aJOAFRUPnaEALMskLcRmGQg2A/gpad0+1dwgdJD/9o4vv1W7tVv3gw5ckC/ftKQN20KY8bAiRPG7R8/lmM3ZAmYmMhJwK+/gkH9rmfPZKlgrda4f+/eSd6GGzdu4Onpyfjx46lepSScaSF/W1MPQnX5cHZ2pl3RfCzYeARFUejv1J/AoYFExEfw5SpZBfGM3xlsTeBo2fLoMaFVkCDm1RzkTDfjWgR/PvmTgYcHYmpiim0mmZbYtVJXGhRtwNImS2E73Iq+xbp161IZeI1Gw/bt24mMjPxrzzsNPvegbZV/FnUCoKLyMaONgxO1QRsNhdpmbPUecgZON4NqS6BYj78+lrg4aaSzZ4eXL6UbP08eKek7Ywb06iXPx8XJ9tleVbwLfJUqZ2oq3f2GIkAgSwLXqgXTp4PZa16N+fOlRwEIqF6dR4cOSW/GsepgUxLqHyUqwYLmzZvTpGkTnBYOTfIqLPl6CQXmFWDI0SFceiID9vbe20m0HuKzlGJCPRe0E7SYvPoT+DJOBlL6DPKhTqE6HOtyLKmkb0o0Gg3t2rUDC7hz4k4q4799+3bi4uJYt24ddgaPxwfEZLIJP+x5Q3yGikoGUZUAVVQ+VhIjZbT+l+vke0YIOiLz/GttkwWB3sWyZdKAm78hMBCMg/KEkJr+Bjp2hGrVoEyZ5Mp+YWHJ52fMkF6DHj2MAwPv3ZMeACurNG8ZEBDA2bNn6dyxI8I5J3FHv8DScR5K8V7Ex8fTunVrKlWqRGKDRNrvbs/35b+n0LxC6F7FSMxqNItjPscgPphD+U2oGWhC68u7gd2MP/0LICP+O/3RCYBLQZc453+OuRfn8nPNn43GkpCQwPfff4+1lTUJ1xMwT+NZPXjwgBo1avwtxh/g7oC7RvUEVFT+Cun2ACiKUlhRlEavPlspimLz9w1LReU/jl4r9+3jn4FtiYz1DTwAF7tB3QPpM/5CQP/+ySv1dxEQIIV+oqKS3fZ//gkFC8r9/zp1oEIFafS1Wpg6Fbp2lSp/ISGy/apVsiJgpkxvNP4gV9wx0dEwvCQ8/ZWGflHEFGqPVqulQ4cO5MqVi0WLFzGy9kgAjvoc5XDnw7h85QJAux3fkl8bTLAO2oZYodFrqZq3KgDLvl7GxK8mggJxWum1qJSnEuPqjMPzqafROBITE+nYsSMA27ZtS2X8t2/fzs2bN5kwYQKFChVK33N8D8rkKkN2q+zvbqiikg7SNQFQFKUPsAtY/upQAWDv3zUoFZX/NGE3QDGFxn9mXKEvYA9c7g11D0LOL9PXx7CtcObM29sZKFRI5vjnzp3stv/5Z2nkIyKkul+pUjJl0MwMxo2D69flRCNfPtl++nRwc3vjLSIiIpgyYQJFv2tJ37KnIOAPlKaXuTBKkNksMz179iQhIYENGzbQ/3B/Cs4rSMXcFVl3fR3lc5dn2IlhAPQo0YhRr3Yi/DQx/Fr/V24/uw2AiYkJk85O4s6AO5TNWRYTxYQVniuokrcKW9omywaPPzme7zt+j0ajYceOHVhYWKBMUqi9OrlGgZmZWZoeARWVj5n0bgEMBL4ALgEIIbwVRXlP7VAVFZU3IvQyst1pYcakfQH8d8KV/0Hdw5DTCe7cSdpDf/d9MxBcJoQ09PfuydW+Vpss8WtqKqP/Dbr8vXrJYMFq1Yyv8fDhW29hZmZGTmstJu3vg1l1aHQWzKwYcXwE51ecxyzEjDw/5qHggoKEDA8hVhvLttvbuNH/Bp5BnhS3MKN33nxMvLKWZzGZAA3tyrSje+XujD89HoC+B/oyutZoSiwsgZliRuvSrbny9Aq5rZP/tGm1WqYOncqXOb/k9JHTaPQaai6vCYB7oDsbNmzA3Nw8yTugovIpkd4JgEYIkWDIZVUUxQxQw1FVVD4kj7dDvuZQd3/G+/pthavDZFGfbJWkhn7p0u/uV6EC3L795glA9+5QooQM6CtaFMaOlSv6du1knn7WrNLIz5ol2+t0UKWKvGZionT1790LNjbpGo9Wq2XUqFGM61aB/iVWQaXlUKwPsdo4IqOD2bpsK5Gekfjf8CdYG8yTSCmCtKDpAkbUHEGXP7pQLGsRfGPDcVfCCUghJmiqmFJqUSk6VejExYCLPAp/ROlcpdELPQkigbG1x+KYzzGpvU6n47vO30Es/FnrTxptaYR7gNQHqFegHm6BblSrVo3o6Oh3P2cVlY+Q9E4AziiKMhawUhTFGRgAHPj7hqWi8h9DCIi8DzlrgHkGw2sebYLrI6HBCbArL49VrZq+vj4+0KLFm8+vXy9X9dmzS4Gg69dlbv7Jk8kxA2PHJk8ARo6Un0NCkrMBvv1WSghHRYGfH/zxxxtvZ6oIHHN4YeO9C+odhhzSc9B9b3d2btpJ1stZGbV6FHZ2dngFepEjcw7c/NyYc2EOB70PUsMSWttBHYev2epziPpF6nPa7zTFshXj0pNLNC3elMn1JlMse7Gke3bf2x0LEwsKZi2YdEyv19OrVy9CQ0JpM7kNy79djqliyppraxh+Yjienp6Msh1FmTJlUv2GmyE3qZinYvqev4rKv0i6igEpimIC9AIaAwpwDFglPoGkVLUYkMpHz63JUOh7yJqOFfvrPFwLN8dDg5OQNbUxeie1aslVehqGDCFgxAiYM0eu9ocOhQEDZJ2AmjVlVH9EROr8fYCSJaXqX8o/Ebt2SXngIUPSHMrYEYP5vtgFKpfMATU3g2VyuuC+ffvo378/Z86coUQJGRRZelFpCtgWILN5Zk54H6BSZlsux0TiZFcIj/BkgSILUwsSdAlMazAN3zBf+lfrj4liQuGshWmwoQHeod68HPUSC1Op06/X6+nbty/e3t4cPnwYa2tro3GGRIcgogUBAQFUe21rwz/Cn8LzC6P7RYfJ29QWVVT+RtJbDCi9HoBvgA1CiJV/bVgqKipJCCED8LI7gtV7pHb5rITbk6HhKbAtlf5+8fEyUC9HDqnLn1KwxiDKoyhyfHPmSPGf+Hhp9Lt2le8AoaHJ/bJkkYGBrq4ySNCw+k9Ju3ZvHtNzd5pk3UqxSj2h+jRZ3vgV586do03nNszZMIeIzBHcf36f0rlKc6XvFWISYsg7Jy+rv+hChO8mbmqs8Aj3x1wxxym/ExcDL2JhIicAo2uPxuF3B4KjgznofRCAoGFBaHSaJOPvE+rD2GFjCXoYxNGjR1MZfx8fH4YMGcLBgwfJmzdvqp9RKGuhJPVBFZWPHiHEO1/AWuAxsBH4GjBLT7+P4eXo6ChUVD5KLvcX4qnr+/V9sESIPYWEiPTOeN9mzYSAtM+BEOXKCRETI0RcnDw2eLAQ2bPLcyCEj48QDRokf3/9JYTsGxZmfO2xY4WYOVOIChWSj+n1YuH4tmLTEFshAg+mGs6NGzdE7ty5RfmfywvPJ54CF0TOmTmFEELUW1tPVJuOOHOqlwiKDBK4IGacmyGK/V5MPHr5SOCCsJ5qLRZeWigGHhoocCHFbfUiPC5cPI95bnSsQMMCwrSgqYiMjBQBEQFGY0lISBB6vV7cu3cvnQ9aReXfAbgi0mEf0+WjEkL0AIoDO4FOwENFUVb9LTMSFZXPHW2MjPYv/TPkqv3u9q/jtRDuzoRGp8GmeMb7Hz5s7Jr390/+vnQp7NsH1tayUt/27bBgAUycCJayRC4lS8q9fIBJk5Ir+u3enXwdS8tk7X8DW7fKLQND8aLEaHDvyNcOd6k34Ajk/9qo+aNHj2jevDlTZk3hts1tDvsc5niX4/j95EdYXBhnHrsRpocZV1Yz/Phwln69lNGuo3kY9pBp56fRoVwHbDPZ8r8j/2Nag2l0qdCF8Phw9ELP7nu7abSxEblm5wLkQmjo0KHYR9oTeisUy8yWFJxXkNBY6eWIiIjAycmJ+Ph4SqcnuFJF5VMgPbMEwwswB1oCfwDPM9L333qpHgCVj47LA4Tw2/5+fe/OEWKfgxDRfh9uPCDEH38IMWuW8Up+8mT53qtX8rEsWeR7ixZCODnJz5kzy+tcvCjE7NlC6HRCaDRvv2f4PXFsciHxU/uyQiTGpjodEhIiihUvJmbOnSmEECLfnHwCF8SCPxcIIYSYs6mCmLIQMfjwYJFndh5RcG5B4RfmJ0xdTAUuCJNJJqLo/KICF0TBuQXlz3RB3Ay+KZ5EPhG4IHR6nRBCrvyHDRsmHB0dRdjrXgshko49e/bsvR6viso/Den0AKTX8DcF1iG3AdYDzflEtgHUCYDKR0NMoBCal0Ikxgih12e8/50ZQuwrLkS0/4cfmxDS7e/mJt30NWokG30LC/n+zTdCfPmlSOXy79ZN9l+4UIgCBYSoXl28cYtBCCEe7xS6HTlE7K3Fwts79RZGZGSkcHR0FFYNrUS2GdmEEELcCrklZp6bKUT8CyFinghtfLjQxIaIPff2CFwQq6+uFltubhG4II77HBe4YPTSv/a8V19dnXR85MiRonLlyuLu47ti261tRu20Wq2oWrWqCAwM/EuPVkXln+RDTwC2Aa2BTOlp/zG91AmAykfDrSlC+G56z76/CnGglJxEfGi0WiEGDRJi2jT5PaVxHzxYvp8/L8SZM0KULSvEmjVyMgBC2NkJ4ecnxJMnQri+imeIjRUiMjL1fXSJQnj+LB4uyy/q1XJMZZSFECI+Pl40atRI9O3bN+n84/DHIuesnAIXxOJN5YTnmd5J7VMa+WFHhwnLKZYCF4TXcy9hMdlC4IKYfnZ6qvuExoaKPXf3iHHjxomKFSuKFy9eiJWeK43iBPz8/IROpxNxhlgIFZVPhA86AfiUX+oEQOVf5+V1+XqfVb9eL8RNFyEOlBEiNujDjuvsWSEmTBDi+vVkg29jI933S5YIUaKEEAEBQuzcKc/lyCHEqFGy76ZN8li7dkIkJgrh4iK/W1kJcexY6nst/FWIXxSRsK+OEFkQfr6+qZrodDpRsUFFQWmEVquVQ/Q7K3BBTNtaXXw1Uxr6MSfHCFwQB70OCtvptqL6iuoi7295RaIuUdhMsxEO8x3E9pvbBS6IEw9PCI02eTsiPC48yfXv4uIiypUr90bX/nfffScuXbr0Fx+yiso/T3onAG/VAVAU5bwQoraiKFEYK/8pMnxAZLBE2T+PqgOg8q/jvxsUEyj4bcb6CSFlgQP3yTz/90kVNODoCI8eyTK+BlaulBr+USnk8nLkME7vA5n7r9FIzYDNm6FAARkYmDWrPJ+QkFxFcMAA+N//jHUFnp2HM22Jf16R6stDODN1GnaviQ8JIRg8eDDXb1xn1vpZ1Cha49UJPUFRT8kX9wDHtQ24q7XEKZ8T35X9jiHHjPUEqtlXw+OpB53Ld2bz7c1Uy1eNyfUm07RE06Q2yiSFHx1/xOScCaf2n8LNzY08eYyfq5eXF7lz58bOzg4lI+WXVVQ+EtKrA/DWLAAhRO1X7zZCCNsUL5tPwfirqPyrPD0BjzZDobbvZ/yvj4YnB2Se/18x/iAj+z085OfoaHBwgObNpWzv7NnyeNmyMko/JVZWMHcurF4tBX9++AFatZJ5/yDFfSwsktsvWZJs/IWA+/PhfFtiqy7DcsAJTp50TTL+14OvJ3WbMGkCh10PE9cujtW3VuMd6k2iLpHTe7/k55UFuClysLrbNXRCR53CdZKM/9jaYwHIYZUDW0tbdn23i7lN5wLgEeRBsy3NCIkOSbqPdoIW+xv2LFm9hANHD6Qy/gA7d+7k3LlzqvFX+exJrxLgRiFE13cd+xhRPQAq/xoR9yAhHHLVyFg/IeDacAg5LeV9M+VIu110dLIhfh2NRqbihYXJlfr338OaNVKTPyBAivXMmiWle0uXhvv34eBBY1ngsmXh7l35efBgWd53/nxZ6a9NGykglCmTLA2s08l6AZUqyfaJUXCpN0T5QJ1dNG7Tj5kzZ1KlShUAHoc/psjvRdD9omPApAEsX7CcKRun8Ou1X8lmlY1M8cE804GtCYTpIeHVn6lMSiY0QmP0U80UM6zNrbEyt+Lp8KcIIXBxc2FS/Ul4vfCiVM5SuPu7U3ttbWZbz2b58uW4ubmRP39+o+t4e3sTExND5cqVM/SfS0XlYyO9HoB07aMDV1/7bgbcTU/ff/ulxgCo/OME7BPi2pj366vXC+ExWIgj1WTGwJuIi5N77uHhb24zfnxy3AEI4e+f3LdRI2EU7Gd4nTghxN69Mp3PcGzTpuS+DRvKLIHXyZdPiE6d5OfwuzJm4c9eIir8uUhMTBSRaQQF+of7C75H2NvbC/6H6LanmxBCiNiEWKH3GCTCHm4XOWbmEL4vfcWlwEtGAX+tt7YW089NF7ln50461mNvD4ELQqvTprpXtRXVRPmu5YWDg4Pw90/OolhxZYXoua+nEEKIffv2iXXr1r35eaqofCKQzhiAt0oBK4oyBjAUATLohSpAArDi/ecnKiqfIUKALg7y1Ae7Cu/RXw9XBsHLa3Llb5H1zW0tLeXe/Zs8AABTphh/37dPVvZr2FCK8eTMCdu2QZEiUtjHxka6/J2dZfnePn1g2jTpaXB0BF9fWQQLAgaCAAAgAElEQVTIwKJF0Lu3HMsTWZUP/53gMQAqz4BivZg2dixFixalT58+qYbnc80H25O2HDxxkDzF85DVMiv95ikci4XHWuhbNYHQuFBabW3F7ee3k/rpf9HzMOwhWSyyEBobym8Xf8Pnfz7ks8mHq68r7gHufFX4K6N7WV+xJvBMIBfPXqRgweSiPxamFkSFRLFt2zY6dOjw5mepovI5kp5ZAjA9Pe0+xpfqAVD5x3hyWAj3ru/XV68T4s/eQhyvJURCxIcdlxByJT9unHy/dEmIYsXkqh2EqFdPCGdnIQpKwRzx8qUQUVHyc6VKxh6CBw+Mr3n7tvysSxDiylAh9hYVItRTaLVaERoaKjQaTVJEf0quXbsmcuXKJVwNqYOvPBXuZwaIoTu/FaNPjE6Vy38j6Iaw/81edP2jq8AFMfH0xKT0PwP9D/Y3EvkRQohZs2aJYsWKGa38U3L//n2xevXq93ywKiofH3zoNEAgG/AF8JXhld6+/+ZLnQCo/O3otEJE+kgjlpBG/vu70OuF+LOPECe+EiIh6sOPz8CWLfKffIMGQixdamzYixaV7+7uQrRtK9snJspjXbtK/f9Fi5LrA6QkNkiI43WEON1ciPhQIYQQ+/fvF717907dVghx5fYVkS9fPrFz587kg2e+FaGBJ4UQQkRrolMZ/9df/fb3S3VdvV4vbgbfNBL+mT59uihevLgICAhI1T4wMFCMGzcuTT0CFZVPmfROANJVC0BRlN7AWWQZ4Emv3l0+tDdCReWT5OUVuOUiK+iZ22SsrxDg+RNE3Ia6h8D8LS799F5v6lRZvW/ECJmW9/338vjLl9CsGYweLV35KbcPihWT73fvSk1/RQEzM1k3YONGeX7gwOR6AAaenYOj1SBvI6h7AP7P3nnH53T9cfz9ZEiCJITESKyatRWl1GitWm0VNTusqp8aNapaJVSU0qrau6pUa5WgtfcWxIoZEkmIRPZ6kjz3+/vjyJNEEh5EaXvfr9d9Pfeee+45517jrO/387VzITg4mPbt2zNnzhwAxu0eh2G8sqgPDQ2lTqM6dOzfkS22W+j9SyMQYX/hDhRa1BxNNPJ/k/kb2BjUTuWBXgfY+d5OAFzzuWZ59Wpzq1F9XnWSxyRjMBjw8vJi6dKl7NmzBw8Pjyz5nZ2dqVatmm7tr/PfxZJRAnAWsAdO37uuBPxmybPP+tBXAHSeGqlJIsF/qfPHFfk5NUrkz9oixgcY8z1qmaBm7DNmiIwdK2ZZXhCpXTvzzL9nT2W8Z2+fnhYUJJLD7N2MKVXknJfI2iIiwX+akwMCAqRhw4ZiMqUvwd9NuCuHbx6W6OhoqVWrlowbN05ERDZf2iRBG2rI0N/bSIUfK8i84/NERCQmKUYWnVgk0w5Ok9d+ek3yTswreCIbLm6QvF55xXaCbbZNCo8Pl1uxt0REZMKECVKxYkUJCckqnhQVFSXvvvuurvCn86+F3FwBAJJEJAnAYDDYichF4BECkOvo/AtJvKX89EXUjPlROTcRgjfDa1sfbPCXHZqWfbrBoNpTuDAMGQL166tof5cuQatW0KED/PyzyvPZZ/DLL7BypTIMBGUc+OqrytXv0qWs5YtAAQP81RRC/oI3TkBxJbTj7+9PyZIl2bt3L1ZW6r+WU7dO4WDjgK1mi3NNZ87ZnmNPqV2sXlOP8s7FcW9/ina1h5GipTDnxBxSTal47fei76a+jNg+guCYYBJSE2hVthUejh4UyVeE8oXKs/DkwixNK5S3EEXzF2X8+PGsXLmShWsXUrRo0fuaLzg5OdG/f3/s71/N0NH5r2HJKAFYDxRALfvvAzYAWyx59lkf+gqATq6TkiDiN10Z7j0uF6aKbKwgknD70Z/duVPN1E051F+lSvps3sdH/VpbZ57537wpUqmSyIcfquvERJFdu5Tm/6lTKi07l7jgv0R+yi9y8kul7X+PlJQUadCggYSGhkqcMU5OhpwUEVER/A79KG+/87ZUbVJVfINPy8lgHxk1y17WnVosFX6sIHgiTZY2ETyR5suaZ9Lj776mu3nf32Gig4THhwueSK15tURE7ftvv7bdfP7VV19J5cqV5fbt24IncizomIiIxCfHy0DvgdKsWTMJDg5+9G+uo/MPgtxwA8wwSEiTMfM0GAy7AWfgr9wejOjo/DPQwJSk3PYMli6iZeDyHHW02Pd4Cn9Nm8Ibb4C1terOM7J2rZL8dXKC27eVUM+XXyq7ABcXJe4TEqJWEC5eVEeRImpv/7XX1ApC7dpZy9VSwHcM3FgBb3hDkabmW1fOn6eUgwMHDhzAYDDw3aHvGLF9BDJO0MZqtHuvHVcCrnDjjSu4Hn6LKhcCmNthFe+s7Urd4nUB2NB1A98f/p7IpEgCogMwjDfwQY0PWHluJS+7v8zd+LtULFyRQnmVKNK4JuMAuBF1gxbLW4DAwLiB7N26l927d+Pm5oaMS3+HW9G3mO0zm/M/nqdYsWKP/s11dP6NWDJKAFyyOWwtefZZH/oKgE6ukZoocvTjJ3PTu7pEZH0JkdiswXCyACoCX3YEBIhs2aLOGzYUGT063Wq/SBH1O39+5lk/pNsI1KihVhCMRvV744ZKX7Qo3bUvjVh/kb/qKSv/xKyBc/pVrSp70+wM7mPq1KmCGzJ/8/9EROTyjT8FTyQqMUrwRIpNKyYGT4NUmV1FrMZbiYhISEyI9FzbU5otayYT9kyQNefXCJ7IoC2D5EDAAfnxyI/mvX4RNfN/s8+bUqxcMfEPyv67tmvXTg/so/OfgdxcAQBOAiWASJQQUAHglsFguAP0ExGfXB6X6Og8f1jZQdFmkKDBse1KMOdRuPErnBkDzXbDlCVKmjdNQCc71q5Vs3GDARYtgj590u+VLAmnT6fbHpQvr6z2CxSAAQPA0xPeew9SUsDPT/0uWADe3srSv1QpsLJK1/EPDFS/X32lVgjSCFyjhH0qfw6VhqoVD4MBVq/mVsOGiAjzz5zBYDCgiYamadhYq/9WVq1axYwZM3B+H6qHLwPTd5Qv9QYyTgiJCSGPVR5ikmIQhPNh5zFgMHsLlHIuRUB0ALuu70IQRrwygjUX1lDepTyD6g0yN09EGDVqFAEnArjV4RbhhFOGMub7sbGx5M2blyVLllC4cOFH+/PS0fm3Y8koAZgHtMpw3RL4HqgPHLWkjGd16CsAOk+MponsfUsk9rq6XrxYJIcZb44ErlMW85Fn1bWvr8iCBZY9++efYhbwyUiDBmq2f+eOup+Skr7X/+GH6e10chJJTs7sAZDG0KEqzK+IyNmzIkuWiNjYiJw4pFY7NrwgEn4sc70zZ4qEhMjixYtl5syZ5uSi04oKnsgnmz+Rld4rpVwpRwnd1sfsIaFpmtyMVv74eb3yZvHtb7yksbz+0+uZ0n44/IOIiFoB2DwoUzM0TZPhw4dLrVq1JDw8PNtPN3jwYFm5cqVl31lH518CuSkElF1haWnccw18Xg99AKDzRKQZukWcejxXPxFlOLfGVeTuicdvx7FjqoMXEUlNFbG1Vf989+9XadevK0O+VatE5s1L7+hbtEjv8NPSAgLSy71wQT2Tkd6tRNZVEDnQNdvtjsTERDl+/Lj5en/Afvl8++cSkxQj+67vk2OnjolzITvJ8wEi/j+bv9vgLYPNHXusMVbye+U3XztNchI8kaWnlsrAzQPlvbVK7e/UrVMiIjLsr2ESkZAeG0HTNBk6dKjUrl1b7t5V4kNh8WEy5M8hIiISExMjd+/elcTERF3oR+c/h6UDAEstmCIMBsMog8FQ6t7xGRBpMBisgRz8kXR0/gUc6AThR6Fgzcdz9Qs7BId7QuP14FLbsmeqVoWAgMxpdeuqJX5Q0fvSlvYbNYJx45Se/4oV0LUrLF2qlvcdHGD7dvVMfLyKHXD2rDIGTOPFF6FLF3UuAteWQBsfqP4ZNFgJtlmjfl+4cIFly5aZr6/cvcKGSxtwtHOk8czGfPFRG1Z/acS2fD4MP7/PxkvejNk1hg0XN9ChYgdGNRyF4zeOxKXEkcegtiBikmMY9PIglpxawqw2s7h89zKFHApRzU3FVPiu1XcUdCh4r5lCuTbl+HPnn2zfvh2Xe+9z5e4VZhydAcCKFSuYP38+9vb2utCPjk5OWDJKAAoDM4FT946ZgCuQByhnSRnP6tBXAHQeC2OkErtJDH38mX+Er8hat0xCORZRpoyamWdH4cJKu3/MGHUdEKDc9tLw81OzfEdHdaTN+q9fTz+vUiVrucnRIge6iWyqKhJ1PtuqNU2TrVu3ZnvPL8xPCo5BerYuLV5eXqIlRQieiPt37mI/0V7ar2gveSfmlf0B+82zfhGRiIQIWe67PFMEvwMBB2Tzpc2CJxIaFypJKUny5U4l2atpmgwcOFBwRxhFlnbExcXJ2bNnzXl1dP6LkJsrACISLiKDgEYiUktEBolImIgki8jVpzIy0dF5lpweDcEbwN7t8Wb+MVdgT2uo/aNZKOeBhIVBcrI637ZNzfLvR9OUO9+8eSrS3549aoZfqxYYjWrVoFIlqFJFzfZjYyEhAVJT1QrBtWvq/Nw52L07/b3unoA/X1Kz/VbHwLlytk2Miopi+fLlGI3GLPduRtyk/D4rOjd0YfTo0QzfrSIR/vT2T6SaUvG+4k1CagKNljaiVpFafPnqlxjGG6i/qD6X715GE43qc6tz7s45Xl36Km1/bYuME9zyuRGeEI7Xfi92XtuJ1ctW+Pj4EHU+CpksWdrh4+PDTz/9hMFg0Gf+OjoPwdJYAA0MBsMF4MK96xoGg2HOU22Zjs6zIPE2JIVD7Rng0eHh+bMjIQh2t4RqnlCqi2XPuLkp3X5QFv316qnzDh1g61Z1vncv9O+vzk0m5bf/1Vdqa6BOHdXJb9qkOvi0+b6Dg7p/+jS88EK6dsCJEzBhPFycDnvaQM1v4OV5YOOQbfM2b96Mg4MDy5cvx87OLtM9CdqE/5KPOR1mQ5tRR9kfuJ/pR6fTqGQj3B3dSZVU6rnXo1XZVgCUcynHgZsH6Fy5M8GxwQREBXA06Chn75zlYvhFZJyYffgLTilI59WdQYOVk1dSMbUiW7duxdk5s3JiYmIimzZtonHjxkybNs2yb66j8x/HUhuA6UAr4C6AiPiiIgLq6Py7CPgVgtaDdZ7Hm/knhcOullB+AJTrl30eERVgRyRz2qJF6vzoUSXRC5CYmL4yUL++6rgrVYLNm1XasGHQubPq9AHat4eoKLW3P29e+jv4ZPDU3bULJnwGrxyCgFXQ6iiU7JzjK4kIW7duJSwsDICAqHv2CaYkSIlh2pLd7DyVl4jjEdjY2LDk1BIA9gfup/IctZpwNPgoW69tpWaRmqz2W83egL2svrCa+JR4vmryFY1+akT/2v3pVLlTprrdHd2Z2nwqbIKLfhc5vu84Tk5Z7RLu3LnDrl270rYsdXR0LMGSfQLuufoBpzKk+Vry7LM+dBsAHYuIv6ms9J9k3zg5WuTPOiKnPheJjxdxds4+fG5iopqfR2ewsNc0kfHjlYV/RoxGtWef9swPyi1OQkJEmjRJ39dv0kSkYkV1Hh6u3AM9PdXxyy8ioaHpZQ5qLjLXRuTkZyKm5Ae+0p49e+TGjRuZ0vBEjgcfFzn/rfz2Qz2hIMII5NO/PjXv77dZ0SbHUL5V51SVIVuGiM14G+nyexfBEzGmGEVE5LtD32WSAjaZTNKrVy+pVa+WxMRkDbWclJQkM2bMkNT7v5uOzn8YctkL4KbBYGgAiMFgyGMwGEYAfk9jQKKj80yIOgfhRx5v1g+Qmgh73wKXOlBjkhLYSUlJF9rJiL296rYzzmRTUpQ1f5s2EB4Ogwer/XorKzh/Xgn4HD6swvLeuaOW+2fNUs8WLqy2B9KC94wfr7YR4uNVmZ07qy0GzQRnPKHpOXjTG2pNASvbB76Wn58fQUFBmdKk35/UyWvPxmtl6fLlUegB5IfpR6aTzzYfnk08Wf72ctqWbwvAO5XeYcU7K8zPv1v5XWYcm0EDjwYMe2UYAHZedmii8W6Vd/mlg1r9MJlM9O7dG39/f/bt2IejY9ZQyyaTidjYWLQMwZFStdQHvpOOjo7CIBYsmRkMhsLADKA5SglwGzBERO4+3eY9OXXq1JETJ04862boPK/EXYewg1Cm5+OXoaXC/o5gkxde+QWsrB+/LINBdfhphnyOjkpxMDISmjSB6dPV3v+ePbBmjbIR6NEDrl5VWwci0Lw57Nypzu/cUVr/0dfh2AdgsIEGv4DDg/XwL126RGBgIC0yqh3KvaiHAb9z8WYCjTqMpMLAChwyHGJN5zVMOzSNa5HXqFm0Jtv9t2cqr6prVXpU68HoXaMBqFGkBr6hvsg4YeXZlTQp1QR3J3dzfpPJRK9evQgKCsLb25t8+fJlKm+j30be6vcW4RvCKVSokDm9/6b+LPBZQLH8xSiUtxBnB5x9zD8IHZ1/LgaDwUdE6jwsn6XBgMJR43wdnX8XooGW/ATPC5wYBJoRXlnzZJ1/WnkAoaGwf7/a6z9zBkaPhsaNlSeAv78yAnR1VVLBK1ZA3rzpz+7YkV6emxuc+xl21IcKg5SkrwVtjIiI4Pbt25kTj38MJd9ly5389Hl3CP09+3PV7Srrqq7j7UpvU9WtKh95f8R2/+04WDuw8M2FzDsxjwM3D3A+7Dyjd43mWN9jONg6UDR/UVynumIYb0DGCctOL6NxqcaUKViG1NRUPvjgA0JDQ9m0aRN58+bN0r7qRavToXEH8ufPnyl9gc8Cvnz1S3q/1Bvbh6xu6Oj813ngCoDBYBj7gGdFRL7O/SblLvoKgE62xF2Hy7Oh1tTHX/YH8Pserv8ELQ5kK5qTIyaT6rwPHABbWxXhLzUVjh9X92fMgKFD0zt1NzflKliwICQlKePAmjWVdT/AiBEwdao6F4ENG6BtCzg9CoK9ocEKcHv1oc2KjIzkt99+o3///mY3utvBuyharAkk3CQiKS+FKhWhRvsa+Jb2Ja9tXvLa5iU8IZxzA85RdW5Vc1nOds68X+N9Nl/ZzMe1P2Zkw5GZ6krT/b8z4g5u09yY+cZMtlzaQp71eUg2JrN27VocHLJ6JXz88ccMHjyYypWzuiueu3OO0gVKkz9P/iz3dHT+K1i6AvAwG4D4bA6APsCoJ2qhjs6zxL6ICmn7JJ3/zT/g4nfQZNOjdf6g9vZ9fVVnbW8PcXFQvXr6/cGDVYeetrfdrZvq/CMjVecPqvOvUUOde3ikP5uQAMM7wJZakBIFbXwt6vwBjEYjCQkJ5uugmCB2b2qGFnWWJJuivPn2O4zoNYLTS08T83kM0Z9HE54Qzo73dtD6l9YUz1/c/GxB+4LULV6XNZ3X8NmOz7gVewunb5yYuG8iADJO2NJ9C27T3Nj+3naGbBrCn1//CcD69euzdP5pk5UPPviAsmXLZtv+qm5V9c5fR8dSLLEUvPcPzxEYA1wHpgBulj77LA/dC0AnEwm3RXa1Stf4vx+TybJywo+LrCmcvb5/VJQKxGMJiYkqcM/UqSJt2qi0iAiRixfTLfw7dFC/5cqJLF2arvbn6ytiMEim4D6mZJH+hUV+cxG58ZtlbRCRlJQUmTRpksTHx6sEzSRyapRIktLZN5lM0qlTJ+nSpYuYMnyjY0HHBE8kJinGbOVfb0G9TFb/Rb4tIngihwMPi/V4a9l7I3OI474b+srha4clf8X80r17d0lJyf7PZsCAAbIlLQSyjo5OjpBbXgAGg8HFYDBMBM6gbAZeEpFRInLn6Q1LdHSeAlqqUvarORmssjF/6dFDCeU8jPgA2PcW1FuUvb7/4cMqdO/Nm2o2/iBiYuCnn9QMfssWlebikq4EWLUqrF+vzq2sIH9+dU9ErRiIwPXr98q6BNsaQslkeOFXKPXuw9/lHiKCvb09NjY2YDKCwQpj/goM2/45ANYNrfEP8mfZsmVYWVnx2fbPWHNhDS8vehmA+T7zAVjy5hKOhhw1l/tG2TcITQilvnt9XlnyCqljU2lcKrOEyNTGUxnWcxhdG3Xl559/Vm3IgNFoxGQyMXr0aJo1a2bxO+no6DyEB40OgKnANdRyf35LRhTP26GvAOiIiEhKgsjm6tlGtzMTEyMSFPTgcoxRSi/fb3p6Wlxc9nlB5KOPsr+XnCzSvbuK8OfvL+YQvqDC8qZr+aXP8O/3dU+biWuayKVZImsKqd9H1DL47rvv5Nq1a/fqSFLvZ4yUhScWCp5I9xHdBVfEYYyDiIgERAWYZ/dvLH9Dqs6uKngiKakpYvA0CJ5Ingl5xO+On6SaUmXg5oESGhsqLy98Wc6GqnDIC30WyqAtg4SRyEsvvSSDBg3KtLKQkXHjxsmsWbMe6Z10dP7LkEsrAMOB4qil/xCDwRBz74g1GAwxT3NgoqOTaxjvKonb17c/eK/e0RHc3XO+r6XAgc7g1gQqDlFpvr5qVg6qq47J8M9C02D+/KzlhIUp5b6VK1WeNFnbjz5SvytWwKpV6fmnTYMhQ9KjAS5dqrT/ra1htpeKOeC/DFochAoDH9muoVixYjg55uP86WkU/s6dm/VWEpAQTb9N/ZhcdDLeP3lDD3B1cQUgxZTCS8VeAmBjt42cCzvH2QFnab2yNSf7nwQgWUvmxTkvYm1lzcgGI4lMiuRs6FlijbEA7PTfyd07d3lh4wu0bNmSGTNmYGWV+b+jpKQkwsPDGTVqFB+lfRsdHZ1c44FugCJiqVCQjs7ziWiwuzU0WgP5Sj5BOQInPlF+9LV/SO9kq1dP7/S/+AImT1Z569VTg4OkpKxlubkpy3+At95S+v2g/PjTfP/t7eHVV6FMGRg+XNW3erXK17s3BAbC0R/h9Kdw+23o4q1EfUwmtVVgwSBg1apVODk50bVrV4Zt6sOIPDeJS4rgljGRCvlKQCB4TvfE1MPEwOYDmdVWCQ9NPTSVk7dOkvpVKgHRShY4VUtl9/XdlHAqwehXR5PPNh8tyrYgICqA0jNKU7tobRJTE2mwpAEyTvi23rc0b96cIvWLMMV+Ct8YvsnUtjG7xpByMgXrCGsmTZqE721fas6vaY4RoKOj8+RYJAT0T0Z3A/wPE+0HjuXVIMA6G0W+R8FvGlxffs/dL6siHaBm8yaT6txv31bW+sWLq069cOF0ZcA9e5TW/61bys//jz+U33///ukrAklJamDxxx9qYJAvn7pfogT06gzNQ8ApHGZrsPVqurugwQAtW6YHEHoAx48fx9kmmvKJy7Ha/jN3RtzBNZ+a5fv7+9OwYUNmzJ1BF98u2FnZ0aJsC1wcXAiMDqRo/qKsOr+KCU0mMHZvZm/hdyu/S1HHosx4YwYmzcT6i+vpVLkT0UnRLPBZQMdiHanVoBYjPh3BubLn+P3878g4wTDewLG+x6hSsAp1p9RlULtB9HupH9bW1kQmRvLDkR8Y/9r4J/lT1NH5T2CpG+Az36N/2oduA/Af5mAPkbsnn7ycgDUi6z1UvIBHpWtXyWSlP2+e2qNP29tfvVr9Fiwo8vrrItu2qXxDhohMmSIyeLDIW2+lPx+0SWQmIqtai9ghcuhQ5vrCwnK2SbjH8ePHxctrokjiHRFTqsjt3ZnuR0ZGSsVKFaX5J80lMCpQmi1rZt7zd5zkKHgidxPuysDNAwVPJDg6WGrNqyVvrnxT8ERC40Kzr1hE/Pz8xMPDQ2iLHAw8KMmpyXIyRP0Zjd4xWkLjQuXAgQMyZMiQh35aHR2d7MFCGwB9BUDn30fYQTXzt3d78rLuHoc9beG1v8DlpQfnXbFCCfgcO5b13pgxSqt/zRol+JPR0r1IEbUCAFCyJAQEqJm8iwu8/76S/02OhpOfwoW1UGcBVHtXrQiMHq22CR6B8PBwbpxcS508G6HpZnP6Or91pKak0qVDF3AFWkMp51LmZf4eVXuw4twKCjsU5odWPzDr+CwO9z0MpIv6ABzpc4S67nWxMliRqqVic8/j4syZM7zxxhtMnjyZqIpRdKrcieKO6boB8fHxbNu2jQ4dHjMMs46ODpB7QkA6Ov88wg5A7JUH5+neXQXeeRBJYUrj/+UFD+/8QS3316qVfm0wKDsAgNmzVecP0LAhdOyoznv1UqGBb9+GypUhTfxGBO7eVZ3/rW2wpRpY2cH/YiCyqCp7wYJH6vxDQ0MZOaAjBRP2U6dlf2j8R6b7K86sYOTQkRTIX4C6vesCcG3wNe4MVx6/f1xS+U1iYvTO0RwJPkLaBELGCaaxJvwG+lF/cX18QlT4YduvbTGMN3D4yGGzsd/777/PkL+GcDDwoLnuyQcm03BWQ44dO8a/fVKio/O8oA8AdP49hGxVEf0qjwLXhg/O26MHfPhhzve1VDjYFcq8ByXetqz+116DefNg7Fhlpf/++5AWqCYyUu3v9+unfP5//12lL12qrPx37oSLF9XAJM2ALzES+hhgdw+otxh+MkDIXRUUKAM7/XdmmoHnROFChejwZmusjapDf/O3jpwJPWO+/8rNV4i7HkdU2yhmt52NjBNijDFcjbzK+9Xfp1DeQhSwL0BkUiQ3Y28C8LPvzxwNOkr5meWxnmDNi7Nf5FjfY9R1VwOI0OGhDCs+jLfefIuFCxfSuXNnQA0YOldR57GxsVz94yrv1H2Hb775xixBrKOj85SxZJ/gn3zoNgD/IYK3iNw5mDtlnfpcZGdzkfNnRXbtsvy5tP39jHoC48aJ9OmTOU8aXl7p9gC2tiJFi6rzyohMR6QfIsvmqrwgcuqUOl+3TqR3bxERiTPGyYaLG3JskslkkrmfN5aofYNERORG5A3BEyk3o5zs9N8pIiJTFk4RK2crCQwMlOWnl0tCcoJomiYT904UPJUNQ6EphcRhooP8ceEP8fjeQ1776TXpubanLPRRegGBUYESnZRZZ2H79u1SuHBh2bZtm3y4/kPp/UfvLO1LSEiQH3/8MUcdAB0dnUcDC20AnnkH/bQPfQDwHyB0r8iV+aUp6JwAACAASURBVLlXXuA6kfUlRRLDRPr3F7G3f/yyjMb0Dv7MGSUABCKTJqXnSUwU6dxZpdsh8nMzZeg3qJFItWrZl7tiRbp08AP46ch3khDjL/t2bJSU2GCZdnCaJCQnyA+Hf1BVpyTKiRMnpIBLASk5oqRomianbqlBxssLXjYb/+32320+b7K0ieCJrPdbL9uubjMPEO7H29tbXF1dZd++fSIisshnkSw5ucR8PykpSXr16iWRkZEiIjJp3yRxm+r20HfS0dF5MM/1AADoDJwHNKDOffdGA1eBS0CrDOm1gbP37v3IPRfGhx36AOA/QKy/GgTkBtGXRNa4ioQdtSy/pj1Yec9kUlr+GVcR0gYEJpPIvn0ir7yiroO2iPxWXGRfNxFjhPIISEp6otf5dDCyc0VXERFJMaUInsiRm0dE0zRZemqp8Cni7u4uXvO9Mun3nww5KVGJUTJp3yTBE+mwqoP5nu0EW3P580/MFzyRt1e9nane33//Xdzc3OTo0ey/o6ZpommaeHt7i3bv+525fUZmHp35RO+ro6Pz/A8AXgQqAnsyDgCAyoAvYAeUQckQW9+7dwx4BTAAfwKtLalLHwD8i4k6L3L8k9wrLzlWZFOVR1tNKFdOpECBzGlGo8hnn6V39M7OIoMGicyeLbJzZ3oAn8hIkR07RNq8IrKvk8iGF9Q2Rhog4ukpEv0A+eKcuLJAJOywnPH1lTt37mS6hSey/PRyiYqOEoogjfo0koTkBLkZfVMMngaznO/1yOuSkJwgL856UVy/dZWyM8qaBwGZqrp7RcLjw83Xy5Ytk2LFiomvr2+2TdM0Tdq1a5cuP/wvZdXZVbLL/xG2j3R0connegBgrjzrAGA0MDrD9dZ7nX4x4GKG9G7AfEvq0AcA/2JSEkRC9+deeUf6ihx6/9G09ENDRUJC1HnaEn+tWuqfVvHiIvnzK1/9mTNF7OxEChUSKVxY3U8xiizuJPK7i4jvV+p97gdEVq2yvD3JMSKaJic2fys/TBysivBE1l1YJzv9d8qo7aNkwp4JwlikRZsW0qFbB7l295p8sP4Dc+f+yaZPzOc159WUrVe2Cp7Ia0tfk61Xt0pkYqS5uqjEqEzVz5s3Tzw8PMTPzy/b5hmNRhEROXfunHnmLyJS/NvigicSnxxv+bs+51SfW10GbRn0rJuh8x/E0gHA8+YF4A7czHAddC/N/d75/ek6/0WSwmFXKxXRz8I494BS6TMYlHvd/QRvgts7oM7MR9PSNxggJESp/FWvrmR769dXVv0dOyrd/5MnYdAg+OQTVXeVKjD8TfCuAVfXwKWuUH2CildwPyLQpYvl7TnQBSJOULZBP15r3weAb5p9Q6XClWj2czPm+8xn7J6xtLvZju3ntxPRLIKyM8uyzHcZprEm+r7Ul7NhZ3m74tvMaDWDgMgAWpZrSZNSTZjTdg4ty7akgH0BAG5E3aDAlAJpg3KmT5/O5MmT2bNnD5XSohneR9euXTl48CBVqlTJZO0fkhACwCdbPrH8XZ9zfD/25cfWPz7rZujo5Iwlo4THOYAdwLlsjrcy5NlD5hWA2UDPDNeLgY5AXWBHhvRGgPcD6v4IOAGcKFmy5NMYYOk8K7R7luIRpx/v+fbt1RJ9RhLviKwr9nh2BCNGpC/1x8er31u3RCIi1Pnt2yKOjsqQEESG9BE50kfVd32lyKKFkkkp8IcflM3Axo2Wt0EziVyeK5KaJMGBV6VTp06Sel/kwKjEKPOs/ttZ30rJMiWl7cK2gifS8ueWUnRqUcET+WLHFzJx70QRkUzL/Xgi/b37Z6k6OTVZNE2TsWPHSvny5SUwMDDbJkZEREhKSoqEh4dnmvlnJDAqUBwnOVr+3jo6OtnCs14BEJHmIlI1m2PDAx4LAkpkuPYAQu6le2STnlPdC0SkjojUcXV1fZLX0Hme0FJVvPvE21CwxuOVsXGj0uNPQwSOfwyle4Bb45yfy4mpU+HIEXU+YgTUqaP8+V1cVNmOjmBnp7T9W9lDtV/A2gHa+oF7J/A5CZcvp5c3dKgK9JOcrGIIFCiglANzQjTAoESLUuMo6l6GTz/9FGtr60zZqs2thoONAwTAN+O+4a/Nf3E9+Tp1itVhm/829vfaD8CkA5OYeWwm3x36jh7VeqCN1UjVVP1brmwxz/bTsDZYM2jQIDZu3MiBAwcoUaJEpvu7r++myU9NGD9+PGvWrKFQoUI5+vlbGawo61LWgo+uo6OTK1gySnhaB1lXAKqQ2QjQn3QjwONAfdKNANtYUoduA/AvIfWeNXxcQO6W6/+zyKaqIqmJj/bcqVMiu3crvf6LF0U++EDN5OfOVTYEKSkq39ChIh6IfIXI14iURrnvubmJREXdswW4l3fkSFVeGomJavUgJ5uE5GiRLbVEUhLEZDJJp06dcpyBi4is3LdSyI/UGF4jU3qNuTUk1hgre67vEd9bvpm8AfYHKBsL+4n2gieZZu/JycnSrVs3ady4sURFZbYFSGPtsbXSdFZTSU5OznHmr6Ojk7vwrFcAHoTBYOhgMBiCUAZ+mw0Gw1YAETkP/A5cAP4CBoqI6d5jA4BFKDfAa6hBgM5/hQOdlcrfk4T0vZ+kO3ByGDRYDtb2j/bst98qNcFRo6BSJVi2TMn53rqlwvHa2EBKHLxvC18ZwLYJrK4KMS5K3vePP1TUP5H0uACaBhln7vb2KiLg/TNmUzKE7gFbJ2iyEWwcCIwJ5NUur+Lunr1pTExMDN07dsftDTd8HX1Zc2GN+d6YxmOovaA2lQpXosb8GmhjNea0mYO7ozuzj82m2c/NMKYaVcS+e21JSEjg7bffJjY2lr/++gtnZ+ds673jc4eO0hFbW1td4U9H5zlDDwak83yTEquWzFPjwNb50Qz0HsaxAarjrz3d8meCglRIXpNJdfRFiijDvthYtVQfFQWzZkKrwhAzG1wawLhLULgsfP+9kgguV+7J2h1/E86OU/LABgNjx47lisMVViWvQsapkX3GztZkMtG+fXsKFi3IypIr0cZp5vsiwo5rO1h/aT1Tmk+h1S+tONTnEAUmFyDaGM35/52noH1BYowxVCxcEQDD5waKehflxXIvcuClAySPS87SxNu3bxMQEEC9evWe7F11dHQeGUuDAdk8LIOOzjPlvBc4VoSyvXK33KjzcHMttLto+TPr1inL/m3bVOd/5446KlSAvHlVnp6toPh2OGsNpcdDky/UzB6efPASfgRu/Ap1ZkD9Jebknj174ubmxq8FfuVM6BlqzKuBjEsf2I8YMQJjspGmHzeleFRxQuNDSTGlUMK5BNYTrBGEpqWa4mjnyKE+h7h69yrRxmhGNRxFOZdy5LHOQzHHYoDq2F/Y8AJNmzZlmOcwFp1alG1TL168iI+Pjz4A0NF5jtFXAHSeT1ITITUWbAsodz9DLu9W7W4DxVpCpaHZ34+OVgZ4yclga6vSrlxRkfsmTFBL9f/7nwr8c/s2xIXBivegWghsATYDFy5BxYpq1m9nB82bqwh+trYqIJClpCZAciTkKQCxV80GkJs3b+bw4cMM+3IYqVoqbvnc0ETjYvhFKrtWBmDZsmV4eXmxaOMimvyWOYjQV42/IjwhnLsJd1nrt5ZSBUpxbfA1c2ChUQ1HMbn5ZHP+jUc2MqznMN5//32++uqrbJf0Q0JC2L59Ox988IHl76ejo5OrWLoC8EyNAP+OQzcC/IdyfYXIqVFPp+xbO0Q2lBNJNeacJyVFpGnTzGkmkzLaO3dOZNMmkWvXRHp2FmmHyBxEppQSaV9f5Rs8WCQmRhkBiqjgQJGRSjUQHiw2lBZQKDRUXV9bKnL26yzZYmJi5OLFi1L+x/LiMNEhy/0TJ06Iq6urnD9/3px2MuRkJiO/5NRkqTG3huCJVPixgoiIjNw2UpwmOcm1iHSlvrNnzwqOSL8x/STVlCqBUdkbG964cUNmzZqV87vp6Og8dfgnKAH+HYc+APiHYUpREr8i6T7/uc2+jkoq92E4OSn53jRAZNgw1UH7XxJ5A5EFtiIbm6e3OS1f27bpGgEZSUrKXGZO1KolcmGhSMi2LIOFmzdvSrt27czR865FXJPGSxvL+TuqDbv8dwkjkVKlSsmaNWvMz6WaUsV2gq3gifRa30s0TZO1F9bmGMwnjYMHD4qbm5v88ssvIiLy45EfszwTEhIiw4YN0y39dXSeAywdADxvSoA6/3Wiz8P5b9R5bi/7A6TEwO3tULLTw/O+/jq8/HL69aVL4DkGWlnB5orwVgX4OgV+KwLOlVXeXr3gxg2oXRu8vJSVf0bs7NTWwejRcPx4Dm2MBZ8TULgy5C2RxXbA3d2diRMnYmWlvk9gdCA+IT5UmVMFgGqu1ai0pxIhpUOIKhNFjDEGgN8v/E6KlgJAmYJlGLp1KDOOzAAgLjnOXL5JM5nPN2/ezFtvvcWyZcvo0aMHAIPqDcpkYwBQsGBBGjRooFv66+j8g9AHADrPByJwZ5/a326wPHfLDsmgGXVzPRR5DfIUfPhzf/yhOvX4eOjWGVb2hV+KQKsiUP0n+NEaSjeCuXNV/mHDoHdvOH9e2Qm4uORc9sqVSjAoO472U25+rg3AOV1SV9M02rRpQ3BwMDVqpAshvbf+PZJSk8yd8pTxUyhRsATdBnejr3dfvPZ5sfXqVrqv7Q5APfd6WFlZMfvYbPYF7sPexh47aztzeTZf2/Cz788sW7aMPn368OvaXwktGpptU6Ojo2nbti0iQseOHR/+TXV0dJ4b9AGAzvNBShRc+hFMxtwtNyoK3N2VIR6oQUaxN9T5uXOwe7dy3zOZsj6rafBCEQhYAPXWgPMlsPkUnCdCkw/Bzw/274f8+dUApmtXaNQIatWCjz+G8HA1ex80KN0TII2AAHjvvfRrEbgyX2kHvPITFH09U3YRwcrKiilTpph9/Y8FHyMkNoSAoQHcGHqDTZc38dtvv/H76t/ZXnM7NYqpQcK3h77ljRVv8GKhF6nqWpWjwUcp7Vwak5jo+GJHmpRqwunbp+m2thsAQZ8GcWvrLcaOHcvu3btJLJLIhxs+zPJ5TCYTzs7OjBs3DgcHFcdgh/8OsxGhjo7O843uBaDz7AneBEVbgnWeh+d9Uo70AtdG8EIv5bpnba0C+RQqpER8IiKU9X/LF6ChEaokwt4ocOoIdtWgTBn44AOoVw+OHlUugGvWqEBAJpPq9IsUUR2+wQCenjB+vFpFSHMVvB/R1HbHhW+hzHvgUCxLlpEjR9KkSRPatWtnTjOMNzCgzgDmnphLAbsCRAVGwTI4uvco84LncfLWSQKiAhhQdwCjGo5ind86em/sDcDFgReZfXw2U1tMpeCUgjjZOWEwGLgdc5sRCSPYvHkzW7duzSLtm0ZqaioNGjTA29ubIkWKmNOjkqJY77eeXrVy2W1TR0fHYnQvAN0I8J+BZhI5NkAkIeTvqe/cJJED3ZWVPygJ3wsXRKwQafmCyFkvkc01RH5zF9kxRCQxVGTpUvXsqFFiDvzTvbtI69YiN26o69Wr1W/XriLVq1ventREkS01RYzZS+mKiAzcNFB2ndwlcXFxEmuMzXL/wp0LMm//PPEo7SFF31dBfdacWyM7/XcKnkiDRQ3MVv+7r++WVFOqaJomeCKhcaESHh8uEQkREhEXIa07tpb69etLeHh4ju2JiIgQEZGgoCDL31NHR+dvA90LQB8APPcEbRaJD/576zRGivxZR2R5GZFPEDn8ochIRJbZinyDyOEBIre25+yBMGCA0ujPSFiY+vX3F4mOtqwdphRVj4hIfM4d6bp168SmsY14X/KWi2EXBU8kJCZEYpJi0osymaRNmzYyZMgQMZlMgidiPd7a3On7hfnJJ1s+ETyRpBQVU+HbA9+avQZEROLj46Vt27bSunVrORVwKovufxqapkmjRo3k4sWLlr2njo7O346lAwB9C0Dn2XFxBhRp+viR/R4XLVV5AiRHgSlRSQy7NYZNe6FzZ7WMX7s2/PILvPqqeubcOahaNffakBQGJ4dD/aVgZZ1tFhEhMTGRsLAwinsUx4CBJFMSjt840vyF5gysO5Bt17ZR+Ghh9u7dy44dOzBYG7D92pZNXTeRN09eem3oRUB0AMs7LKdn9Z7msvN8nYf57ebTq1YvwsPDefPNNylXrhyLFy8mz6Q8fNHoC7xe98rUHj8/P8qVK4emadjZ2d3fXB0dnecEfQtAXwF4fok4JXJ7z7NuRVbu3hVZuVIdIHLokEpPEwAqXFj9xt5bhk9OfvQ6InxFjvR5aLaAgABp1qyZ2dffaryVlJxeMlOeZaeXSa2htcTDw0Nu376d6R6eSPFpxUVEZMPFDRKZGCkiItFJ0bL16lb5bNtnEhYfJpcuXZJy5crJ559/bq7ry51fyq3YW1na1KtXLzl69Oijv7OOjs7fCvoKgEJfAXgOCd0Nxggo+YzdxvbuhaZNwc0NQrN3czMTG6uMA8uUgcuXVSwAgwG2b1cSvw/DlARJoWBfDKLPgctLOWZN+zd55coVKlSoAEB8cjxWBiscbJW1/Zc7v+TSpUvs89yHt7d3Js39irMqcvnuZVXWuMz/vg3jDZRwKoGLgwu+x3xx3ezKJK9J9O3bN8f27Nmzh4oVK1KsWFbjRB0dnecPS1cAdDdAnb+PpDC4ulD54T/rzh+Utf5nn6mAPslZI9qZmTIFnJyUlf/Vq6rzB+U18PrrOT+XkZA/4fJs5enwgM7fZDLRtGlTQkJCGHp8KBfCLgCQL08+HGwd+OvqX7Rb2Y4Z+2awfvx6vLy8KF2lNJ9s+QQATTQu371Mj6o9+Pq1rwGYdWyW2TVPxgmBnwYy0nEkrptcWfHLigd2/gCnT58mICDAsvfU0dH5x6BHA9T5+9CMue/n/yiIqFC+Z84okZ4XX4Q2bVRH7uSklPuGD8/8THg4rF6dffCeokUfXufN9YBAiXfA4+2HNE+wtrZm8eLFuLu7czLkJI2WNqJSoUoc7HMQAP9If/YH7Cd+dTyOZR3p168fVeZU4ULYBWa1mcX3h7/HPb87v57/FVsrWy6EXWB+u/nUKV7HXMfEiRNZvHgxu3btouoD7BrWrFmDm5sbQ4fmEDBJR0fnH40+ANB5+mgp4DcNKn0KFT95Nm1YsgR++01F+UuTqxVR54mJMH26ms3HxSmBn7p1VZ6QEPDxyZzfElLiwNoe8pUCw71/Zg95dvDgwbRs2ZL27dsD8Fvn35h+ZDpNSzcFYOvVrXxY80PObTzH3Ji5LFm1hEUnF/HRSx+RkJKA82RnYowxTGs5jRHbRtC7Vm/+vPonjnaO1PeoT3JyMh999BEHThxg34F9lPQo+cD2uLi4UKBAAcveV0dH5x+HPgDQefqIBlZ26R3h02T3bmjSJH2ZPo2iRdX+/dat97Xt3h55//5Kse+FF2DEiPT06tXV7zffWN75A5wcBsXbQIkHz/rT0DSN0aNHU6hQIQA6/d6JtX5rkXGCX5ifeQn/+xrfM/f7ubT/tj07A3dyPuw8+3rtw2ufF/Y29hzpc4QXXV9k+CuZVzIiIyPp2LEjTk5OXHvrGmFWYXiIBxfCLlDVLfMqwMqVK4mJieHjjz+2/H11dHT+eVhiKfhPPnQvgGfMhe9E4gL+nrrSwuj6+eWcZ8yYdCv+jKRZ+mcngPPOO8rH3xKuLBRJuqsEfizk999/lxEjRmRKC44JFp8QH9l3Y5/YTrCVWUdnSUxcjOCGtB7eWsLjw82R/fBEIhIiBE8kxZQiMUkxsvLMSlnvt15ERPz9/aVSpUoydOhQSU1NNdex7eq2LFH9TCaTBAYGytWrVy1uf25S7sdyMmr7UwoDraPzHwFdCEgfADwXXPtJdYjPktGjxRyWF0TOnFHnjRqJ7N4t0q2bSFQ2Snw9e4qcOGFZHalKYEcu/igSdyPbLL+e/VVmHp2ZKU3TNElKSpKQEKWEOOfYHIlPjldN9UReXviy9Pqjl4iIDBs2TBq1aiR34+9KcmqymDST7Lm+R16a95K5rK6ruwqeyCuLXhE8kUOHD0mxYsVk5szM9WbH6tWrZciQIZa971Nioc9CORFs4TfX0dHJFn0AoA8Ani3Xf01Xuvs7iI5Wf53vV+kTEQkNFdm6Vd3PONNu0SI9Pe0ICBCZO1ekcWORChVEvL0fXndqksimKiLGiAdm+3z759J+ZXtZd2GdlJpeSm7evCmNGjUy+9+LqE4/bWY+ad8ks//+9u3bxd3dXfgM86y/4syKcjdBDa4OBR6S0tNLC57IsL+GiYjIzKUzpXDhwrJx48YHtkvTNImIiJCkpCQJDQ19+Pvq6Og81+gDAH0A8Gy5c0Ak8tzfV5+mifTvr84PHxaZPz9rnoYN1V/5WbNErK0z3wsNFfntN7UVMGSI5LgdkBFjlMi1pffOs+/88URmHZ2VKe148HEZ4D1ARESuX7+e7TM91/YUPJHzoeclPDxcPDw85Iv5X8ikfZNE0zSJSYqRyrMrm5fw8US6r+kuYfFhommaTJ06Vdzd3cXHx0eMqcYHvsauXbukS5cuD35XHR2dfwz6AEAfADwb7p4UuTDt2dTt5ydiaysyaZJI8eLqNyBAxHivA5wzR8TDQ2TePPVX38pK5HH3uk3JagBwekzOcQNE5ETwiSwBfDRNkxYtWsih04fkm/3fmDX3TZrS8b8ZfVNERAKiAuRq+FWhMjJkyBDBE1nos1BcpriYVwbuJyUlRfr37y8upV1k+O/DxSfEJ8s+fxqpqaly7pwapCUlJT3yJ9DR0Xk+sXQAoAsB6eQuDkWhQLVnU7ednfIAGD0agoPhiy9U6N403foBAyAoCNq2VQv+jRvD/v2PXs/tnXD4fcjjDDW+VqF8c6B28drkz5PffC0iGAwG5s6dS5hdGKN3jsZqghUHAg5wJOgIi9ovorhjcQCCY4Ip17cc5bRyNO3bFIB+3v2ISIwgPD48S1137tyhVatW3Lhxgz4/9qHiCxWpVbQWoSOyVzm8ePEiEyZMuPfpdG1/HZ3/GroUsE7ukBoPZz2h+kSwfgadSXS0kuqFdBc+UOp9d+8qud/7CQtT6SkpYGOBi2LESaVp4FIHUmMgT8FHbubXX39N6dKlee+991TzNBMlfyhJSGwIAC+7v4xJM+Fzy4czXc7QsEFDDuw5gF1xO5aeXkrb8m0pYF+AakUyD7KW/LGEPh/0YczgMXh6emJtbc3oHaNpUbYFr5fJrFZoNBrZvHkz77zzziO3X0dH5/lHlwLW+XuxygPOVdXvs8DJCT7/HCIj02V9T5yA/PnB3j77Z1xd1WDhYZ2/ZlL5Em9D0m0Vve8xOn8Rwf5lewpUTxfX+WTLJ7jlc8M4xsicNnO4En4Fn1s+zGgxg4/7fMzYL8fy+l+vU2l2JSY3n0yjUo0ydf4iwnfffcdnH31Gg/814Ouvv8baWkUX/PPqn/hH+mdpR1RUFHv37kXTtEd+Bx0dnX8P+gqAzpPj952SuXUs+/fWGxWVPusH1fF37Qrr16sOu3Zt8PVV6n45DQIs4ehH4N4ePNo/dhFHjhxh/vz5HKp9iJ7VevJVk68AOHzzMFfuXuF61HX23NjDnoA96oGDUDexLlu3bsVlqgvD6g/j+yPfc/PTm3g4KVni6OhoevXqRVBQEKtXr6ZUqVIPbEN8fDzffvstX375JXnyPKOBmo6OzlPH0hUAXQlQ58lxcIc8f7NkbHQ0FCwISUnpe/zNmsGBA1CjhrpOk/D184PKlTNvDTwMEQj4VWn41/ACu0JP1Nw6derg4uJiju6XxislXqGKWxWcJzsTMiwEo8mIo+ZIiekl6PpzV6KTo80R/ZJSkyjkoNrh6+tLp06daNWqFb/++qtFe/h58uShSJEi5hUCHR2d/zb6FoDO4xO6G4I2QumuT9xBPjLOzmrvPmPHt24dTJ2qovdl5IUXYOVKdW4wqBWCnLhwQS35A0RfAGM42Ls+0NDvQcTHx9OsWTOSkpLQXDSzpG9GnOyckHFCMcdilJlRhm7Du9H1na4MPzWcxScXA+C1z4s5J+bgYOvA0qVLad68OePHj2fWrFkP7fyNRiOdO3cmLi6O//3vf/oAQEdHB9C3AHSehAgfFfSmSJO/r87YWKXn36nTg/Olpqq9/VOnoFat9PRJk6BHD8huuTwsDEq6wdrq0PII2DjkSpPPnDlD9erViU6KZuqhqUx8fWKOeaf8NYXJ3Sdz+tRpUhxTKOlUkhrza9C6XGtqFqrJ3rl72bJ7C2693PD9yvehdduMt2Hb+9uwDrSmcePGGB4lnoGOjs4/Et0IUOfpkRQOF6ZCwZf+3s4fYNcu6Nw5/VruRei7ejU9LToabG0hIgJeeknZAKTxxRfZd/7JkWA8BIkCTf/Mlc5/wIABHDlyhOr3Ago52zubO/+k1CSmHJjCOr91zD0xl8DoQADOrD1DYuVEbAraUH5meey87OhapSu1rWrzfd/vSUpKYvHGxbSq3+qh9WuahrZE48b1GzRp0kTv/HV0dDKhrwDoPDpJ4RC0Dsp99Kxbovj9d+jQQXX6ady8CYcPw8svK2+AB60YaCZIugWX50DNSbnWrPPnz1OuXDns7OxIMaVga21LZGIkzvbOXLl7hUqzK1G3eF2OhxwHYE+PPbSs3pLSY0tz2XiZy59cptb3tTBuN+IS4MKkSZPo3bt3th15v4398GzqibuTO6As/QsUKEBQUBAeHh659k46OjrPP/oKgE7uIwJ+34OVbe51/hs3Kte9x0XT4N13M3f+oKz+u3SBjz/OvGJwPwG/wanhkNcj1zr/5SuWM23aNKpUqWLen88zMQ8LfRbi8q0LX+78koqFKyLjhGP9jnH5k8sA2IXb4VjMETtnOzqU70CFbhVwWODAoFcHcfHiRfr06ZPjLH7RqUVci7xmvn733Xc5ffq03vnr6OjkiD4A0LEc0QABq1x0HnnrLfD2tjx/vnzQ/p473tixYG0NKXl5+wAAIABJREFU48apbYCMpPn4N20Ko0ZlLSd0L3wzCGr3g+oTHrv52fH+mfcpVqdY5upGhNKrVi9knPBN828y3UtKTQIgLj6OfKn5uLboGns+3UNjGnPw4EG+//57ChZ8sO6AjBMal2rMpUuXMBqNeHt7U7NmzVx9r+zQRMOUZjSZywRGB2IYb+Dfvkqpo/Os0N0AdSwj7CDYOMKLw3O33Ef9z33fPihcWJ1//TW88Yaa5RcvnjVvfLySBY6PT0/TUtQKRkIgNH8Z3GqCrdPjtz8DQUFBjBw5krBFYbhOc2X9nfUsenMRBewL4JYvGyXCe1QrUg0Zp7S5vby8MBqNvPrqq1SsWFGVGxNk9v1/GDNmzKBr1640btw4V97pYZT+oTRhCWEkfpmY62W7O7rza8dfddsFHZ2nhG4DoGMZgWtVR1msxdOv6/vvoUoVaJXB0C0sTM3q78dgUHr/P/2U9Z6mwWuvwZ496SsEu1pAralQMPdnxyaTiSNHjtCwYUMKfVuIiMQItvXcRoMSDXj7t7fZ2nMrJs2E134vdlzbQePSjZnU7MHbDiKC1QQrznx8hipuVbDKwR3x0KFDeHh4ULJkyVx/rwcRY4xBRHC2d/5b69XR0ckZ3QZAJ3cwJUPIX1Cy49/T+QMMHw4jR6ZfR0UpzX6jMWtekew7fwArK9i7F0xJSq1QNGi4Ktc7fxGhb9++3Lx5k4YNGwLQ8cWOHO97nBZlW5BsSmaH/w4MGIhKimL83vF0rNyRFi88/HsaDAZWvLOCzVc2Yz3BmqNBR7PN5+vry7Vr17K99zRxsnPSO38dnX8o+haAzoNJDIHgTVCsVdZ99qfF/atSBQrkvFUQEAAzZqhVg4xoGixYAL26qJULLRlMxlwXLDKmGrGzsaN79+54eHgQY4zhyt0rzG07F5uvbQgZFkIxx2JmNT/XfK7m8wdhGG9gbOOxjH9tPDeibpg7/nIu5TLlW7duHY6OjgwYMCBX30tHR+ffj74CoJMzESeVdXzdWX9f559GXBwEBmZOi4rKms/PD6ZPz5oeFQWTB8D+zip4T5XRuSbskxH7jvYYuhq4XuA6NjY2zDsxjzoL62DztRpb99nYJ1N+70vexBhjzNfXIrKfte/vtZ/B9QYD8EWjL9jQbQNz2szBxcElUz43Nzdcs9sa0dHR0XkIug2ATvaIwOH3oOpX4FTx76+/d29YuhQSE+GHH5Qlv5UV/PEHNG+uvAFy4tZ2JeFbupua9T/F8MR7j+/l5J2TvPfaexTOW9icfujmIVzzueKa15UC9ulxEgzjDax8ZyXdqnUzX5/qf4qaRXPelgiLD2PWsVmMf228OW3JkiXEx8czaNCgp/BWOjo6/2QstQHQBwA6WUmOVtby9oUfnvdpERwMHv9v777Do6rWPY5/V0IaHQJIh0gTAhgJhHgQpWPBIwdFENBjxYbX7hUbRs9VDgpiFxQLiKAgR0QFOdhQFOktdKSFAFICJCE96/6xh0BMh5lMkvl9nicPM7u+ez2j691rr71WY9i6FVq3hhMnICTEGdlv/fr8Hwmk7Hem6U3cDhmJUPdij4W3bds2PvroI6bVmUZ8YjwZT2d47Fzf7/ye3lN757wpkJ6eztGjR8nOzqZRo0YeO6+IlE/qBChnb9882Pqad2No1Mip5Fu4phi21hnbf+1ayCrgvfN1Y+DPxVCzvdsr//jEeEyMIdtmcyLtBHsy9tCtWzdi74nlyGNHcrYzMYaHv837qqSJMcT+GXtW5+49tTcv930ZgA8++IAxY8bQoEEDVf4ick7UCVBySz8GYSNK/n5+SUVEOJP6nHde4dud6nuQmAjVqzvfz+yPYLPh1xuh0wSImuSxvgp1K9clpkcMWZlZXH3L1Sxuuhg79nQZnUg7wU3/uQmAOyLv4GDSQc6revra3rjiDZrXbI61lkGfDeKjgR9RPah44w9M+8c0utbvyt69e7nxxhtJT09378WJiE9SC4CclnEC/tsNMlM83+lvxw7n+X5h4uKc4XytzTvQj82Gw79D9MXQYBgE1fZozAH+ATxz2TP4+/tz+xW3k/l/mbnWH089ztwtcxnZaSRt32xL/fH1c93x3xt1L1UCq2CM4YvNX3A89Xiu/dMy00jPyr9iH9FxBBt/28iECRMICAigSmH9H0REikl9AMRxalY9T3Sai4yEhQshtIhX8GbNcib1qeRqmFq6FC65BO6/33nN79Rv1VpIOwS/3wE9v4RDh4s+thtMmTKFiIgIIiMjGfTpIB7r9hjRjaPzbPfOineoHlSdwe0GE+AfkM+R8vKL8aNBtQbse2hfruVHjhxh/fr19OjRA2utRsUTkSKpD4CUTOwLsH2yZ3rMr1lT9N2+tc6kPtu2nV4WHQ2Zmc5Y/7Guu+l9X8OKeyG4Hlw2F7JtqVT+E5dO5IjfEWrUqoGJMfyR8AcJKQlsPLQRE5O7Ur6r810M6zCMAP8A1h9cj4lx7voLk/pUKrvu35Vn+a5du/jll18AVPmLiFupD4A42twH2ZlFb3c2Cuq0dyZjTt/hJyU5r/xlZ0PVqs6z/+rb4ZiF83pAaBfPxFmAP/74gxdee4HH73uclue3pG2dtiy7YxnpWelkZWfxVPen8uxzw+wbuPC8Cxn9/Wi+GPIFvcJ65VqfkJJArZDTE/wE+gfmWr99+3a+/PJLHnroISIjIz1zYSLi09QC4OsyEuHXEeAX5DxHLwuqV4fzz4dq1WCdc/dLVipkp0KlKs7dfynKyspi4oCJPHTxQwBsvHcj+07so9qL1Zi4dCLP93o+zz5nDo97zQXXUC2oWs73bJtN7XG12XN8T579cvavUYOG+U1wJCLiJuoD4Ouys+DAImjYv+htS1viCVjSG7rPgSpNSv301lref/99RowYQVBQ3kcjby57k1HzR9E6tDUzrp1BpwadCjyWiTH0Pb8vS/YuIfmJZOZvm89Pu39ibJ+xubbbvHkzzz//PB9//LGa/EXkrBS3D4AeAfiy+G8hoGrZqfyjopyZ/W65BtY+CT+0hnVhcLmr8r/xRpg9u+j+BG6Snp7Otm3byM7Oznf9sA7DeGv5WwRVCsLgVNYFddR7qe9LdG/ancT0RAD2ntjLj7t+zLVNSkoKrVq14pFHHlHlLyIep0cAUnZcHg2tAyGkIYT9E1q0hFZnDEP83HOwYIFHQzjVIvb7779z+PBhxo4dS0hI3jkE1h9cz9hfxvL18K9ZfcAZynfcknH4PZf/f1KP/O0RujbuSp/z+wAwMnIkS29fmrN+x44d9OrVCz8/Py666CIPXJmISG5KAHzV0VXO9L51u3k7EsjKgI0b4K4roMlJMH5Qv5czBsDzZzxfDwuDyy7zWBj3fH1PTgW+cPFCNm/enO92KRkprNq/indXvesM7jPGueu/L+o+to7amms7E2NyTf7zV9ZaNm3aRIsWLViwYEGBd/4mxjBvy7xzuDoRkdzUB8AXZWfBT1fDxR+Weoe6fM27GsZ8Bau8+1tMTEsk7mgcy1Yt4+YVN+eZtvdY6jFqBNWgyStN2Je4r8BpfZPTk2nyShMOPHKApXFLubTZpQWec9++fdx8880sWLAAf3//ArebFTuLfi365epcKCKSH40DIIXr+Y13K/+sVFh6q/Nv/2mwMv/n7KWpWlA10v9MZ9k3y/Kt3Gv9uxav/v4qcQ/FFVj5gzNqYFpWGgF+ATmVf7bNfX3p6elMnz6dhg0bsnDhwkIrf4DB4YNV+YuIWykB8DXH1sMP/bx3/oPb4dcp4B8Mja8B4w+BNT0/9HAxxMbG0rFjR958800SUhIY+8tY0jLTcm3z3R/fFXmcQP9Akp9IzmnOv3Xurfg/l7uCP3nyJKtWrSIzMxNjDFsOb8kzoJCIiCcpAfA1NTtAt5mle05rYenPzhwD74yF8bfDjBmwNAP8ijdUrqdlZWXxwAMPcODAAQBqj6vN6O9Gsy/x9NC8doxl3rCSP4d//YrXiXswDoATJ04watQoQkJCGD9+PAEBzvXXDqnNLRG3uOFKRESKR30AfMle13C0TQZ65vjR0dC/PzzwAOzcCZ1c78Vv3w4xrSDmIzjfmTGPgQOhRg346CPPxFIChw8fpkqVKgQFBZFls5wm/Mw0giqdfvd/97HdpGam0qZOm0KOVDhrLdZaZs2axfXXX69X/UTEI9QHQPKq0gSqhnnu+NddBz17wvjxzgRANht+ugYaV4cP06D5CJg40WkR+OKLUqv8l+xZgokxTFk1Jd9m9kmTJvHRRx9x27zbCPxXINZagv8vmC2Ht+S8FnjTf26i87tF/vdUoOTkZP72t79x8uRJhgwZospfRLxOLQC+IvVP8A+BgGpFb3uuknfDge+gxa1weBnUjgQ/fzh+HGrWhNRUyGdkPU/Zc3wPE36bQEyPGJbtW0bfFn1z1iUkJFCzZk2staRnp5Ocnkxo5VDC3wrnj4Q/SM1MJfuZ7HOqsI8ePUrt2rXZvn07LVu2dMcliYgUSC0Aktve/8C2tzx7jqOrIXkP+AU7vfsB6kQ5lT84Tf7WerzyP5lxkqzs0xMQNa3RlImXT6RGcA36tujL5sObMTGG2NhYBg50Hof4+fkRXCmY0MrOzII//PMHtozawoa7N1Dr37U4kHQgz3neX/0+1V+sXmgsaWlp9OjRg4SEBFX+IlKmKAHwFa3uhHb/65ljJ+92/v3zJ0jcCiHnQet7PHOuYqjyQhV6Te1V4PpWtVvx7dBvCQ8PZ+HChfne3derUo+mNZoSXi+c0MqhdHy7I32m9sm1TWpmap7X+870/fffExgYyPLly6lVq1aB24mIeIMSAF+QsAY2vuT+42alO3f6iwdCRhJc8ADUz11JsmYNPP54/vt76PFT2lNpfHdTwa/r+Rk/xtw8hlWxq3JN8nPZB5fxr8X/yrXta7+/RlTDKBaMWMA7A97Jte6eLveQ9ERSvudIT0/n3XffJSEhIeccIf8XwuBZg8/2skRE3EoJgC8IqgOhZ9+BLRdrnb+9X8Dyu533+S9f5UwqlJ/YWPjgg/zX+fnBrFnuiesMgf6BVPLLf56rrCzn0cBLU18icnZkrnX9W/YnunF0rmXnVTmPelXr0alBJ1rWLroJPy0tjdGjR5ORkcGMGTOoXfv0FMtzh86lQdUGJb0cERGPUALgC0IaQd3u53aMU3frPw+Coyug4RXw/F7o0aPwQXyGD4eDB/Nft2YN/P3v5xZXCb322mu8/PLLtKzfkp9u/inXuie6P5EzWQ/AivgVGGN49fJXi3Vsay2BgYG0bNky5/3+M1ULrMbry14/twsQEXETJQC+YP2zEPvi2e1rrdO576erne+dX3d69fsHwaNPwFNPnX1cF15Yqm8D7EzYSeZFmdx+++28veJtLvvQmVjo1rm3snzf8jzbz9k0h/vm31esY6elpdGtWzeOHz/ObbfdRmBgYJ5tLm5ycaFDCIuIlCa9BugLrC3ZULuZKVApBH6/AxoPhAb9Ie0whNT3XIwetmfPHq4achUb+m3Axji/+c6TO/PI3x4h5qcYXuz9IhlZGVw/+/oSV9Lx8fE0bNiQHTt20KJFC0+ELyJSbHoNUE4zBvZ9DZsmFLxN/HxIPQTHYuG7ns6yjs87Tf1+lXJX/sbAL784n48fh5tu8lzsbtKkSRNmfzg7p/IHiGwYSYOqDdh07yYGXjCQ6eunl/i4qampDBgwgGPHjqnyF5FyRQmArwjtAvV7O1MBf9fH6cF/8EdY+7SzPmE1pB2CGm2h7xJnWUh9MPn8RObMOT3M78GDMG1aqVzC2br//vtZu3YtbdrkHsZ30oBJXNb8spzvyRnJrL5zdbGOmZ2dzaeffprzml/NmjXdGrOIiKcpAfAVwfWg1oWAhQv/5dzV12gPzW9w1oc/ATXaORW+nz8cOgQPP5z/sf7xD6hc2fncurXHXudzl2HDhuWp/PNzMOkgJ9JOFOuY6enp/PzzzyQnJxc5la+ISFmkBMDX+FWCOtFORR9cx6n087NlC0wo5JFBObBjxw4mTpxI165dCQkJyVmenpXO9HXT6f9x/1zbr71rLf9e8m8S0xILPGZKSgq33347mZmZvPHGG1SrVgpDK4uIeIASgIpuxoyCB+IpzCWXlPk7+6IEBQXRtGnTPMtnxc5ixH9GcCj5UK7lxhi+2fYNSen5D+6TmZlJcHAwAwYMoPKpFhARkXJKbwFUdG+8Af/9L8ydW/x9srOdQXrKsc8//5w+ffpQo0YNtxzv5MmTREdHs2TJEt31i0iZprcAxDFqVMkq/9hY8Pcv13f/1lqWL19OQmICWw5vKXLbomzatInKlSuzaNEiVf4iUmEoAZDc2rWD7dtLNm5AGXLs2DG2bdvG2LFjmbFzBhe8eUGB236w+gP8niv8P4Hk5GRGjhxJUlIS9erVy3eb2Rtn8/XWr88pbhGR0qYEQHIzBsrx++zLli3jww8/BGB099H0CuvFgcS8U/kCDG0/NN/X/io9V4nY/bG8+eabBAcHs3jxYqpWLWCuA2DyysnMjJ3plvhFREpL/jOmSMWQnQ2jR8MLLzjN+hXcwYMH6devHx3/1pEjJ48QWjmU73d+z/0L7md/0n4W37I41/YhASFE1I/Ic5yezXsSVCmIQ4cOkZ6enusNgvwsvHGhW69DRKQ0qAWgIsvIgHHjIDXV25F4XFZWFldeeSUHDhygyStNcsb5/2bYN3y28TO6NelWrOMkJSVRZU4VGlRuwLPPPltk5S8iUl7pLQAp9zIzM0nPTscPP4IDg3Oty7bZHD55mHpV6mFiDKO6jOL1K/OfkS8hIYFatWqxZMkSunUrXsIgIlLW6C0A8RmTJk2iSr8qRE2JyrPOz/hRr4rTeW/RjYt4/JL8x0Q4evQol112Genp6XTr1g0TYxj/63iPxi0i4k1qAZByLzMzk4QTCdSsUZMA/wB2H9tN/4/7s3nU5iL3TUxMZN68eQwbNoy0tDSCXNMTL9mzhPB64dQM1hj/IlK+qAVAHF99VW5f6StKdnY2na/oTMD/BlC3dl0C/AMASM1MJTM7s1jHSEtLY8OGDVhrcyp/gG5Nu6nyF5EKTQlARRcVBW++6dlzXHMNvP22R0+RkJKQZ9AePz8/Hr77Yd4f/n6u5W3qtGH7/2wv9HirV69mxIgR1KlThxdeeAFTQZMkEZGC6DXAiq5ePbjnHs+eo1kzaNDAo6eoPa424/qM49FujwIQHx/PDz/8wPDhw0t0nPT0dOLj4+nQoQNPPfWUJ0IVESkXvNICYIwZbIyJNcZkG2M6n7G8uTEmxRizxvX3zhnrIo0x640x240xrxndsp2du++GX3917zFfew0GDnTvMf8i8+lMHvnbIznfExMTOXnyJOAM5ztvy7w8++Q3q98PP/zASy+9RKVKlbjggoJHCRQRqei81QKwARgETMpn3Q5rbd7RWeBtYCSwFPgGuByY77EIK6qff4YePbwdRYn5+zkDGe06tovUA6mEhYXRpk0bAA6fPMzfZ/6djKczqOTn/KRX7V9F5ORI7BjnscGSJUvYv38/1113Hf369fPORYiIlCFeSQCstZuAYj93NcY0AKpba39zfZ8KDEQJQMlt2ODtCM7a8dTjhL0axv8c+x+uuuKqnIq8bpW6ORX9KRfVv4jkJ5Kx1pKdnU21atVyWgzUeCQiUjb7AIQZY1YDJ4CnrLU/A42AuDO2iXMty5cxZiROa0G+88FL+VQjuEaeir4gxhgqB1Rm7NixBAUF8eCDD3o4OhGR8sVjfQCMMYuMMRvy+bumkN32A02ttRcBDwGfGGOqA/ndshVYE1hrJ1trO1trO9etW/fcLqS8S0/3dgQlVmdcHQ4k5Z7A56utX2GeNfTp04ddu3blWvfdH9+RkZWRa9ns2bM5ePAgd911F/fee6+nQxYRKXc8lgBYa/tYa9vn81fg5PTW2jRr7RHX55XADqA1zh1/4zM2bQzEeyr2CiMtDYKCICHB25GUSNVAZ+a96PeiuWXuLc7nxtFMunoSb7/9Ns2aNcu1fZ9pfVi2bxkAGRlOIrB//34OHz5MzZo1CQwMLMXoRUTKhzI1DoAxpq4xxt/1+XygFfCHtXY/kGiMiXb1/r8JKDCREJegIDhwAGrV8nYkhTqQdIAeH/bI+b7rgV3Ur1qfB6Mf5NaIWwGoU7kOwbHB1K9fP88zfDvG0q1pN7KysoiKimL//v3cd999hIeHl+ZliIiUK956DfAfxpg44GLga2PMt65VlwLrjDFrgdnAXdbao651dwPvAdtxWgbUAbA4zjvP2xEUKSElgaVxS/MsH9J+CN2bdQecV/1Wr15NQEBAnu3+/PNPXnnlFfz9/Vm0aBENPDwmgYhIRaC5AKTcOnjwIImJiTRs2JBJkybxwAMPqIe/iPg8zQUgFcq6deu48cYbsdYyf/580jPTmT9/Pt9//z2VK1fmwQcfVOUvIlICSgCkzFlzYA0mJndl3q5dOx577DGMMXz88ccEPRnE9qbbGTlypJeiFBEp3/QIQMqckxknmb1xNjddeFOB2xw+eZjqQdUJ9FcPfxGRM+kRQEW0e7e3IygVlQMq51T+fab2YcOfeUcvrFO5jip/EZFzoASgLJo2DebMcT6npYExzut8zZvDiRNeDa207Tuxj2Opx7wdhohIhVMWhwKWmTOhcWMYNMh5l//zz6F+fajgj2vys2nUJm+HICJSISkBKIu+/jr390GDvBOHiIhUWHoEICIi4oOUAHibMTB1au5lu3c7y32wyV9EREqHHgF427Rp4JrXPkejRvDJJ04SICIi4gFqAfC2ESOgXr3cyypVghtu8E48bnIs9Rjf7/ze22GIiEgBlACIR3yy/hN6T+3t7TBERKQASgDEI+7pcg92jPowiIiUVUoApNQ0HN+QySsnezsMERFBCYCUojsj76RLwy7eDkNERFACIKVoTI8xtKnTBhNjSEpP8nY4IiI+TQmAeMSJtBP8Hvd7nuWVAyrz0cCPqBpY1QtRiYjIKUoAxCMmrZhE9JTofNcVNs2viIiUDiUA4hGPdntUbwGIiJRhSgBERER8kBIAERERH6QEQERExAcpARAREfFBSgBERER8kBIAERERH6QEQERExAcpARAREfFBSgDknGRmZ3o7BBEROQuVvB2AlC2HTx6mTuU6xdp2/rb5XPnJlRrxT0TOWkZGBnFxcaSmpno7lHInODiYxo0bExAQcFb7KwGQHMv3LSfqvahiV+j9WvRj30P7PByViFRkcXFxVKtWjebNm2OM8XY45Ya1liNHjhAXF0dYWNhZHUOPACRHl0ZdSnQ37+/nT8NqDT0YkYhUdKmpqYSGhqryLyFjDKGhoefUcqIEQEREvEqV/9k513JTAiAiIuKDlACIiIj4ICUAIiIiPkgJgIiIlBmn3gZw11/z5s2LPOfevXvp2bMnbdu2JTw8nFdffdXzF1oG6DVAEREpM3bv3o217htbpDgd5SpVqsT48ePp1KkTiYmJREZG0rdvX9q1a+e2OMoitQCIiIhPa9CgAZ06dQKgWrVqtG3bln37nDFO1q5dy6WXXkq7du3w8/PDGMOYMWO8Ga7bqAVARETEZdeuXaxevZquXbuSmprKkCFDmDp1KlFRUTz99NOkpqby7LPPejtMt1ALgIiICJCUlMS1117LxIkTqV69OosWLaJTp05ERUUB0LFjR44ePVphxi1QAiAiIj4vIyODa6+9luHDhzNo0CAANmzYQIcOHXK2WbVqVc6jgopACYAUasqqKZiY3NnujqM7mLh0opciEhFxL2stt912G23btuWhhx7KWR4aGsq6desA2Lp1K3PmzGHo0KHeCtPt1AdACnVdu+toWqNprmVL9i7hwW8f5IHoB7wUlYhUVM2aNXNrE3uzZs2K3GbJkiVMmzaNDh06EBERAcALL7zADTfcwJdffkn79u2pU6cOM2bMIDQ01G2xeZtx5+sWZVHnzp3tihUrvB1GmZacnkxIQAh+Rg1CIlK6Nm3aRNu2bb0dRrmVX/kZY1ZaazsXta/+jy9UfbEq//zin94OQ0RESpEeAQgpT6YQ4Bfg7TBERKQUKQEQgisFezsEEREpZXoEICIi4oOUAIiIiPggJQAiIiI+SAmAiIiID1ICICIi4oOUAIiISJny8MMPM378eAAaNmxIfHw8P/74Iz169ABg5MiRTJ48GXCm701MTGTevHlcffXVAAwbNoxPPvkEoFijCqamphIVFcWFF15IeHh4hZnutygaCVBERLzmryPZRUZGsnLlylKNwVpLcnIyVatWJSMjg0suuYRXX32V6OjoUo3jbGgkQCmRtMw0TIwhISXB26GIiORy6s7eXU61BBTGGEPVqlUBZ1bAjIyMnJaDtWvXcumll9KuXTv8/PwwxlSYFgIlAD4oqFIQ7139HjWDa3o7FBGRXKpVq+bW43311VfF2i4rK4uIiAjq1atH37596dq1K6mpqQwZMoSXX36ZjRs38uSTT/LII4/w7LPPujVGb1EC4KNu63SbW2fcEhFxhwEDBrj1eMVpAQDw9/dnzZo1xMXFsWzZMjZs2MCiRYvo1KkTUVFRAHTs2JGjR49WmP93KgEQEZEyY+vWrW493qmOgcVVs2ZNevTowYIFC9iwYQMdOnTIWbdq1So6derk1vi8SQmAFOnwycMkpyd7OwwR8QHubl4fOXJkkdscOnSIY8eOAZCSksKiRYu44IILCA0NZd26dYCTmMyZM4ehQ4e6NT5vUgIgRar7Ul2u+uQqb4chIj4gJiYmJwlo3bo1W7duZeXKlURGRgIlf0Xw1PLC7N+/n549e9KxY0e6dOlC3759GTBgADfccANJSUm0b9+ekSNHMmPGDEJDQ91+zd6i1wBFRMRr8nuNTYpPrwGKiIhIiSgBEBER8UFKAERERHyQEgAREREfpARARETEBykBEBER8UFKAERERDzo2LFjvPXWWzkwJM9bAAAJ3klEQVTf4+Pjue6667wYkUMJgIiIiAf9NQFo2LAhs2fP9mJEDiUAIiLi03bt2kXbtm254447CA8Pp1+/fqSkpLBjxw4uv/xyIiMj6d69O5s3bwZgx44dREdH06VLF5555pmcqYSTkpLo3bs3nTp1okOHDsydOxeAxx9/nB07dhAREcGjjz7Krl27aN++PQBdu3YlNjY2J5YePXqwcuVKkpOTufXWW+nSpQsXXXRRzrHcylpbof8iIyOtiIiUTRs3bizxPidST9jHFj7mthh27txp/f397erVq6211g4ePNhOmzbN9urVy27dutVaa+3SpUttz549rbXWXnXVVfaTTz6x1lr79ttv2ypVqlhrrc3IyLDHjx+31lp76NAh26JFC5udnW137txpw8PDc53v1PcJEybYZ555xlprbXx8vG3VqpW11trRo0fbadOmWWutTUhIsK1atbJJSUl5Ys+v/IAVthj1o1oARESkXNlzfA/jfh3n1mOGhYUREREBQGRkJLt27eLXX39l8ODBREREcOedd7J//34AfvvtNwYPHgzAsGHDco5hreWJJ56gY8eO9OnTh3379nHw4MFCz3v99dcza9YsAD777LOc4y5cuJCxY8cSERFBjx49SE1NZc+ePW695kpuPZqIiIiHhdcLx45x7zw2QUFBOZ/9/f05ePAgNWvWZM2aNcU+xvTp0zl06BArV64kICCA5s2bk5qaWug+jRo1ypl18NNPP2XSpEmAk0x8/vnntGnT5uwuqBjUAiAiIvIX1atXJywsLOfu3FrL2rVrAYiOjubzzz8HYObMmTn7HD9+nHr16hEQEMAPP/zA7t27AWdWwsTExALPNXToUMaNG8fx48fp0KEDAP379+f111/HuibsW716tduvUQmAiIhIPqZPn86UKVO48MILCQ8Pz+mIN3HiRCZMmEBUVBT79++nRo0aAAwfPpwVK1bQuXNnpk+fzgUXXABAaGgo3bp1o3379jz66KN5znPdddcxc+ZMrr/++pxlTz/9NBkZGXTs2JH27dvz9NNPu/36NB2wiIh4TXmcDvjkyZOEhIRgjGHmzJnMmDHDM730i0HTAUuJrIhfQdS7Ud4OQ0SkXFq5ciURERF07NiRt956i/Hjx3s7pLOiToA+KCMrgwC/AG+HISJSLnXv3j2nP0B5phYAH3Rxk4tZctsSb4chIgJARX8U7SnnWm5KAERExGuCg4M5cuSIkoASstZy5MgRgoODz/oYegQgIiJe07hxY+Li4jh06JC3Qyl3goODady48VnvrwRARES8JiAggLCwMG+H4ZO88gjAGPOSMWazMWadMeY/xpiaZ6wbbYzZbozZYozpf8bySGPMete614wxxhuxi4iIVATe6gPwX6C9tbYjsBUYDWCMaQcMBcKBy4G3jDH+rn3eBkYCrVx/l5d20CIiIhWFVxIAa+1Ca22m6+tS4NRDjGuAmdbaNGvtTmA7EGWMaQBUt9b+5prpaCowsNQDFxERqSDKQh+AW4FPXZ8b4SQEp8S5lmW4Pv91eb6MMSNxWgsA0owxG9wWrRRHHeCwt4PwMSrz0qcyL30q8+JpVpyNPJYAGGMWAfXzWfWktXaua5sngUxg+qnd8tneFrI8X9baycBk1zlWFGdIRHEflXnpU5mXPpV56VOZu5fHEgBrbZ/C1htj/gkMAHrb0y+AxgFNztisMRDvWt44n+UiIiJyFrz1FsDlwP8Cf7fWnjxj1ZfAUGNMkDEmDKez3zJr7X4g0RgT7er9fxPgnZkXREREKgBv9QF4AwgC/ut6m2+ptfYua22sMeYzYCPOo4F7rbVZrn3uBj4EQoD5rr/imOzOwKVYVOalT2Ve+lTmpU9l7kYVfjpgERERyUtzAYiIiPggJQAiIiI+qMIkABpeuPQZYwYbY2KNMdnGmM5nLG9ujEkxxqxx/b1zxjqV+TkoqMxd6/Q79zBjzLPGmH1n/LavPGNdvuUv584Yc7mrXLcbYx73djwVRYVJANDwwt6wARgELM5n3Q5rbYTr764zlqvMz02+Za7feal65Yzf9jdQZPnLOXCV45vAFUA74AZXecs5qjAJgIYXLn3W2k3W2i3F3V5lfu4KKXP9zr0r3/L3ckwVRRSw3Vr7h7U2HZiJU95yjipMAvAXt3L6NcFGwN4z1p0aRrgRJRheWEoszBiz2hjzkzGmu2uZytxz9DsvPaNcjxrfN8bUci0rqPzl3KlsPaQszAVQbN4cXthXFafM87EfaGqtPWKMiQS+MMaEozIvlrMsc/3O3aSw8sd5nPI8Thk+D4zHueFQOXuOytZDylUCoOGFS19RZV7APmlAmuvzSmPMDqA1KvNiOZsyR79ztylu+Rtj3gW+cn0tqPzl3KlsPaTCPALQ8MJlhzGm7qkOUMaY83HK/A+VuUfpd14KXH0qTvkHTqdMKKD8Szu+Cmo50MoYE2aMCcTpbPmll2OqEMpVC0ARSnN4YQGMMf8AXgfqAl8bY9ZYa/sDlwLPGWMygSzgLmvtUdduKvNzUFCZ63deasYZYyJwmqB3AXcCFFH+cg6stZnGmFHAt4A/8L61NtbLYVUIGgpYRETEB1WYRwAiIiJSfEoAREREfJASABERER+kBEBERMQHKQEQERHxQUoARCSHMSbLNcvdBmPMLGNM5bM4xnunJmsxxjzxl3W/uitWETk3eg1QRHIYY5KstVVdn6cDK621E9xxPBEpW9QCICIF+RloCWCMecjVKrDBGPOAa1kVY8zXxpi1ruVDXMt/NMZ0NsaMBUJcLQrTXeuSXP9+aoy58tSJjDEfGmOuNcb4G2NeMsYsd024c2dpX7SIr6hIIwGKiJsYYyrhzL++wDWh0y1AV5yJWX43xvwEnA/EW2uvcu1T48xjWGsfN8aMstZG5HOKmcAQ4BvX8K69cUYsvA04bq3tYowJApYYYxa6ptgVETdSC4CInCnEGLMGWAHsAaYAlwD/sdYmW2uTgDlAd2A90McY829jTHdr7fESnGc+0MtVyV8BLLbWpgD9gJtcMfwOhOKMqy8ibqYWABE5U8pf79hdkwjlYa3d6moduBJ40XWn/lxxTmKtTTXG/Aj0x2kJmHHqdMB91tpvz/YCRKR41AIgIkVZDAw0xlQ2xlTBmQXvZ2NMQ+CktfZj4GWgUz77ZhhjAgo47kycRwvdcSZ6wfXv3af2Mca0dp1TRNxMLQAiUihr7SpjzIecnt72PWvtamNMf+AlY0w2kIHzDP+vJgPrjDGrrLXD/7JuITAV+NJam37q2EBzYJWr5eEQMNCtFyQigF4DFBER8Ul6BCAiIuKDlACIiIj4ICUAIiIiPkgJgIiIiA9SAiAiIuKDlACIiIj4ICUAIiIiPuj/AWbj4QrJa5LMAAAAAElFTkSuQmCC\n",
"text/plain": [
""
]
},
"metadata": {
"needs_background": "light"
},
"output_type": "display_data"
}
],
"source": [
"# Plot the samples using columns 1 and 2 of the matrix\n",
"fig, ax = plt.subplots(figsize = (8, 8))\n",
"\n",
"colors = ['red', 'green'] # Define a color palete\n",
"\n",
"# Color base on sentiment\n",
"\n",
"ax.scatter(data.positive, data.negative, c=[colors[int(k)] for k in data.sentiment], s = 0.1, marker='*') # Plot a dot for tweet\n",
"\n",
"# Custom limits for this chart\n",
"plt.xlim(-200,40) \n",
"plt.ylim(-200,40)\n",
"\n",
"plt.xlabel(\"Positive\") # x-axis label\n",
"plt.ylabel(\"Negative\") # y-axis label\n",
"\n",
"data_pos = data[data.sentiment == 1] # Filter only the positive samples\n",
"data_neg = data[data.sentiment == 0] # Filter only the negative samples\n",
"\n",
"# Print confidence ellipses of 2 std\n",
"confidence_ellipse(data_pos.positive, data_pos.negative, ax, n_std=2, edgecolor='black', label=r'$2\\sigma$' )\n",
"confidence_ellipse(data_neg.positive, data_neg.negative, ax, n_std=2, edgecolor='orange')\n",
"\n",
"# Print confidence ellipses of 3 std\n",
"confidence_ellipse(data_pos.positive, data_pos.negative, ax, n_std=3, edgecolor='black', linestyle=':', label=r'$3\\sigma$')\n",
"confidence_ellipse(data_neg.positive, data_neg.negative, ax, n_std=3, edgecolor='orange', linestyle=':')\n",
"ax.legend()\n",
"\n",
"plt.show()"
]
},
{
"cell_type": "markdown",
"metadata": {},
"source": [
"In the next cell, we will modify the features of the samples with positive sentiment (1), in a way that the two distributions overlap. In this case, the Naïve Bayes method will produce a lower accuracy than with the original data."
]
},
{
"cell_type": "code",
"execution_count": 5,
"metadata": {},
"outputs": [],
"source": [
"data2 = data.copy() # Copy the whole data frame\n",
"\n",
"# The following 2 lines only modify the entries in the data frame where sentiment == 1\n",
"data2.negative[data.sentiment == 1] = data2.negative * 1.5 + 50 # Modifiy the negative attribute\n",
"data2.positive[data.sentiment == 1] = data2.positive / 1.5 - 50 # Modifiy the positive attribute "
]
},
{
"cell_type": "markdown",
"metadata": {},
"source": [
"Now let us plot the two distributions and the confidence ellipses"
]
},
{
"cell_type": "code",
"execution_count": 6,
"metadata": {},
"outputs": [
{
"data": {
"image/png": "iVBORw0KGgoAAAANSUhEUgAAAgAAAAHjCAYAAABVQKdLAAAABHNCSVQICAgIfAhkiAAAAAlwSFlzAAALEgAACxIB0t1+/AAAADl0RVh0U29mdHdhcmUAbWF0cGxvdGxpYiB2ZXJzaW9uIDMuMC4zLCBodHRwOi8vbWF0cGxvdGxpYi5vcmcvnQurowAAIABJREFUeJzsnXdYlMfWwH9LFxWwYEXFiIWoURF7w1hijSYxxiSW6GdiNF5vjN50Y4qaZrDGXmONsUVj72KJihV7wQYI0qTDsrvv98fI4uvSFhYpzu95eNg9O3N2XnMvZ+bMKRpFUZBIJBKJRPJ8YVXQC5BIJBKJRPLskRsAiUQikUieQ+QGQCKRSCSS5xC5AZBIJBKJ5DlEbgAkEolEInkOkRsAiUQikUieQ+QGQCKRSCSS5xC5AZBIJBKJ5DlEbgAkEolEInkOsSnoBeQ35cuXV9zd3Qt6GRKJpBCiKApxcXE4OTmp5KcDT2OVYEWThk1yrCs0NBStVkv16tVNviMpKQlHR0eLrFlSnFAADaREgQawK2sRradPn45QFMU1u3HFfgPg7u6Ov79/QS9DIpEUMhRF4cCBA/j4+GBlle4MNRgM1HmpDt9/8z3v9H8nx/oaNmzInDlzaNeunUrXvn376Ny5MxqNxqLrlxQDDnSHl36Act4WVavRaO7mZJy8ApBIJM8lkZGRLFiwwET++9rfufXwFgP6DcixrnPnzhEbG0ubNm1U8vDwcJYvX57ntUqKEanxcO5LMOihzWqLG39zkBsAiUTyXFKuXDnWrl2rOv0D/DXvL1ZOW2kiz4rly5czZMgQkzkVK1Zk5cqV8vQvAYMO4m6CjSOUrAGKHuzKFOiS5AZAIpE8d9y4cYNOnTqZyP38/AgODuatt97Ksa7U1FRWr17N4MGDVfLo6GjatGmDXq/P83olxYCIf+HSFNBYQe0RYG1X0Csq/jEAEolE8jQeHh4sW7bMRD5lyhQ+//xzbGxy/qdx586d1K5dGw8PD5XcxcWFJUuWYG1tndflSooyV2eATQnw+ABc22Q//hkiPQASieS54uHDh6xatcokWv/06dMEBASYnOTT0HynYdDGQSbyZcuWMWTIEJVMURTWr19PrVq1LLdwSdHizmpx31/tNaj+2KNUyK6C5AZAIpE8V8TExBATE2MinzJlCuPHj8fe3j7Tuf/e/1f1PjIykn379tG/f3+VPD4+nt27d5sVRyApJugSxO/425ASDiWrg51zwa4pEzSKohT0GvIVb29vRaYBSiQSgJSUFAATI3/58mU6duxIYGAgJUuWzLG+33//naNHj7J69WqVXFEUGfj3PKJ9BLtbQ/ezYJ35RjK/0Wg0pxVFyTa9QG5PJRLJc8Pu3bt5//33TeQN3m5Az4E9jcZfZ9DhONmRcw/OoflOw5wTczLUl5H7Pykpifr165OUlGT5B5AUTmKvw7XZYOcC3fwL1PibgwwClEgkzw29e/ema9euKllgYCDKDYUG0xoYZVZYkaRLwlZjC0BofKiJrsuXLxMSEkLnzp1V8hIlSrB3715KlCiRD08gKVTok0GXKNL50lL6bIpOxUd5BSCRSJ4L9u7dy4MHDxg0SB3IN3LkSMqWLcvkyZPN0vfZZ5+h0Wj46aefVPKlS5cyYMAAuQF4HrjiCyjgOa6gV6Iip1cA0gMgkUieC9zc3Ezq8YeFhbF27VquXr1qli69Xs/KlSvZu3evSp6amkpAQIDJJkNSzLgwEdz6Qr2PRV5/EUVuACQSSbEnKCiIihUrUq9ePZV81qxZDBgwgIoVK5qlb8+ePbi5ueHp6amSazQafH1987xeSSEl+jyUaQSVOotqfkXY+IMMApRIJM8BW7duZcWKFSpZXFwck30n021wN7P1pZX+fRK9Xo+npydRUVF5WqukkGLQwdn/QXIEVGgH9pbp3FeQyBgAiUTyXOLr68tfu/9i/9b9lLDN+X19dHQ0NWvWJDAwkLJl1UYgJiYGZ+fCmfMtySUJd+H0WGi3odAV8skMmQYokUgkwHfffcfmzZtVMq1Wy7Rp05g1aZZZxh/gzz//pGvXribGf/bs2RgMhjyvV1JISA6HSH9wrA4Nvi4yxt8c5AZAIpEUa4YNG0arVq1UsjVr1lC3bl2abWvGzps7zdK3dOlShg4dqpIpikJ0dLRJkKGkiKIoEHMRwvYLw1/Wq6BXlC/IKwCJRFJsOXToEB4eHlStWtUom3p0KpMGTOKvJX/h1tgNj7Ie2Frb5kjf5cuX6dKlC/fu3VM1+UlISDCrgqCkEHPpR7B3BY/hBb2SXCOvACQSyXPPyZMnCQ1VF/F5cPoB9vb2dO7cGU9XT5Xxn+8/nyEbh7DqwqoM9S1dupTBgwerjL+iKLRq1Yp79+7lz0NIng0P9ojmPTWHgPvbBb2aZ4L0AEgkkmKJTqfLsK1vu3bt+OijjxgwYIDJZ17zvTgbehYAZaL6b2NqairVq1fn0KFD1KlTR/VZSkpKlk2EJIUYRRFu/nNfgvu74FK/oFeUZ6QHQCKRPNf07NmTpzf/M/6aQVBwEP369ctwzhuebwDgYO1g8tnOnTt54YUXTIz/1KlTiYiIsNCqJc8UvRZ2tYCUKGg8pVgYf3OQGwCJRFIsWbduHV5e6uCtjyd8TOd3O2foGWi/tD1fH/gagGR9Mm6/uqk+X7p0Ke+9957JvFKlSuHi4mK5hUvyH30yBP8D1nbQdl2xyOkHhDfjoV+Oh8sNgEQiKXZMmzaNpKQkrKzS/8RdvnyZCtEVmPHFDJPxv5/8Hb976j+cU7tPNb4ODw9n//79vPXWW6oxYWFhjBgxQgYAFiUUBVLjIHgbKAYo5V7QK7IcqTFwbXqOh8sNgEQiKVYoioJGo8HJyUklnzp1KqNHj84wVW/WyVkANKrQCGWigjJRYUCD9BiBVatW0bt3bxOd/fr14/r16/nwFJJ8IewgnBgGDq7QfG6RL+WrIuo0WDuKgkU5RPYCkEgkxYrQ0FA+/vhjlez89fNs3ryZmzdvmowPig3idvRtMe7heaYdmcbYtmONnyuKwtKlS5k2bZrJ3EOHDqm8DJJCStwt4fYv3xpK1Sro1eQPN+ZDnY9Er4IcIv+XK5FIig06nY6uXbsSHR1tlJ0OOU3j9xozePBgk+p9J4JOUG1aNbQGrVG24br6BHX27FliY2Px8fFRyb/44gvu3r1r+YeQWI60LLfIUxB9Vtz5l6xWsGuyNEkPIDEIWiwwy/iD9ABIJJJihI2NDefPn1edyms51qLM1TJ8svYT1dhhfw9j6bmlJjqSUpNU75cuXcqQIUNMTvre3t5UqlTJgquXWJzT/4XK3cDdNOWz2BC6F1IiRWtiM5EeAIlEUixISUlhwIABpKamquRz586lV69eVK9eXSV/0viXtisNgKujK75d09v5Jicns2bNGpPOf9evX6dv376UKGFeHwHJMyJ0n+jeV2+saN1bHFEM8CgAag7KlfEHuQGQSCTFBCsrK4YOHaoqyDNy80hmzJzB//73P6PMoBiITYnF1dHVKIvTxgEQnhhOh5odjPLNmzfTpEkTatasqfqu8ePHZxhPICkEKArcWyfc4qVqCrd/cSTuJgR8m37NkQvkBkAikRR5FEXh2LFjdO3aVSWft3gedRvUpWHDhsZx1t9b88OhHwhPDM9W78KFCxk+3LQm/JYtW6hbt65lFi+xDKnxsLcD6JOg+fzild73NFGnoXTtPLcolhsAiURS5AkLC2PevHkqmU6nw+OqBz9M+MEos/pe/MnbdHWTiY6+dfuqyv/eunWLCxcu0LdvX9W4Dz74QKb+FSb0KRB+FGxLgfccsCnmHRn1Wjg/AbRReVYlNwASiaTIU7FiRdasWYPm8Wno450fY/uOLeXLl6ddu3bGcZ5lPQG4FX3LRMf0V9QFVJYsWcLAgQNNavwPGjSIGjVqWPoRJLklMQhuLRGu8OJeyjfqDCh66Lgd7MvlWZ3cAEgkkiLNpUuX6NWrl0r2bYdvqX+9PuPGjzNuCgC+aP9FpnocrdNPjjqdjqVLl5q4/0+ePImXl5ds/FMYCNkFZz+D0rWg5eI8ucKLDIHLIOaixdTJDYBEIinSvPjii8yZM0clO/vvWa6GXGXwlcEq+aBGg1jRdwVjW6QX+nEtIYIBPed4GmXbt2/H3d2d+vXVJ8p58+aZtBeWPGNSoiAxBFxbgcf7Bb2aZ0N8IMTfBu+ZUK6ZxdTKOgASiaTIEhISwtGjR3nzzTdV8m8nf8usSbMY/J56AxCvjWfQ5kEqWXiSCAaMTIk0yhYtWpRh8N+SJUsstXRJbrmzEqzsoPaHYOuU/fjiQPgxMGhFVoMFkR4AiURSZImJiSEyMlIlO3fuHIdPHsbBy4FSP5bKVoejjaOx/j9AcHAwfn5+9O/fXzXuzTff5NKlS5ZbvMQ8rs2Eh0eg7hhh/J8HUuNE/4KaA6HWMIurlxsAiURSpDAoBkAU/vHw8ODDD9XG4JdffqHz251pXbM1b9VP79739b6vIb3iL6O8R5H0VRIJXyWo5i9fvpz+/ftTqpR68zBp0iTq1Klj4aeRZEtKlAjwK+NVvFP7MiL+NjzYlW/q5QZAIpEUKay/t2bxmcVs3bqVjz76SPXZ3tN7WbN5DXvL7uVU0CnW9lsLQLIumclHJlP6t9LGsXP857AvcJ9qvsFgyND9v3v3blxdXbG1tc2np5JkyrF3IfoMVGgLjm4FvZpng2KAe+vBpSE0/jHfvkbGAEgkkiLF7f/epkrpKth52dG7d2/VZ1v+2EKvAb3Y+uNWlfytv9I9AU72TsSmxHLjPzfwKOuhGnfgwAGcnJzw9vZWyffs2UPdunVNmglJ8gmDXvS1r/MRtP+7+Fbzy4zUOAjbD1V7g3X+ZZxID4BEIilSuLu443fQjzVr1qjS8R49esTKFSuZ+/1cADTfaRixdQQAW65vMY6LTYkFQGfQmehOO/0/mTqoKAq//vqrzP1/Vhh0oLECFFHV73kz/vfWg8Yams3JV+MP0gMgkUiKIJUqVcLBwUElW7RoET169MDNTbiJL3x4gapOVYlIjMhQR0xSjOp9REQEO3bsMEkp7NatG7/88guNGpnXalWSC7QxsLcdvHISPMfn//fpkiDiGIQdED+J98HaAWxKgvtA0UxI8wzPyYoiyvyWbyUqG+YzGiUPjQSKAt7e3oq/v39BL0MikViI0NBQHB0dcXJKTwFLTU2lVq1abN68GS8vL6M8KDaIatMy7v/+ZNlfgOnTp+Pv78/KlStV8vDwcMqWLYu1tbUFn0KiQpcEDw9BlW6Q/BAcKuTfdykG0UL3xjwI3Q0uL0HFjlDBB5zqgD4ZUiLgzCdQrR+8+L9sVVqE4G2ivr9T3gNNNRrNaUVRvLMbJ68AJBJJkWLz5s0sWLBAJVu/fj21atVSGX8ABxsHyjiUMdHR06Mndx/dNb5XFIVFixbx/vvqwjLr1q0jNTVVGv/8RhsJwf+IE3B+Gf/kh3D5Z9haG859BpVfgb7B0PUYNJoMlbtAyRrgVBdc24CXL9xdnT9ryYiUSNDFPbvvQ14BSCSSIsbTaX+KouDr68s333wDwI3IG9RwqcHIf0ay5Jxp4Z521dux49YO7sbcpYaLuNc/ceIEKSkptG/fXjX29u3btG3bNp+eRMLDI8LINpsDzWbnz3fEB8LFSXB/I1R7HVqvEdX0sisdbOsiiu/kN+HHIDkMXhic/VgLIzcAEomkyDB9+nSqVavGG2+8YZT5+fkRGxtLz549CY4Nps7sOtQrV4+rkVfp9UIv/gn8R6XjdvRtDIqB9jXSjX1a298ng/9SUlL47LPP8v+hnkdSY0EbDWWbgn35/PmOhHuPDf8GqDMa+twGO1NvUKbEB4K9a/6s7UmsS4iYgwJAXgFIJJIiQ58+fWjWTF0L3dfXl7Fjx2JlZUVVp6r4DfXjeuR1KpeqbGL8AYLiggDQ6sXpLjY2lo0bNzJkyBDVuJ49eyLjh/KJ+5vg7p9gUwKc61lWd2IwnPoIdjQRm4ve1+Gl78wz/gB310D1/tmPyy2xN8QGpWwTqNw1/74nC6QHQCKRFAnOnDlDpUqVqFKlilF248YNjh07xurV6Xe1zas2x4CBB/EPMtUVOCYQu8fpZX/++ScdO3akUqVKqjFbt26VXf8sza3F4FAZXhiS/VhzSQoVd/y3l8MLw6DXldzHE6TGQ8g2aDrDsmt8EvtyotBPASI9ABKJpEhw+PBhLl5Ut0KdPn06I0aMwNFRtPJVFMVo2Ms6ZF6058CdA8bXGVX+mz9/PqGhoVhZyT+RFiElSkTfu7wEzp7ZjzeH5Ag4+ylse1F8R89L4DU1b8GEd9eAa1twyIcrgJRIOP4e2JYGtz6W128G0gMgkUgKPYqi8PHHH6tkkZGRrFmzhsuXLxtlVt9b0bWWcKdGJUepxtthhxYttla2DGsiGqtcuHCBkJAQXnnlFdVYGxsbSpYsmHvZYsmpD6H2KKjoYzmdhlS4NgMu/Shc9T0uWKZUcGo8BHwL7TblXVdG2JWBGgPAquDLSsvtrUQiKfS899577NmzRyWbP38+ffv2VbnurTXWXAy7+PR0ALSPOwH9O/xfo2zRokUMGzZMleYXGRnJsGHDqFAhH3PRnwcUBa74ioC/1qssa/wfHoEdXvBgD3T9F5rPtVyfgCu/ipoA5ZtbRl8aBh0c7A3J4aLeQSFAegAkEkmhZ9q0aarKf8nJyXz141fs3rXbKNMb9OgVPSHxIZnqqVaqGl6VRa2ApKQkVq9ebRLoN2TIEL766itatWpl4ad4jjCkihOulR3oU8DWKfs5OSE5As59Cg92izz96m9mn85nDonBcH02dD9jOZ0gNkNWNtBwYv4WOTIT6QGQSCSFmnXr1hEfH2+85wcRuFfphUq0bNqS1QEiAHDLtS2ZqTByP/4+VyOuArBx40aaNm2Ku7u7asyWLVto2bKl5R7geUOXJE7nqbFQd7Rl7tEVA9xcBNvri81Er8tQo79ljT/A+S/B4wNREMiSHB0AESehnLfl15wH5AZAIpEUakJDQ3myZHla4Z9lvyzjQtgF3t34LvHaeBxsHLLQAiGfhBD7eSyev3viH+zPt77fmlT+++mnn7h27ZqqHoAkh+hTIGirSO3rdMByp/7oC7CnLdxaBD47oel0y+l+kuB/4OFhqP+F5XQaUsXpv/HPwvgXMuQVgEQiKbTEx8czZswYlWzfvn1oU7W07diWknYljTX9u9fujrO9MzEpMSZ61vVbR+XSlRn2twj+235iOzev3eTVV19VjfP09JR3/7klNU6kzlXpAQ4WKO6TGieC8W6vgEaToNbw/GvMkxwBJz8QVQItubk4/7XIenjhPcvptCDSAyCRSAot3bt3JyAgQCXz9fXlau2r9FjdQyVP1admaPwBXqv3GgAzu8/k3sf3SDqVxLgPx2Fnl95q9vbt2/Ts2ZNy5cpZ+CmKOVFn4dhgYfSbzwOrPPZNUBTREnfbiyJlrudF4ZbPL+OvKCJLocY7ULGDZXQadKBLgAZfgfu7ltGZD0gPgEQiKbTs3btXZaQvX77M2bNnSbqdpAoKvB19mxdmvpCpniRdEqWtS1PKrhT2GnuWLVvG/v37VWMmTJjAqFGjaN26teUfpDiiS4CkB+DSAOp/bhmdcbfAfzQk3hOZAxXaZz8nr9xZBbHXoPXK7MfmWOdKiLkETX61nM58QHoAJBJJoWTChAlERUWp7uOnTZvGqFGjjMb/YcJDErQJDP17aKZ6enj0oLR9aeP7bdu24eHhgaenuiDNypUrpfE3h9C9ELhMRPs7v5g3XfoUCPgBdrcQ6YLdzj4b459wX7T9bb0CrLOOIckRigKJIVBzCLz0Q9715TPSAyCRSAodiqLg4eGhcseHhYWxfv16rl+/bpRVnFoR7yre+IdkXLP/ZfeX2fbuNpUso8p/n332GW+//TaNGze24FMUU+6sAY21iMK3RCW70H1wapS4K+922vIR+Jmh14ro/HqfQBkL/XeP8odLU6D9JstsKPIZzZPRtcURb29vRTb0kEiKFtevX6d27dqq0/+3335LaGgo8+bNA+Bk8EnKOJShzuw6Weoa1mQYi19dDMDdu3fx8vLi3r17qkp/R48epUGDBjg7O+fD0xQTdIkirz/2CljZg1PW/+7ZkhwBp/8LEUeh6Sxw622ZdeYU/zGQcAfab7ZMfMGji+I6xKDPexxEHtFoNKcVRck27UBeAUgkkkKFXq/nvffeIyoqvZRvUlISc+fOVZUDbrGoBb8e+5XKpSpnqKd8CRGJPr7VeKNs0aJFDBw4UGX8z58/T6NGjaTxz45zn4ngPJeGeTf+9zfB9oZQopKo3f+sjf/tVRCyHVr9YRnjnxQGZ8aK4L8CNv7mIDcAEomkUGFtbc2xY8dU7v+VK1fSrFkzPP/05H+7/weAMlEhODY4065/EUkRbB2wFU9XcdefmprK4sWLGTFihGrc4sWLuXLlSj49TTEg+B9RvrbJr1DjrbzpSomCYwNF855268HrN7B5xj0XHgXAmY+h3Uawc8m7vtB9orpfx92i2l8RQm4AJBJJoUGr1dKrVy8SEhKMMoPBgK+vL+PGjcP/fX/e93ofzXca/r3/L9tvbs9SX6tq6eV8t2zZQu3atXnxRXXA2syZM2nWrJllH6Q4EXsVkkPFnXZeCiQFb4PtL4FdOehxDlzbWG6NOUUbA4dfB69pUOalvOvTa0WLY21Uoarwl1PkBkAikRQabGxs+OKLL1Qu+p07d+Lg4ICPjw9NqzTFo5wHvl19abUk81r97zd5n5K2JemyootRNm/ePD788EPVuBEjRnDixAnLP0hx4MgAiLkCnuPz1rdeGwP/DgP//4hUO+8Zz/7UD6Kc8L9DRCOemgPzri9wGRiSoc1qsC+atSOKlr9CIpEUWxRFYefOnSatedNO/2kBga+tfY0t10XdfyuNFQbFoBpfwroE7770LqNbjMbq8f3ujRs3OH/+PK+//rpq7Pjx46lcOeMYgueW+NtQqibU/xJK5/Gu/8FuODEcqvQU7XptS1lmjbkh4HtIfght1uVdl6KIxkG6xPwpS/yMkB4AiURSKIiJiWH16tWqyP9z585x9epV+vfvb5T9X5P/o1HFRnzZ5ksT4w+QpE/CZ7kPL1V8iQYVGgCwYMEChg4dir29vXHcgYMHcHFxoVSpAjRKhQ2DHo4PFrnsZV7KfUBbahyc/BBOvA8tFot2vQVp/G+vhNvLod0msLbLfnxWXP5FZEI0+EoEMRZh5AZAIpEUCpydnVm5ciVWVul/lqZNm8Z//vMf7OzsmHViFh2WdqDPn30Ijg1mytEpGeoZ0GCAsT8AiNbBy5cv54MPPjDKHiU/4uVvX+bOvTv59jxFCn0yXJwEGKDzYXCskntdD/1geyPRCKfHBajcJfs5+cnDw6LYj882KFEx7/qcPMHeAh0OCwFyAyCRSAqcBw8e0KxZM1XXv5CQELZu3Wo03JVKVeLwvcNYaayISIpQza9cUrjx3Uq78WtndfnVDRs20KRJE2rVqmWUOds7E7I1hGZNZfCfyFu3A5tSoOhzH8ymT4Gzn8HRt8B7JrRcDHYFnFoZew2OvCnu6fNarfDiJJER4dbbMi2OCwFyAyCRSAqcypUr8/fff6vc/7Nnz+bdd9+lTJkyANg8TrEyKAbaVWunmh+XEgdAUFwQXVd2pc2S9AjzjIL/3nnnHW6eu5kvz1KkSA6HXc2F4a/3ce6r10VfEHribkD381C1l2XXmRuSI+BgT2g0BSp1zr0eRRE/1d4omMyFfKTIBQFqNJpuwAzAGlikKMpPBbwkiUSSB+Lj41mxYgUjR440yhISEli4cCH//vsvABGJEUQmRmKNNZ+3/ZzJRyardejiAbFJ+M7nO8o7iiJAFy9eJDAwkF691AZp1qxZqkyD5w6DTpStLd8SfP4R9fxzpUcPV33hyi/QZCrUHFw40uH0yeDXF6q/CbX+L2+6rk0XGwDPTyyztkJEkdoAaDQaa+B3oAsQBJzSaDRbFEW5XLArk0gkuSUmJoakpCSVbNmyZdRsVJNj8ceoRS1GbRvFX5f/YmzLsSbG3620G0FxQQDoDDr6vdjP6EmYN28ew4cPx9Y23cBt27aNBg0aUL68BXrWF1US78P12VCuBZTIZRZE/B0RMKjRwCunoJS7JVeYexRFpB2WqAKNJmc/PlM9BhHl/8KwwrGpyQeK2hVAc+CmoiiBiqJogbWABbpRSCSSgsBgMODi4sInn3yCVq/F6UcnYpNimTZtGtfrXmfw5sEArHtzHcpEhe03TAv/hMSHqN6P2z0OEJ6F1atXmzT+uXXrFomJifn0RIWcRxfh/ASR5td6Ze4Mm6KIHPhdzcDtVXh5/7Mx/oGB4ruzI2CiSGVsuTxvZX7v/gnnvxRxDEU41S8ritoGoCpw/4n3QY9lKjQazQcajcZfo9H4h4eHP7PFSSQS8zhz5gx9+/YFwNbKFiuNFbt37KZcuXIE+QYR9anoB6AoCl/t+8oY7Pckugk6fu78MwD1XesztetUANauXUu7du2oVq2acaxWq2XMmDEmrYCLPYoiUvNK1oAK7bIfnxnJ4eD3OlydBi/vE0WCnlXt+1q1YNu2rMcELhcpfx3+BpsSufseg15sIGoMgMY/505HEaGobQAy2q6abAkVRVmgKIq3oijerq7FI1pTIimOeHt7s+3xH3WNRsOjzx/xzZRvOFXjFKXsS1GmhAgAXHJ2CVOOTOHgvYMmOqy+t+JR0iMALoVfwkpjhd6gzzD4r3///hw6dCh/H6owErQZzowD29JQuWvudARvgx2NRHGgV05appSuOSgK9MoiuDDsAJz7VKT7OVTI/fdEnoAL3wjvSG43EUWEIhUDgDjxV3vivRsQkslYiURSiLl06RI7d+5k3LhxRtmpU6eIfRiL0kPB764f7WqI0+rwrcMzUwPAj0d/BGBOjznEJMfgMsaFGpE16NpVbezWrFmjigco9sReA+0jcOsDVbrnTodeKzoB3t8ArddAxQ6WXaMliLkKRweI9Tnn0rtjSIXwo1DRB8pnXma6OFHUNgCngNoajaYmEAwMAN4p2CVJJJLc4OTkRP369VXsujpYAAAgAElEQVQyX19fxo0dR49BPfAo6wGA5rus76nTygE/WfznzaQ3afJBE6yt093TixcvpkOHDnh4eFjwKQo58YGiA1/5FrlL8Yu7KQyroxt0Pwf2Zc3XodHAzZvChZ8fJAbDwR7Q6Ceo9HIe9ATBnZVQoUOxDfp7miK1AVAURafRaEYDuxBpgEsURblUwMuSSCRm8ujRI2xtbenWrZtRdu/ePXbv3s38+fNxckoPuhrfajyXwy9n2vkvrRywQTFgUAzEx8az5589zJo6SzXO2toaR0fHfHiaQsi1maKwT61huddxZw2cHgMNvoE6o/NmFD08chbAZy7JEbC/C9T+EGoNzZ0OfQoELgWPD6DFIsuur5CjUfLjP0ohwtvbW/H39y/oZUgkkifYsWMHO3bsYObMmUbZ+PHj0ev12PWw46fOPxlT+TLzAGjQULlUZYLHBROvjeeXo7/ww+EfmFVuFn5+fvz555/GsZGRkZQtW1ZVaKhYkhQKts6QHCbu+3PTpU6XAP5jINwP2vwJZZtYfp2WIDUW9nUSRX4a/5gHPXFwZSo0+Dr39RAKGRqN5rSiKN7ZjpMbAIlEUtDExsZSs2ZN9h/bT+O1jdFN0GFtZc3dR3dxn+FO+RLliUiKwNbKllRDqmpu8CfBVCldhRRdCtFJ0XRu1ZlZs2bRsWNH45jevXvz5Zdf0qpVMb/b9f8PVOoi0vNyw6MAOPIWlPWGZr+LTURhRJ8MB7qDU11oNjd33gl9ikjzazix2KX55XQDUKSuACQSSdHnr7/+IigoiLFjxxplixcvpkuXLjSq24jt72xn0ZlFDPcazp1HdwCMtf+fNv6Oto6cCj5FeGI4O2/u5K3Sb5GamoqPj49q3NNlhosdN+ZBlR7QdEbuct8VBW7OhwsToMlv8MJgy6xr2zbo2dMyutIwpIpNikNF8P4991cTVnZQpjFYPyfXQhkgNwASieSZ4uPjQ2RkpPG9TqdjxowZrFsn+rRP8ZvCkftHcHZwZnXA6ix1KYpCTZeaLDi9gO03txN6KpQPP/xQZey///57ur7alZaNW+bPAxUkBr3Iw7cpKSrX5cb4ax+Jtr1xN6DLEXGqtgTvvANr1lj27l8xiCp/hlRo+1fuahAoChx9Gxr/BDUHWW5tRRC5AZBIJM+Ma9euAVCvXj2jbOPGjVSrVo3mzZtT/pfyRCaJzcHbG96mhLVpHraznTMx2hjGtxqPrbUtNVxqsP3mdoJGBFF/Wn22/LFFNf6Fei/Q6s9WpDRMwS6vveALE4oCB7qKU3BuDVnEv8IYVu0FrVfkvhlQRixfDnPnWk6fosDp/0LCHei4C3Lz3zJtw1RvLDhWy358MaeoFQKSSCRFmICAAI4fP258rygKv/32m7EWwNI+Szk45CC/d/sdgCR9komOGG0MAMOaDOPHIz/i7OCMMlFhzco19OnTh7Jl01PVbty4wYDXB6D8qBQv4x/++N+w1Qpwrpf12IxQDHD5FzjcB7ymgfcsyxp/AFtbcM6kHfCECWBvb56+gIkQfgQ6bAWbXLrtjw4Q/3blWzy7CoaFGOkBkEgkzwRFUejXr59KduzYMSIjI+nduzezTsxi09VN3Ii8YWzuk1HQXxqerp7G3H+DwcD8+fP5448/VGO+/PJLvvnmGxo2bJgPT1RAGHRw5VcR/OZYxfz5SWGiiY8+QTTxKVnd8mvMjiFDwJxyzFd8RW3+Ln5g52L+96XGiWuSptNz3/yoGCI9ABKJ5JkwceJEFi5cqJL5+voyduxYrK2tqV2uNk0rN+X+J+ntPjIz/seGHQOg/dL2HL57mP379+Po6EjLlup7/r/++qv4GH9dApwcIe6/22+EEhXN1xG6F3Z6Qblm0OmgecZfo4GpU0GvhwYNxO/evcHLy/x1eHiIGIGccGM+XJ8JL+/JfYnftEqGjlXz1iComCHTACUSyTMhKSmJ5ORkypQR9f1v3bpFixYtuHv3LiVLlgTSc/4nd5zMVwe+AsDe2p4UfYpRz+CXBvPHhT9QJirYfm+LTtHxRsAbdOrUiZEjRxrHDR8+nE8//ZQ6deo8q0fMP1LjxQn2/kao9pr5RsygEy70wGXQ6g+o1Mn8NaQFVnp6wpUr6s/MsSP160OjRrA66wBPAAL/gAtfic1K6VxUEkyOEK5+KwdxxVGcM0GeQKYBSiSSQsPOnTupXLkyjRo1MspmzJjB+++/bzT+AOvfXM+um7uYfXI2VlhhwKAy/u7O7tQrV4+fO4kubanfpBISEkL9+vVZsmSJ6juHDRuGu7t7/j7YsyApTAT7dTsN1d8wf37CPRHoZ1saup0x33PwtNF82viby88/Q+UcuOHv/QXnPxddB3Nj/AFuLwfrElBnVO7mF3OkL0QikeQ7cXFxpKSkG/LY2FhWrlzJhyM/RGfQGeVvvPgGrau35kHCA+q71jfRcyfmDkeCjvBp20+NsiVLltC/f39V+eCjR4/SqFEj7OyKcOBfahwE/S0MdtfjYJWL89r9TbCrGbj1BZ/tubs2cHKCVzMpLGRtnf3pX1Fg37709716QdOmWc8J2gr+o8FnR+6a+ySFQvR5qPcJ1B6Z/fjnFLkBkEgk+UpcXBz9+vWjefPmRtmyZcvo0qULzdc1p8zPZYzyeG08NZxr0LpaawLCA0x03fv4HttvbCcuJQ4AvV7PggULTNr+Llq0SFVroEiSGiO60ymK+VHv+mQ4NRrOfAJh70KNUeZdG+j14uT/558QGwtbtpiO2bIFdDpT+dPcvQudO+f8muDBHjjxf9DhHyjTKPvxGRF1BkL3iWd4Ttz+uUFeAUgkknxlzJgx9OnTh759+wIiYn/WrFksW7aMJc2WoKBwKvgUjSs1pvSP6aVnrTXW6BW9StfewL287P4ype3FuB07dlClShWaNFHXq1+6dGk+P1U+En1BVOVr9js0+cX8+bHXRKW80rWh+1mwLwPeb0OzZjnXYTCIk//kyRl/7uICLVrkTJe7e86N/8PDcOxdaLdRBCqaS2IQRByH6m9C1R7mz3/OkBsAiUSSryxevBiDwWB8v2rjKhxKOtC6dWs0Gg2JqYk0X9TcZN6Txr+MfRkepTzi56M/Y/XESXbevHkmp/+uXbsyd+5cauVX+9n8QlHEqd+pDtTMZSnewD/g7Dh4aZLobqfRmF+Jb9cuSOvSGGDqhQFEFH+FXEbkZ0bECfDrB23WQIW2udOhS4TkcMuuqxgjswAkEkm+MXPmTHx8fHjppZeMMuf6ziR7JpOyPoX2S9rjd9+PDjU6cOz+sUzT/tJIy/sHuHv3Lk2bNuXevXuqNr+3bt2iZs2aWFkVsRvO0H1wcyG0XWv+XH3y4w5+h0WJXJc8pD6WKAHJyVmPqVwZQkJy/x1PE30ODrwCLZbm7uQefwduLoBGk6XLn5xnARSx/4dIJJKiRM2aNSlfvrzx/dWrV3GIcCBmpajm92odEVx28eFFUg2ptKpq2q3P3dkdgK/bfc3Qzek93xcuXMjAgQNVxn/Dhg2UK1euaBn/xBDh+q74MrRabv78hLuwpy1oo+GVk3kz/pC18b91C1JTLWv8H10Snf285+TO+CsKOLiKKwNp/M1CXgFIJJJ84fbt2/To0QNr6/SSq7Nnz+aDDz7AwcGBGtNrGN35afX/jwcfN9EzocMEvCp7cSX8CqdCTgGg+UaD6yJXDh04ZByn+VbDq3depVOnXOS4FyQJdyHqNFRoD9ZmlscN2QX/DgHPT0V9+/w0gN27wwsvWFZn9AU42A28fHOX4hh/B06NBJ9toj6CxCyK0DZZIpEUJb7++mtOnjxpfB8TE8Pq1auNd/YDGw7kzqM71HCuAUC1UqbNWeqUqcP/bfk/GldqzNsN32bnwJ0AtEtqR506dfB8opys33t+rF24FheXXJSKLQiCt8GVqeDaShhvc1AMEPA9nBgGbdeB5yfmG3+tFr75Rrj8R4yAEyfgqWBKANavF7/ffjt7nf/3fzkv8Zvm9veaDu450P00qfFQsgZ4/Sar++US+a8mkUjyhVWrVtGqVbpLf+nSpbzyyitUrVoVgDEtxtCiagvuxtxlTo853I+/r5o/0nsk16Ov83HLj0102521Y/So0cb3iqLwUZ+PiAiNyKensSAGnSjrW9YLKnc3f35KFBzsBaF7oJu/8ByYi04nmvH88INw+S9eLFL1zp1LH9O8ORw9Cm+8Iar3ubllr/f4cXjc8TFLok4L4+89G2r0N3/9yQ9hTxtQ9OD8ovnzJYDcAEgkknxg5MiRXL161fher9cza9YsxowZY5TdjLrJZ20+48CQA0w9NtVEx/7A/QC0qNoCzXca+qzpA8D169cJCAjgtdfSXb4ajYaDBw9SrVoRaPF6Yw5c+U00pXExLXaUJVFnYKc3ONWDTvvNb2yj0YhTvq2tKMdb/XEvAL1e3O137CjeW1nBgwfQurV4f/Fi+mcg7t1few3i48VrNzeIiIDLl0UKYVZEnISDPaD5gty5/WMui54AXY/lrjiSxIjcAEgkEoszcOBAVRneHTt2UK5cOVWznlUBq/h076csPbuUwEeBJjquRV3jI++POBF0AoCZ3WcCsGDBAoYOHYr9E+1kZ86cSaHPaIq5DDFXweNDqP9l1mNTU+Hp7KVbi8WpufFP0NQXrGzVn585k/E1QFiYkBsMsHVr+in//Hm4dy99XEoKHDggXhsM6s8yYvNmSEgQurPLGkgj/Dgc6gUtloBbn5zNeZLUWDg1CnRJojeCJE/I7ZNEIrEoR44cwcvLCweH9P7yM2fOZMyYMWieMFBzes5B852Gm1E3TXR4lPHgZvRNHG0d+fX4r/St25caLjVITk5m+fLlnDhxwjhWURQSEhJUPQUKJZH+YFsKnOtlP3bnTlF+V1Eep/iNFlUBOx/OvDRu+fIwdKip3MUF7Ozgyy9FHf6sKFcOEhPFBuDwYejQQXgHns6qeLq+QEQOrl4e+oHfG9BqBVR5JfvxT6IocGe1iBXodEBG+1sI6QGQSCQWZeHChURFRRnfX758mYCAAN58802jLF4bzy9Hf8HJzikjFdyMvskvnX/h1+O/ArDhrQ0ArF+/nqZNm/LCE9HosbGxfPHFFyqPQKHi2mwI2gIvDIZqr+dsTu/ewujF34HdbcTJ95WTWdfFr14dnmqIhF4vDPo332Rv/H19ITJStPwNDxcR//Xrmxr/3BB2UBj/NqvNN/4ABi1EnQJdvDT+FkRuACQSicVQFIXly5fj9jhgTPOdhkGfD8Krlxd6q/TKfudDz/PZ3s+I1cZmqiutKNDrnq8b0wXnzZvHoGGDuBcj3NMGg4FWrVrxIPRBfj1S7tElimj9Cu2gbLY1WUwJ2QG7W0DNgdDmT9HN72mGDxcGWzUvBBo2hAULwMYGypaFr7/O/HusrYWeoUPhv/+Fjz4S1wRubuLuP6+E7oMj/UW2QqXO5s016ODs/0CfCE2ng23GG0ZJ7pAbAIlEYhEURaF9+/YEBQUZZRtf3UjgkUC2O2/n7IOzBIQF0HZJW9ouTS/16mTnhFvp9Ajz6k7VeTj+IaXtSuNV2Yslr4pTbUBAAHfu3GErW6kxXaQOWllZ8fOGn6kyv8ozekozOPOJ6MZXphE4mrE+xQAXvoUTw6Ht+qzz+52dhdv+SRITRQDf99+L9717Z/19ej0sWiSuCqZPF56Hdu3SP88uqC8rQnaJVsTtNkBFH/Pna6zBpRFYm9kMSZIj5AZAIpFYBI1Gwx9//GFM8wO4feA2PXv0hNJw+9Ftjt4/yukHp1XzYrWxBMWJTYOroyvtqrWjwtQKlLYvTRmHMjg7OAMwf/58hg8fztr+a1EmKiiKwrhx42jp2pJ7H2cTsPYseXhEVOXz8s25yz+NlEg42BPC9j9O8WuX9fjffjO99/fwEHfywcHi/datOfvuPhkE5R06JDwEuSF4OxwfBO03Z/8cT6MocOhVSLgjPCDmFkiS5Ai5AZBIJBZhxYoVlC9f3hjop9frmT17NqM+GkXil4m82/BdRm4baSz/C1D6Kbd2vDaeLh5dAHiv8XvsHbxXyOPjWb16NcOHDzeONRgMNGzYkHJly1HNuRCl/4Xtg9gbooWvOffVUadFip9zfei0z7wUv+hoGDhQvF6xQvzkFK1WrLN7BjUJ2rYV5X/NJWgLnBgKHbaCa2vz5uqSxHoaTYaS7uZ/tyTHyA2ARCLJM3q9nrNnz2Jra4uiiNP5tm3bqFChAh+e+xDHKY5oNBoeffaIdZfX4WwnTvVxqXEqPUm6JPrU68OkjpNwn+7Ohssi+G/NmjW0b9/eGFsAcOfOHYYMGVJ46v6f/UzUtW84EcqbdjfMkpuL4EA3aPIreE01TfHLjrAwWLVKvN6zB7ZsyXrzkdbK9++/xQbAYICnuioC4vRvbvnf+5vg5PvQYRuUz2HL4Cc51AseBYieBjLgL1+RaYASiSTP6HQ6fH19Aag2rRpJqUk02tWIMWPG0H9Af1ZdWEWyLhn/EJHbHqONyVDPG55v4OLgwlftvyIsIQx3F3cURWHu3LlMmTJF9X1vv/02u3btokyZMvn/gFmhSxSn/SrdoGR1M+cmiRS/iOPQ2S/rFMG33wZHR1G172nq1RO1A/T6nJ3+0wL+SpeGUqXMbxmcGff+El0JfXZC2QzKCmdF3C1R2rf9Jhns94woJFtniURSVElNTeXFF18kNlZE9J8dcZaNPhsJuBRA++7tsbGy4b2/3+NC2AWCY4Pp9kK3THVtuCJO/N1WdmPWyVk0qdQEf39/oqOj6dq1q3GcjY0NJ0+eLHjjD6Kq3aOLULFjxpH6mREfKMrZ6hIep/hlUx+ga1dRrjcjfH1Fdb+cGvJJk6BvX/DxgZiMN2Nmc2eNMP4dd5lv/AECvoUof2n8nyFyAyCRSPKEra0t58+fx8lJ/OEu71ieVYtXEe4Zzvh94wFQJio0rdyUIX8P4Ub0DRMdGoSr980XRa2APnX78GqdV7GysmLevHmMGDHC6OrX6/W8+eabxg1HgRG6V6SpddgKLg3Mmxu8HXa3gppDoM0aUSAoO4YOzbwhz7hx4rdtNlcHtrbw7bcizc/RUfQEcLKAwb29As6Oh5f3QpmXzJsbdkDU9m/1B5Rvmf14icWQGwCJRJJrDAYDEyZMwMYm/TYxKiqKdevWEbo2lLX91pKUmkTzhc2x+cGGl91f5la0CCora1fWOKdRxUbUdKlJVGIUiqIwstlI/n77bx49esSGDRsY+lSk+4gRI4wbjgJBUeDuWkh6YN6p36CHC9/AyQ+g7Qao99+83XPfvWve/NRUqFtXpA5GRma/YcgJt5bCuS+E8Te3twFA5CnRElne9z9z5AZAIpHkGq1WS8WKFVVV+BYvXkzv3r2pWLEiAI5THDkVcoqStiWNMQAAUdr0aoHnws4RnhDOvjv7sPreisN3DwOwbNkyunfvbtQFcPz4cXx8fPL5yTLBoIOTI0AbBS0WQckcZB/EPQ50TIkU1wUPDz9O8Wub9bzMePhQuPwBKlXKfrybG4wdC2mdGQcMEL/Lls18Tk65uRACJorGRFlVKcyIW0sh4l948VMo1yzva5GYjdwASCSSXBMdHc3o0aONqX86nY7ff/+d//znP8Yx9V3r42DjQFmHsiaV/zRoaFutLa6OrsSnxhvl5UqUw2AwmOhKSUnhp59+IjU1NZ+fLAP0yaL7XJWe5t1TOznBpumws6lwj7+8F0rkwHBnxokTwuWv0YCDg6jznxX168O0aaJVb05q9ueU63Pg4iRRm9+pjvnzHd3Avrzl1iMxG7kBkEgkuSImJoYuXbqojPHWrVupUqUKzZqln+guhV/if63/x+svvo7VU39yFBSO3D9C40qNaeXWigODDxA4JpAXXV9k165dODk50Srt5ArY29vzzz//UKJEifx/wCfRJ4scfe0jcHvVvDS9GyvAMBka/yzS/MxtYVupErRvn/6+e3f4+GPxumzZzDcATk7iqmLnTlEdcMuWzIMIzeXaTLjyK3Q+CKVrmTf3ym9weyVU7gKlPSyzHkmu0BT6Fpp5xNvbW/F/uq2mRCKxCIqiqDr8dezYkREjRtC0S1O0ei1JuiSaLTR171phhQEDpW1Lq2oBNKnUhDMjzgDQs2dP+vXrZ7z/T05O5uWXX2bv3r04Oj6j0rCKIoLUKr0M2hh4XL/ABINB1NCfMSPdICsGuDAB7qyCdptMI+M3bhRje/XKeg2jR8ORI+LE3749bN8ON007KJowZAgsW5b+vmdPuHEDrl/Pfm5WXP4Vbs4Tbv+SNXI+z6AHDJAYLOIm7MtlO0WSOzQazWlFUbJtQCE9ABKJxGzi4uIYMmQITx4gLly4wPXr13njjTcYvGkw3VZ2y9D4A5QpIdL34lLjGNpYGPh7H9/j2P8dA+DmzZucPHmSAWn31YjT/+LFi5+d8QfRfe7mfJGvn5nxT2PePHHSBtG971Af0QL3lZOmxj8pCebPTy/e8yTh4eInNlYY/bp14fx5Ebm/di080WshS5YsEWM1GrFBSUoS6X9Pcvp0xnMzQlFEsF/gEuh8yDzjD3BtOlz1hVLu0vgXEmQhIIlEYjY2NjYMGDBAVYVv1qxZjBw5EltbW44PPw7AmB1jmHVylsn8yKRI4+uw+DBSJ6Ri84RrfO7cuQwbNkzl6l+3bh2vvfZafjyOKSmRIi/daxq0/TP78VZW6Tn4sTfgcB+o0AGabgDrJ1z0ixaJ0ro//SQq8GUUhd+okUjPSwv28/ERXf3SZDnB3V2sqVIl+P138fq336Bx4/QxkZHg7Z35Op7EoAf/j0S54s5+4GDG3b0uAVLjoPYoGelfyJAeAIlEYhYGg4GLFy/SrVt6QZ/IyEjWr1/PBx98oBpbw6UGr9TKuP/7p60/BWD7ze3Y/mBr9CYkJCSwfPlyRo4caRybmJjI/v37sc5tYxpz0KeArQtUaC+60ZlDyC5R3KfuGGg+V238Ac6cSQ/Ee7qJj1FHiDD0Gg188gm0bi069eWEmjXFRuT2bfHexgZGjRIyL690OYhUQEXJ3vjrtXDsXYi7Ltz+5hh/gHvrhRfFpgRYO5g3V5KvSA+ARCIxi+DgYH788Uc2bNhglC1atIg+ffpQoUIF1djxu8ebzLfCikkdJ/HlgS8BOPX+Kf6787/GWIJVq1bRtm1b3N3djXMcHByYP39+PjzNUyTcB7/X4ZUTUP3NnM9TFOHevjJVtL7NrPvdnDni98KFmesyGKBfv/T38fHiJydcvmwqu3ED3n03d+V+dYng94boxuez3TwDnvRA5PfXHGz+90qeCdIDIJFIzKJatWps3LhRlfo3fdZ0jlc+rhqXWYCxAYPR+CsTFbyreHN02FHjnNmzZzN69Gjj+Pj4eDw9PdFqtfnxOI8XlQrhx0Ve/8u7QZPFn8bkZFGWV68X73VJcHww3FkJr/ybsfFXFHGiT2vR+zRpsQMg3PYHD4JzNjEHaZQsKX6PHAkZZUeEhcGdOznT9STaaNjfBRwqQtv15p/eY69D+DHx3NL1XyiRGwCJRJJjAgMD6du3r0r2999/U6FyBSLLRKqMfs0ZNQGY0jG9iU/zKuld8hpXeOI++jF+fn5otVo6depklJUqVYqjR49il12+e15IuCci2xUF7LLpL6DXi457Gg3UrwKzXMUGosvR9MC43bvTjd758yKKv00b+O67dD0aDfj5wcWLwogbDMJFf+qUiNjPSY1+jSa9mc/XXwvZgQPqMVZWIqjQHJJCYa+PKNDTcol5qYuPLsGNeVCxA3h+Yt73Sp4pcgMgkUhyTPXq1Zn0VCT5zJkzedjgIZFJkVh9L/6kJKUmcTfmLk52Tsz2nw2AlcaKkyEnjbUARjYfyYh/Rqh0pZ3+07wLBoOB3377DeecnobNJfY6BHwvctlbLc/ZSbVkSWFwI0/ARD00/VDU87d5IjvB3R3mzhWvJ02CgQNhxAjhjk/jyBHRlrd+fWHst20TrXfd3WHlyqzXYGUFP/4oUg/DwmDKFKhSRVwxNH5qY9W6dcbu/8mTRUzC08TfgT3toFo/EQSZlTckI2ydwN7VvDmSAkHGAEgkkhyRkJDAvn37ePXVV42yc+fOERgYyM1dN3mkfUR0cjQAzReKk36sNpZYbSzftP+G7w9/D4jiP51qdsLR1pHb0elBacHBwezdu5dFixapvjM5OVnVa8BiGHTCvV2mkflzby2Fc59BmyVQNYM8/smT4Y8/4MMP4a+/0uWDBqW/btMm/fXDh+Le39o6/WohKxQF/vc/4TXw9BSVAb/8UlwDpKHRwLVrUCeTKn0zZkDFiiI4MI2Yy3DgFfD8DOqOznheZkSdFcF+zeflrESypMCRHgCJRJIjHjx4wIkTJ1SytNS/kg4lqepUlW3XtzH75GxC40ONHf5srWyNxh8g6JMg9g7eSwmbEuwJ3MPYnWMBmDdvHu+8846qyY9Go+Grr75SFRuyCOFH4egAkdvv1ifn8ww68P8vXP5R5MJnZPwBli/PedDdRx+JawKtNmfG/7XXxF2/jY3YOIwaJXL8n2bWLKiWhSF++BCGD09/H3ES9r0MjX4y3/jrteD8IniMyH6spNAgKwFKJJJsURQFRVFUef+RkZF4eHhw/fp1XF1d6bCsA4fvHqa1W2vaVG/Dr8d+NdGTVgHw6kdXqVCyAmV/EQ1pkj9PpkaNGhw8eJB69eoBos9A8+bNuXLliuU8AIZU4eIuXQuSw6FExWynGEmJhCP9RRngNmuyjxXIivBw6NABLl0S7nwXF3j0yDwdGzbA66/nfg1PEroPjr4t7vsz29RkRsxl8B8NL++TwX6FBFkJUCKRWIwTJ07Qp4/6pLxkyRJeffVVXF3Ffe/NqJv80vkXjgUdY8HpBcZxD8eJ4jX2VvY42YvTfb3f61GmRBlCPglh98DdrF+/noYNGxqNP0CZMmW4dOmSZd3/Ef/ClV/EvbY5xv9RAOxqDn7RE68AACAASURBVGWbQodtuTP+c+eKe36AChXgyhVh/BcuNM/4L1oksgb69oX//Ee0+M0L9zcJ49/2L/OMv6JA3C1x8m/7lzT+RZG0nX1x/WnatKkikUjyhsFgUB4+fGh8r9PpFHd3d+XUqVOqcX3X9lXG7hyr8C0mP6n6VOVR0iPlTMgZhW9R5pyaY5zXsmVLZfPmzcb3iYmJytixYxW9Xm+ZB4i9oSi316Q9jHlz721UlPXlFSVwRc7nGAyKotWK17/9pihxcYrSpo2iTJggZOvXK0rv3orSrJmiCFOa+Y+jo/jdqpWixMamf0dqqpDHxJj3PE9yc4mibKikKJGnzZ8be1NR9nUx/99Tku8A/koO7KMMApRIJFly//59Dhw4wODB6QVdNm3ZRIRVBI29RMS5Vq/lQdwD4pLjCAgLyFCP7Q+i4tzdj+/S3aO7sULgyZMnCQkJodcTTXF0Oh1eXl6qK4c8o398T57Tk6pigIs/wK3F4LMDymXrUU2nSxfYt0+Y8HHjoG1bEfX/4IG4ex80KON7+6d56y145x3o0weOHVN/ZmOTu+I+aVydBleni45+TnVzPk+XCMH/QI3+0HGXPPkXYeQVgEQiyZKkpCR0Op1KNnfOXOIbxWP1OEVs0uFJuM9wZ9+dfey/sx8nOyfV+FV905veLDu3jPKO5Rm/ezwGxUCLD1oQ3yjeWOZXURQiIiIYOHBg3hf/YA+cGSfaztbKpPRuRqTGw5E34cEu0czHHOMPsHVruls/NlYU4vnzT6hRQ0Tdu2aTJufjI35PmiQ2E0eOqD/384NvvjFvTWkoCpyfICL2u/iZZ/xBNEiK8k8vbiQpssgNgEQiyRStVkv16tUZNmyYUXb16lUuXrhI8ppk4wbg+47fU7lUZQAMioFYbSwANo+djO9uftc4P0WXgp21HZuubiIiPIKSt0uyy3eX8fOgoCAGDRqUaSXBHGHQQ0oUuLYGjw/NmxsfCLtbiXv+TgegRKWsx584IfL7U1Jg2DCRmleiRHolv/feEyf5nTvFfX1wMNy7l7XOgwdFRUB3d5El8FT8BdeuqdMLc4piEAF7IdtFU5+S1XM+NykUTn0E9uWhyS/S+BcD5AZAIpFkysGDBxkyZIhKNmfOHN5//33s7e2Z/u90NN8JQzCh/QST+TrSPQe+XX3ZMmALDxMe0tKtJcpEhSVLltD/jf54e6SfsKtVq4afn1/eUv+CNsGFb8CmJDjVzvm80P2wu7VIZ2u+UNTAzw4fH/j2W+HSX7rU9PONG4WxTkwUBYFywrvviqZAtrbQsaOoKbBjh7g6MBjg6lUIyPiqJVMMqXBsEMRcgs4HwMGMYj0GvWjhW7mr+YWBJIUWmQYokUiyRKvVGsvwxsXFUaNGDS5cuICbmxth8WHUnlWbCiUrcHjoYar6VjXOcy3hSkRSBArib0zjio059N4hnH92ZnSz0UztPJU6teuwadMmvB4Xo7l19xY+g3y4e+iu0buQU25E3qB2iRKQGAzlmoOiEyl7OUFR4PpsuDQZWq+GSi8Lo1u3rqjW9zRXrogCPNmh14u7+mPHYNo08PeHuLj0joAZ0bkzbN4MCQlirLu7KBCk0UCTJsLjYGcnqgc6OWWu50l0iSKFUWMFbf4UnflySmKIaJDU5ShYPYNujJI8k9M0QBkEKJFIMsTf359Tp06p2vKuWLGCTp064ebmBsDEgxOJ08aRokuhqm9VXOxdeJQi7r4TUhOMxv/37r/z0Y6PcHJwYt/gfXT6oxMJFxK4Z7hHgwYNjPodSzsS5BFkLCKUUwyKgTqz6xA+aC3lU8OhfAvQ5ND461Pg1CiIOgVdj0Mp0cOAzz+HDz4w3QAYDPDii3D/PpQtK0oDx8WJmvwg7ubDwmD+fGH8gf9n77zja77+P/78ZMkmtggxYo/GHhWbokZbVAdFba3aLW0RLaVaRew9itra2jNmYosVYjSIlUhk79x7fn+c5N6EkHvV91fjPB+P+/jMcz7n3gd5n8/7vN+vNw0bQlra05X+PD0hIEDGB+zdCx9/LOMIMr+gzZ0LRYrAkiXmBf+lRMPBdrJOQd0lpk+KABLugL0beG1Qxv81RE0AFApFtuTNm5cyZaT7PC4lDm9fbxZPWszqJavRxmvEjIrB1ckVgBR9Chqawfg72zjjbONMQpyscnf8znEiv5YywU1LNkWME1SuUxlqY/AupKSkEHwlGLHEfK+kxf3diE/mQKku5jVMDIXD74NdEWjhB9aOxmv37j3lYRZZDfChQ0bjn5oKP/4oDb+NjZT33bBBGn940vgXKiQnCwEBULKk1OZfvFjGEly/bgy069cPFiyQfa9aJY9NISlMSvsW8IIa081z3yeGwuFO0OKInAQoXjvUYo5CoXiCqKgonJ2dad68OQC3o28zdfVUolKiqN+gPg2KN+BoyFHGHRhnaJNR5McCC2JSYrgTdwcAF1sXVlxYgcsUF2JiZHBgYGAgEbcjSP4j2dA+ODiYJUuWmDdQIWCOD0Q7QL5sXPXP/JIXYHcdKNxCCtlkNv4Z5CTNK4Rcr8+QSLa2lucsLWHWLGn8n0VoqDTwAwfKSoALF0KvXtLLUKYM7N8v97//XqYVfv+9XH4whfhbsqhP0Q5QY4bpxl+fJsWB7ApBSz/zKgEqXinUBEChUDzBwYMHmThxouG4YoGKvBfzHs27NCc2NZbDPQ9TPHdxahWuRUH7gvSt3hcd0ljq0Rva1SxSk8ikSLpUlG/muaflxn6CPbNnz6Zv376Gt3+RmEi5okWzFAIyiesLwHcw+F+DvNVzvj+Du9thXzN46yeoOj574xgUlHOuvabJtfq6deW+Pv27R0RIed+csLFJn8TMkV6EZs3ksYUFJCVJrX4HB6np37SpbCOE7PvRo6f3G31ZGv8yA6Gqt3kR+2mxcH+3DBpUAX+vNSoIUKFQPJPY5FjcxrmRMCuBtK/S2NVrF77BvgRHBeOUy4k9N/ZwK/pWtm3DR4aTzz4fAJ3+6MTGqxvRkjTyzM/DxYsXcXWVSwgb82isj4Y1pv49SnoohX1yFQD0MtrfFISAIB+4/DM02AgF6j373uBgWaJXCPD1NRphkK54Jydo316W4g0NNU4AcqJOHTh50nj/3LlQuTJ4ecln7dwJrVtLI6/XQ758WdsXLCiXCLILAgw7Akc6QrVfoWS3J68/jZRouDAOPKeApY3p7RQvHaoWgEKheC42b96Mj4+P4bjf1n7EHInhs88+Q/wkeGflOxy6fYi1l9ay6/oubkXfMrj/AYo5FcPKwooHwx/QaV0nrkdcJ/BhIBNaTECME8xwnUGLFi0Mxh+gYlAgoy6dNX2Qd/+GO3/LaHZTjb8+VQb73Vgk1/ufZfxBvjWXKiX3HzyQb+eaBl99JY1y166y4h7IeIG1a2WBHyenZ/dbpYrs75f0YkmxsbJscIMGRm9Dy5ayYJCLy5PGH6SaYHbG//ZGGbFf73fzjL8QYOUosyfMCRJUvNIoD4BCocjC/fv3efToEZUqVQKkEmDx4sXx9/fHw8ODTus6Udu1Nt/s+4Z8dvmISIzIth9Ha0fiUuMAKJO3DA7WDpzue5oKFSqwaNEivLy8AHj48CHHjh2jResWRCdFU8jxGUV6HuyVxqpIC/O+VEpUehqcFTRYA9Ymps89zuLF0i2fkgI//CDFfv7+W04IAgLkcoCpeHvLoL+//nq+sTxO0EwInAyNtkLeaqa3S4kC31ZSEtjS9sWMRfGfotIAFQqF2dy8eROdTmcw/gBr166lVq1aeHh4ALDx8ka2BG3B0caRuOS4J/pwyeVCZHIkcalxHOl5hPrF6htEfXbv3o2trS0NGjQw3B8WFsaVK1fYpN/EsoBliHFPeSkRAixsATNfWmJvwMG2UOQd6RY3JagtOVmuzz++dt6rl/yAnABYWICHh3THQ9Y0P3t7Kf6TGR8f6UGYOVO+5Y8bx79G6CFglPSKtDgKjiVMb5sYKoP93l6tjP8biFoCUCgUBk6fPs2OHTsMx0IIZs6cyZdffgnAybsnAdj+yXbWdVzHW0Xe4kTvE1n62Nt9L4EDA5n2zjQaLG1Ax3UdDddmzZrFoEGDDBMCnU5HhQoVGDlyJEs7LH268Q+aBdfmQsEGUNDL9C8Udgj2vA3lvpJpcKZGtNvawtChT1/TP3ZMGv8+fYzGX34hY0rg48a/dGlp/GNiZBnfrVtN/x5PQ5cMfl3h4VHzjX9qrEwRTEsAx1L/fiyKVw7lAVAoFAY6duyY5fj48eNERUXRqlUrElITqL2oNhZY0GZ1G1L0KdhY2GChWTCs7jB+O/YbADUW1ECME1QoUAF7a3tWnZeFgIKDg/Hz82PNmjWG/vfu3cuyZcv4448/sh9QWgIgoHhHsDAzMO2f5XB2JNRfZf6SwaNHshCPpWX2WQAZxXk2bZITgcwThbgnvSKUKSODCPPkkVH9L2LpNSVaahhY54Gme01X9xMC7u0A19bQ6pRK83uDUTEACoUCgGnTpmFlZcWgQYMM5z799FNKVyxN867N8Sruxed/f86ygGWG61UKVOHKwyukkkph+8JUKliJbZ9uw8bS5gkt/6+//hq9Xs+vv/5qOCeEIDo6mjxPS5m7OAGsc0O5Qdlfzw6hh3Pfwe11cj089zMke5OToXx5CAyUBXwaNpTR/cWKySC8YcOkJHDGd9m4ESIj5Zv/s3B0lB4AvV6mEnp5yZz+F0XCXTjQGgo2gurTzVPpS4uXwZC15pgeQKl4pTA1BkBNABQKBQBxcXHExcVRqFAhNE3j0o1L1PSsSd/lffG54GNwz88/NZ/+2/qjoRmkfjOT3z4/cclxDKoziF/8fiF8ZDh22OHu7s6xY8coXbo0AJcvX+bs2bN88sknTw4m6oJc73csCZql6XnsafHg/5lUwPPaDLb5n31/hlZ/aqrcFiggBXeqVpUV+9zdpRE/flx+hgyRkfmRUtWQ0qXhxo3s+3Z0lJOKFSukB8DBQU443N2Nz/7nH3nNHKIuwYE2UPYLqDDSjN8mES6Oh8rjzKsFoHjlUEGACoXCZE6ePIm1tTWenp5o4zUaFm9IwLoAksolMeODGUx9byrvr32fGoVrMObAGHJZ5iJZl5ylD1dHV2a/O5sGxRtw/dF16i2ux6Rmk8hrl5clS5ZQp04dg/EH0Ov1BiGgJ4g4BbnymlfJL+EeHGoPuiLQcjdYm2DkHnfxP3xo3C9eXE4Gbt+GeplSBhs0kDr9trbyLb9wYZnWl5ly5aSQUFwctGolz9WrJ3P/M2SBV6+Gzz4zbzkg9CAc/RCq/QYlP835/gyEkJUNncool7/CiBDitf7UqFFDKBSKZ7N582axZcsWIYQQNyNvintR94Srq6s4d+6cEEKIff/sE3gj8EaM2T9G4I04e/+s4VzG52LoxSf61uv1wtPTU+zcudNwLj4+XiQkJDw5kBvLhLizxfwv8ChAiM3FhLg4UQgQ4uBB8/u4f1+21euF2LtXCC8vedy/v9zmyiW3BQrIbe/eclusmBD58sl9EKJ1ayGcnISoVEmImBjzx/E0bq4VYkMBIe7vNa9dWqIQu72ESI58cWNRvNQAp4QJ9lFlASgUbzipqam89957tG3bFgD3PO4c2X0EDw8PqlatCki3fgY/HvqRcnnL8fHGjwH55v/XR39RxLEIledWztL37ejbVP+uOgEhARSrVsxwfseOHQwZMsR4o14n1+7zVAZnE8rsZubudtjfQqb4VfpWmuGGDbO/d86cp+fqOzlB48YyqE+nk2l8QsCYMfJ6tWpQtKjRS5AhWxwSIqV/jV9Oeg/i43MWBTKVK9Pg7HBougcKNzO9XfIjmd5Xez7YmCBNrHijUBMAheIN54cffmDWrFlZzmVO/QPIbZPbsF/GpQxBj4IICg8CwMrCiqikKCoWqMh3Xt+xJWgLIL2LEQkRBG4NpGe/nnjk8zD00bFjR+bMmWN84AVvuLEE8tYAJ+MyQY4EzYITvaHR3+D+Yc73f/EFXLqU9dw//0hVPgcHabx79oR33pHXliyRRv/qVZg2De7efbLPSZOM+5aWMmYgKEjm/P9bhB5OD4PrC2Wan8tbprfVpcC+xnIS8KxASMUbiwoCVCjecNLS0khKSsIxPX/93LlzeDX3ovvS7sxsK6Vur4Zfpdzsck+0rVygMhcfXqRl6ZbsubEHgcDawprLX1zGY6YHt3reolq1aty8eROn9Lfhffv2cfPmTXr16gWJ98HSHoROStGaqkGv18GZYfBgDzTeJoMFzWX7dhnMp9NB9+7GQMAzZ2SZXmfnrHK7gwYZpX8f59Ah6XWYNAlGj4YRI6RgUPny5o8rA12yDGhMvA+N/gIbF9Pbhh6QGQL6FLn2r3ijULUAFApFjuzcuZMTJ04YjD/A7NmzafB+A/I65DWcK+liNLANixvd6xcfXiSXZS46VeiErZUtRRyLkDImhVIupbgw4ALz5s2jW7duBuMPkOaURsWKFeXBtbkyJz1XXtONf2ocHHoPoi/JcrWmGv/kZFi61Hi8dSvMnw/pSx/odFLgp0YNcHODj+USB5bpKXZ1nlJuuHFjafyjoqThP3JEehT+jfFPiZQiPUIPTXebZ/z1qXBtHiRHKOOveCbKA6BQvMHs2rWL3LlzU7duXQAiIyMpVaoUxwOOM/bEWMrmL8sPTX7gYuhF3pr3FnXd6uJ3xy9LH6XzlObdsu/Sv2Z/7K3tcc8j09wSExNxd3fHz8/PICN8885NSvqUJP6LDdjnLg+5K5pXqjbhLhxsJ0v/1pprXuGagAC5jv/43zxraxmZ7+4Ot25BrlxysgBQsqSsCJhxX2qq3M+4N08eY0rgiyI+ROb4F24O1X8zvSSvPg0uTYLyQ8D6BcUeKF5JlAdAoVA8k+joaFq0aGEw/gBLly7l3Xffpdyychy/d5zy+eVb7Lf7vkWPnlP35GS6oH1BGrs3ZnOXzdyIuoHPCR8qzqlIeEK4oa8//vgDtwpu1Nxg/Ds07ZdpfGv9Lfakybrz5hj/yADYXRfcu0DtheZXrfP0zD7lLiVFvq1nBPIlJ8tAQDBuwWj8QRr/pk3ht9/MG0NORF2APfWh1OdSuthU4w9SLyFXPvPaKN5oVEKoQvGGMmXKFNzc3BgwYAAgdflnz57NqlWrWFl3JXqhJzktGW280Uin6FMACEsIIy00Dd9g3yx9dlzbkVsxtzjR+wQ+Pj70GNmDodeHEhQeRLn85fDunAsLl/LSiJvD3a1w7HOpXle8k3ltb9yQgjyZyg8DcO2arOQ3fDjkzw9XrhivZUj7Pk3kB6SyX/78MmjwRRDqC0e6QA0fKPGR6e30Oql/UHshlB34YsaieCNQEwCF4g1lwoQJ6DIq1yHjAVxcXKhTpw6+wb40XdGUblVlTXkLLNCjp75rffzuySWA2ORYfE74YIEFH1X+iHz2+Vh1YRUuti4EBwSTnJzM4E8GE384nrK5i+J39DAehd6loHtV8wYa5JNe5nYL5H/KOvyzKFNGrtNnluIND4eyZeX+iBFw4YIM+HN3N3olMnsLXFykqE9qqlQLLFQIYmPhjz8gKUmm/Dk4wLp1Ujjo++/NG+PNNXBmMDRYB4Uam94uNVa6+9+aCHZFzHum4o1H+YoUijeQFStWcODAAays5DuANl6j/9j+fPnll2iaRtMVTclvn5/fz//O1k+2oke+ERd0Ksi2T7YB8EOTHyhgX4DWZVpTq2gtfFr7EPF1BI++ecS6pesMVf++a/gdWsAoIs7O50a4jekBbXodnPoKrs+HFn7PZ/xBvs0/rsPv5ATt2xuPq1SRxrtixQw5n6z3R0ZKw29rK3UAvL3lMoCFBXzwgfQE2NnJCoKHD8t0Q1MQAi7/CgFfy4I+5hh/oYd9TWTMgIunecspCgUqCFCheCPx8/Mjb968lE+PVNe+0si9Kjf379zHzs4O6x+tSdOnMbP1TGadmMXYRmMZvms4D+IfULVgVc6HnSfl+xRsJtjg3cibgAcB/Bn0J3eG3sFtnBvMh9iwWBzTboJdEfRaLiysHUw3UqmxcPRjmcbWYD1k0iF4Ydy//+SyQM+eWTMFQK71P3ggK/+VLw+7dkGLFk9+l9RUec7PDxo1ylniNyOVMXQ/NNkB9m6mjz38OOSrBboksLI3vZ3ijUAFASoUimwJCQmhWrVqBuMPMNhiMAP6DsDOTurn+7TywbuRNyHRIQRFBPHppk8ZUlcq93nk9aCoY1HWXlrL7SG38T7ozfZr2+lcsTO5bXPDSbCsZsmBewcgZBM8Os3H3Xpx4OBB0waYeB/2NgI7V5nj/78w/nFx0vhnBPnlyye3jxt/kMsDgYHS+A8eDBMnZg0OzMDaWuoINGyYs/HXJcHRLhB1HlocNs/4Cz1cmQoJIcr4K/4VygOgULxheHt74+HhQdeuXQFZBbB48eKcPXsW94xKdcD2a9vp9XcvHsQ9oL5bffzu+JHXNi9JaUkkpCUAIMYJDt06REN3qQ2QkJBA8eLF+X1xO769vIyzo+Tfl6ioKGxtbbG1tX324KKvyBS40r2lrO+LcmtfuybX/IWQqn4nTkC3btnfa2sr1/Xz55exAhmcPi0zCSwtZZngqVOfbyzJj6SOgZ0r1Ftueq6+EBA0A0r1ULK+imeiPAAKhSJbvL29DcYfYOXKlUQWiqTPIVnjPkWXgn+IP9FJ0dhY2uBk7USNIjUAeJT0iIS0BL6o+QWfVP6E8jPLM9Z3rKGvVatWUb9+fVrX+ICz/c8DMh0wOjo6Z+P/8KiUrq0yDip/92LXtAsXlm75yZNlpb5ly+Qbff5sygU3awa1a0vj36CBPDdzJlSvLt/8hXh+4x97Q6b55a8Db682X6hHs5D5/grFC0BlASgUbxA///wz1apVo2XLloDU658zZw7LJy6nTas2AOy6vov2a9pnaffX1b/4pPInrL64GoDZp2YD4J7bnYO3Dhr6Sjz1PRP69gO3doa24eHhWGTnMs9MyGY40Q/q/Q6u7/y7LxkSIovx6PXGScR330mJ34xliH375LZHDzkZyMy2bcb9I0egQgWp8nfzphQGytyvOTw8Coc7QRVvKNPP9HZCwJHOUG0KlPvK/OcqFE/DlJKBr/JHlQNWKIxcvHhR3L1713A8fd10UcCtgNDpdFnu+/nIzwJvxJQjUwylfq3GWwnNWxN4IxadXiRmHJsh8Ebo9Xoh0hKF7749omX90kKf9MjQT4wp5XCDZgmxyVWIiNMv5ktGR8s4/kzfU/j5yXPW1kK4uhpL92b3GTpUbjdtytpvSooQAwcKsW+f+WMKXiVL+d7dmfO9mcko4RtxWgi97tn3KhTpoMoBKxSKzFy4cIFChQrhminyffni5VjXtiZZl4zIFA/0zd5vsNQs+Xrv1+z8ZCceLh6kiTR6ekrRm95betOmTBvEOIGmaXBhPJe2juT9biPQchnT/Nq1a0dAQED2AxJ6CBgl8/xbHJHyvi8CZ2dpyjO+Z1ISFCsGX34pI/UvXMi+Xffucvvzz9Ldn5Em2KWLjBuwtpZehIwywKYgBFz4Ac59C832m+fdEELWA4i7KX8bpfCneMG8dP+iNE3z1jTtrqZpAemfNpmujdY07bqmaUGapv1LP6FC8QaxYgVb160jc0Dso0ePuHHsBivGr8D+J3tG7hkJwMm7J/m08qfohBQJarW6FTcipSLeV7WlC/qvLn9RMk9JiL8FiaHcdOzGuBW36PZYYN3u3bt5661sStjqUmSlu7BDsszt81TzMxUPDzkB8EuvYZAR8Z9Bhjv/wgUp6GNjIw19xrKFry/cuSP3/f1h9WrTnqtLBv/ucHcLtDwGeSqbPuYHe+UEqflBcCxhejuFwgxeuglAOtOEEJ7pn+0AmqZVBD4CKgGtgDmapln+l4NUKF4ZundndNWqtGrVynBq+fLlFK5WmOYbmxM9KpqH8Q/xPuBN7UW1WXVxFQAr3lsBgKO1rBbYZ0sf9GP1dFjbgW3XtsHt9RC6n9nzl1K5ZVVyTzWm7P3www+EhoZKD0FmUmPgQBtIi5fiN7bZBOJlMG8eZApYNItHj6B+feiXvt5+5oys9gcwMJNkrhBQs6a8vnQpBAVlXecPC5NaAOaQHAG+LSEtThpxu8KmtxV6uLkakh6AZQ6BkwrFv+BlnQBkRwdgjRAiWQgRDFwHav/HY1IoXgm+GjSIXZlq2wshmDdvHot/XMyidouw0Cwo6VKSknlKIsYJRh+CGg8s+OzPzwDw7+3PsLrDOHn/JBEJEQR0+JWWuZ2hwgjiC7Rn6dKllH6nNHqhNzyjZMmS5H88yj7hHuzxAudy0GBDznnsuXNL1b7siIqCu3efPJ+xlJGYKN/Yx46Vk4g1a6BdO6kBMHNm1jYBATK9r2RJmS74bzIQYq7B7nqQrzZ4mfAdDePWw9mRMk2w7hKwL/r8Y1AoTMGUQIH/zw/gDdwEzgNLAJf087OArpnuWwx0ekoffYFTwKnixYu/mKgKheIV5t69eyIyMtJwvH//flGpUiWh1+sF3oiDNw+KKw+vCLwRM4/PFOF2iL7tLYTtj7YCb8SgbYME3oh8P+cTeCN++KO+2HtsnBBCiHnz5okOHTpked7169dlcGBmoi4J8ae7EBcnCfH4tcwUKybEjRs5f6nWrWWwXgbx8ULcu2cM5ps7V4gBA4zHlpZyu3On8dy4cXLbu7fcvvde1j7NJfSQEBsLCXFtvnntMgL8glcLkZrw/M9XKITpQYD/iRCQpml7gex8Yt8Bx4BwQAA/AkWEEJ9rmjYb8BdCrEzvYzGwXQix8VnPUkJAijcdX19fSpcuTfHixQ3nunTpgpeXF/cr3CdJl8TYhmPpsKYDpfKUYum5bNTwgOXvLaebfRLCwpKuAfuoXKAy3+3/jorrKzJz5kyaprvJhRA0atSI1atX4+aWrnAXdhiOdIJqv0LJpwjwZODpCevXyyI+zyI5WZrxJ5FLHgAAIABJREFUv/6Sb+xd0isMOjtDWhokJMj1/uhoeZwd3t4wbpzcnz4d9uyRwX/9zEjTyyB4pZT2rb8SirQ0vZ1eB3u9pEfE3jXn+xWKHDBVCOg/0QEQQjQ35T5N0xYCW9MP7wDFMl12A+694KEpFK8d586dw8nJyTABCA0NZfvO7Xh85sFPR37ic8/PSUhN4OCtgxy8dZA6RevQ0L0hzUo2w9XJlZN3T7L7+g7mn5jJBx2X4Gibj9WlexGfEk/0lWi2adto0qSJ4XmapnHo0CHjAG5vgJMDof4qKNIi5wE/LWvgcUqUkOvzLVtKow9QsKA8l0FERPZtR4+WSwHTp8OYMTLgr2hROenIMP6zZ8vMAEfHZ49DCLgwHoKXyUh/c4L94m7KIL+31yjjr/h/56WTAtY0rYgQ4n76/lCgjhDiI03TKgGrkev+rsA+oIwQQvf03pQHQPFmo9PpsLTMGis7adIkthzbQmrbVI5+fhRrC2u8D3hz4u4Jdt7Yib21PQmpUuq3btG6HLt7jBF55Ev2N73DyWdvjKLXymvUbFSTk/NPAqDX6/noo4+YM2eOXP+/MgMu/wKNt8qKdaaSId37LNEdnU5et7GBQYPkur6jozTsmbG2lsV7tm83nsv4u6dp8PffMjYg87mMrZ8f1Kv39HHqkuF4L4i5Co3+Ni/YT58max54bTSvnUKRA6+yFPAUTdMuaJp2HmgCDAUQQlwC1gGBwE7gi5yMv0LxptO1a1d2795tONbpdCxYsACfMT6c7HMSawtrFp9ZzA+HfmDnjZ20LN2SygUqc7z3cQAeRl6hiCW0a7uTKV8kZzH+QdeCIATWjF+T5ZkDBgwgX14XGdB2fR60PGqy8Z91YhaXH14GNzf5dv648S9RAipVkvubNsn7QOr3gzT+j6sOpqZK41+oEMyfL3P6NQ1GjZJGv126aqGjI1StamwnxLONf9JD2N9cFvZpfsB0Iy4E3FgKCKl/oIy/4j/ipZsACCG6CSGqCCGqCiHaZ3gD0q9NFEKUFkKUE0Ls+C/HqVC8CixcuJCGxYoZDOnu3bvJmzcvU4KnoBd67sXeo8/WPob7d9/YTfty7clvJ6P3RxYrxfSKb9NoZSvidalZ+l4wbwFff/k1pQuXNpw7dOgQDerVQvPvCuH+MsffwR2TEIJBOwZx+PZhsLOTlfce59Yt+OQTuH0b5syR7n5PTyhQwHiP3piJgEu6KJGdndT279sXZs2SbUaOzNr31atGieCciA6E3XWhYENosM68qnxCD7FXZYrgi6x3oFCYyUu3BPCiUUsAijeVtWvXUr16dUo7O2HRfwBs3kyHDh2o1KASkxImMffduQzYNoD89vkp5lyMsw/OYqlZoqFRxSYNRw0OJ8m+ulTqwqRmkyjpIgV74uLicHd358yZM7KCYNmypH74IV0unmNVn2jsnAtAvZVgZWf6gDUN3nkHdu589n1Dh8p8/bQ0KdwD8q0/s+H//HNYtUoGCtrYyPS+oCD59r1vH/zzD/Tpk33/OXF/N/h1lQGNpT4zvZ0+VYof1ZwFufLlfL9C8Zy8yksACoXiBRAfH4+maVjOK0LbzqmEhIRw+PBhRvUfRbOSzWjt0Zo2Hm0ITwjnfKis3GehWfBry19p4VaTvOmhAx0rdGRD4AaG7R5m6Pv333+ncePGxvLBgwdj1aYum/rcxK6QJ7y9zjzjD/INfMWKrOfu3ZMTA70efv9d7ufNKyP74+OlQc+4npklS6TxB0hJkXLA587J42bNnt/4X50jjbjXRvOMf1oiWFhD6T5g45Lz/QrF/wPKA6BQvIbExsbilC6g8yDuAQ7WDvz6069EREQw9IeheMz0YGG7hZx7cI741HhWn19Nsj6Z9xygqBXUaLQEj7weNFzWEAAxzvh3QghBxYoVmTdvHo0aNQIg4d5JGtSry9H6Ttitjnxxrm0h4M8/5dq8hwcsXgy9ehmvV6sGZ88aj62t5Zr/0aPg7i4Nv5cX3L9vDPJ7HvRpMsXvwR5otBWcSufcJgNdCuysIRUBc+V9/jEoFCaiPAAKxRtM9+7d8fX1BaCwY2FsLWxZtGgR/fr1w2OmB01KNMHJxonFZxdz8OZBkvXJWAEXdbbsTYD1gevpuK4juz/dTbOSzTj34Jyh783bNmNjY0PDhg3RxmvM3/ox9sfasmHyMOxaTnux69qaBhcvSlW/jz4yGv8PPpDbzMZf04zaAcOGyQBBJydZHvj48ecfQ2oMHGwPMVegpb95xj/8BFjayEBIZfwVLxn/iQ6AQqH437Ju3bosGvxbt26lRIkS6Avoifwmkvmn5tOlchc6VeyEhWbB59MtKGcNaVW/Y4zvGGra5WV4veG0XCUFbTzneyLGCfxD/Ok4vCOLvl6Epml86AjvP1rDoofD6DF4Eli94D8puXNDTIxc869fH4KDZRbApk1Z73NxgchICAyUxzVrQoUKMvI/MlKmFD4PccFwsJ0M9qvhAxZmfL9Lk+HGImh1CmzyPN/zFYr/IcoDoFC8ZkyfPp1r165huXw5aBqzT8zmg5EfUKtDLTzne3Ih9AKj9o3iWsQ1nCZY4f6TJRvirJn4CLpVlSp9qy6sYud1GYwnxgnDEkD+pPwUiCzA+53fZ/y83PyaH5rcgKuhlk/oDZiNXi/d9H37Sp3/5GRp/EEa/lWrZDBfdpMMNzcoV07uT5gAM2bAsmXSQ9CwoTEbwBwe+sHu+uDRD2rONt3465Lk9yjSUlYBVMZf8ZKiJgAKxWtG8eLFyZcvH7RqBYsXU1xfHLtwOyZ/NRkxTuDl7kXK9ynEJMfwgZMlfZwFcfpU4gRUmVuFiU0n4lnIkwdxDwC4/ui6oe9vfvqG+EqxLP89H51yxdAzvgxJjqWYMmXKk1X/ckIIGcl/65Y8trSUa/0LF0o1vmLFjIa7ZqblzIxJQZMm8r7r12Up32bNpNFv2VL2tWsXDBgA58+bv/5/czUcek8W5Sk3yLxljVNfwZ0/IW/1Z1c6VCj+Y9QEQKF4jbh9+zbvvfceBQsWBFdX6uoX0GtcLxIrJWJraywtO3DtO4xcWZODoghjHxnb96rWiw7lOnC2/1nqF6sPgE4v9bZiY2M58PduNn1qT/9StWhwB/YFX8N6sTX6x6PwTaFzZxm0V6KEjOp/+BAOH5bGukULWc43MlJOZDICeX/5BVzTJXPPn5fCPhmpgDVrwtdfG9MIbWzkEoA5CD2cHwvnvpOyvq6tTW8beQ5SY6H6VHB7z7znKhT/ASoLQKF4jfjwww8ZNmwYdevWBWD75e186vUpJ/xPkOScxIzjM/jj4h+8ZZlABRtYFZ+LZF0yFwZcYP8/+xm8a7DB3f/5X58THBmMbw8ZTDh/9jRqJU+heo3a8PYatIlS/CZ2eCyO6Xr5IdEhnLx3kg8qfJDzYBMS5OfxksFgfOP+8Uep1Z+BlVXWwj6OjnKiUL++nCT8m79naYlwrAckhEDDP8G2oHntA0aBaxsZL6BQ/Ie81MWAFArF/4a1a9dmOY4OiKZmtZqUKVOGLUFbiL79FwMcEpgaBf5JADJXvsrcKpTJW8YgASyEYGnAUoIHBwOgT3pEjdjvKFq+ocyBt7AiakgU06ZNw8HBwfC8jZc3MnTX0Cxpg0/F3l5+sqNkSbnun9n4w5NV/QYOhM2bpfEPDc35mU8j4R4cfh8cPeSbv6Vtzm0yCJoJhZuD5+Tnf75C8R+glgAUiteEESNGcPny5Sxr8XPnzaV///4AtCvThvW9LtCt+XycbJyeaD+g5gDqLKqDNl7D4gcLdnfdjXtud0gMJe7Pmlx76EDB9tsMwXCpqamULFkyy/OG1B1imvHPjk2b5Ju/v780/iBFfzJkfsuWlel9mXFzk2WAly+XlQCfh/BjsKu2dNvXX2m68c/wNtgXA+snf0+F4mVHTQAUiteEtm3bGkr+AgQGBnL4zGHOOJ9h8Zb3SDvRnzU3DuC5oR+WmiVty7TF73M/enr2pHe13lwKu0TYiDD+7vI39dzq0aJ0C7SE26TtrseiwxHoqv2GZiEj/XU6HampqXTv3t38gTZpAp99JkV61q6VaX3+/tIbUL06DBkiYwPy5JHu/YcPZburV+H994392NnJtvnzPzkxMJV/lskc/1pzodJo84L9/LrCw6NQ7D2wd3u+5ysU/yFqAqBQvAacOXOGOnXqGNbiAebPn89X/QZyO8yf/mf+4oBzUz7e+DFinCAqOQqv4l5cCL3A0oCluDm7sThgMRfDLtKufDv8evnJgjd7vDiWVpPhv8fw4YddDH1funSJXpkV+cyhZ08p61umjHyDj4yUa/itW8OZM3DihFTzi4qS99vYGNvOmSO3V6/Kgj4ODnDokMwE0DRZItgU9Glweghc+kkq9Lm1M3388bdlsKDnT5D/GdUCFYqXHDUBUCheA3x8fLiVkU4HJCQksHLlSq46zmG+e1Huj3zIkstbAPCc58nWj7fyzb5v6LetHwBT/acS0C+ABsUbANBlfimittWAtyay4C9bJn83meqLqjNg6wAAqlatyrZt255vsBlv/3fuQIMG8m1/1aqn35+SIl38mgZ//AFFisjJg5+f7KNiRVkOuEwZmf6XE8kR4NsKoi/DO8chdwXzxn9mODw6LascaupPqOLVRf3rVSheA5YtW0b58uUNx3+tXUj/98sytOsuHPetxDmXs6Hgz7nQc/x46EfDvdcHXSc2JZZZJ2YxaMcgVu/tw5LcYYRVmshdm6Zs2bKFvn378q3Xt/Ss1pOzZ88yevTop+f9v/22rLYHxu3jZLjuQQr+HDyY/X0Zrv3u3Y1r7uvWGa937CjP29pKrwDI9MJq1eT+qlVw44bx/qiLcr0/bzVovM28wjzBqyAlUpb/zVfL9HYKxUuKmgAoFK84H374IVeuXMlybvvGhXRtU553Vr2DtaUNNpY2XHp4Cf9e/lTIX4GFbRcC4GjtSM8/ewJQq2gt2jsIWj5Ywt4ifSj71jBmz55N165dcXFx4ZMqn1C7aG3c3d1p37790wcUEiLz+m/cgNKls0/NO3xYqvQJAQ8ewIIFsqRvBoULy9LAv/0G335rPF+xolwueBYjRsDEiXK/a1fYujV9XH/CviZQxRuq/WKerC9A4l1IiXqxtQ4Uiv8QlQaoULzieHt74+HhIQ8iA7h7ahF/+F0hT/8mTGgygWSdTPUT4wS9/+7N5fDL/BMl38zjUuM4HHIYgG5Oeuxu/Y2+9TFyx8YTHx/PwoULOXbsmOFZ4eHhhIaGUq9eNmvfaWnSBX/7tvHc48Y/LU26/3v2lEp9mzZBeLi8ZmFhLOv74IF869fp4Pvv5WQgTx6pFJgTdepkfb7Qw4Uf4MZCaLzd/Lf3Y59DxW+g4tfmtVMoXnKUB0CheIXZuXMnrq6uWFlZSWNnX4z1e/+h46cd6VOrD981/I7xjccb7q9aqCr9q/en79a+AFTMXxGAr/KAbeBP0MyXK3oHmixvwtKlS/Hy8mLQsXQp3KFDuXTpEmvWrMl+MNbW0ojv3//0AbdtKyv0xcTI4L0PPpDa/3/+aUwDdHSU537+GfbuBV9fqef/uPHX6eT9ERFPf15qHBz5EO7vhHdOmGf8U2Pl1qMfOJYyvZ1C8YqgPAAKxSvM9u3beeutt8iTehmu+hBdeR7jF/gTGBhIkUJF6LKhC+sureNM3zNUK1KNwTsHA1CjcA3C4sP4ouZAUs6Npo1NLFqLw+DgTkUg7fs0ypUrx/Lly2l9qDVXNi2g/NsdaFSwII0aNcp+MEePyvV/L68nrwkhJwcZokFXrsiiPRmUKCGj+u3sIDbd8JYtK/UAGjTI/nmWljKlMFPmQxbiguFQB8hbC+qvAstcOf6eWcZ7oDXUWQL56+R8v0LxCqI8AArFK4per8fHx4ci+WwhX23wnMzYGWOpVKcSRYoUQRuvse7SOhysHai+oDpzTs6huHNxKheszJx356ABJW78RiOrWPJ1CJRR7els2bKFfPnyUb9+fWJGx1D+/T78vmsX3t7eTw7k3j25rVULNm6Ub+Z16shUvgyCg2WUfoZuf2SkjBPIk14pz9MTfv1Vuv4zGD4cjhyRJYGfxv79kCsbw/5gP+yuB6X7QJ1F5hn/B/tB6KDJbnB+zjLCCsUrgJoAKBSvKF5eXtw+vw0OdwILS4R9cZYvXk5k5UgAfFr5cGngJeJT4/mwwod8sf0Lbsfc5mLYRZaeWciKQlBUH07ju5DPRabC3Yu9h06vY+rUqQwfPjxLpH/nzp3p3bt31kGcOQNFi8r9uXOhXTvplj9xQr7xp6XJ49Kl4do1+PJLee/u3XD8uJwQVKokz40YYZxMZHD6dNaJRE4IAUGzwO9j+dZvbiU/IeDmKki8B1ZPkSlWKF4T1ARAoXgVEXr+XuZNsSptZGAb4O/vT8FcBbkw5QIAg+oMwjmXMwD7bxrX5W01aPNgES6WUO+fGDZ8vNtwrehvRfly4Zfcvn2bDz4wFvQJCAggICAANzc3Y6AeSOU+IeRn8GD5Bp+xlv/JJ9JNnz+/0Y1/6ZJc23dwAGdnmcaXkbu/YweULy/7T0mR5ywtZQGg7Bg2LOuEQZcMJ/rA9fnQ0h8KNzPr9+T0EKkRUHcxOBTPuY1C8YqjJgAKxSvI+mVTcbw1A61zJwiT9XznzZtHv379sEhPp3t78duM9R2LZyFP4lPiaVmqJc4WsNMVKhWtx4PqcymVvxItV7VkecByQGYKRPWfR/0iQgYWphMWFsadO3dg7NjsxXauX5dv9cnJ0Lu3DAisU0dODMLDpSs/Vy6ZIjh7towViImROgHnz0vj36qV7MvSUt6bEQvwNKZNg8uX5X7iA9jXFJIfSeNvTtCeLkUK+hRoANZPiSdQKF5D1ARAoXiVSEtEXF9M4O14Uur8ARs3sfvQUu48uMOmPzcxImwEFWdX5MDNA5x9cJYyLmWwtbKlR7UenL21m8ByBbmYAh6n/PnMsxeXHl6inls9bkbdBOD27dvscHJgzLKNhkcmJyfTokULOnXqBKNGZS/us2ABtGwJYWGyxG9KCty9m3WykJwslwXCw+X5jz8G9/S4gwzjD7KyH8DOnc/+LYSAZs0g4pQU9ynSErw2mGfEdSmwq6Z88y/eybwqgArFK44m/k397FeAmjVrilMZf1AUiledlChSz0/CuvpEsLBixrEZDNk1hLJXy3L14lXK9ynPlQgpCmSBBXqku76YFewpCutiYU5yIb6qO5jRDUZn6brob0VpcLkBbs5uTJ061XB+/PjxODs7M3To0KxjWbZMvoH//LPx3OXL0LgxxMVBlSpynf9xNmyATp2Mx1FRzw70exbBq+DMEKg9H4p9kPP9mXnoBwXqS+OfK9/zPV+heAnRNO20EKJmTvcpD4BC8SqQGgMnBiAsclHj8x2E3L0PwOC6gznU4xApx1Oo2aEmFwZeQIwThI8MJ+G7BPrX6E85azjsBn+mFWI15QmND+Pbfd/y+OS/Xv567Nq4i6+++irL+TFjxtCvX78nxxQbm1X0JyREKvVleAEePJCxABlBeBkR/9OmwYwZRpGgDDf+4zg6wtPqDeh1cPZrOD8Gmu2Xxj8iQmoLmEJaAgT+LHUClPFXvKGoCYBC8bIjBFg5QuHmaJa2nDhxgmLFihkuNxzbkDh9HKcspKcrOimasw/OYjvRlvYFiuLrBj4JLnzd6z4lXEogEHxa+VMsfjD+949Oimbj6o20bNES93S3vDZeY9riafj7+2Nvby9L8e7YIfX18+WDfv2kIW/VCkaPhj17so771i059owsAQsLOQmYMAEyJhmffy6D/jRNZgxkpndvKFnyyd8jJRIOtpUFeVqdhDxV5PklS+BpGgWGttFwZgRYWEOjv9Sav+KNRk0AFIqXmbRE2NMA0uKgeEcm//wz0dHRWW7pnNiZ8SPGI7wF1j9ak+fnPGy4tIGGdlAjaAwDw6Bdq01omkbHih0ZXGcw89vN58KAC4Y+HKwcKBpYlBHDRxjO7f9sPxWLVcTJyUmeSEyURjpvXnj0SOb7FyokJX0nT4ZeveT1xER5v0t6oZ07d+TW0lK6+zOKAIFU+Xv7bZg06clo/+nTpUcBpDfg0CGIvgK76oBTWWiyM+vb+8iR2dcdyECfKidSLm+BZkLVQIXiNUcpASoULyupMWDtDHWXgbUzQgicnZ3JnWm9/MGDB+zZs4dFixYB8FnVz/AL8ePWlflsdrWk8z0dXVsu4VHSI7Tx0hX/SeVPcLBxoMrcKpzsc5KarjXZNGAAJYuXoHbt2oa+y9uWp0DTAsZsgMxBeUJITf8MPv5YCgFVqGCs7BcZabw+ebL0GvTsmTUw8PJl6QGws3v2b9G5M9hcgr2dwHMylP7c5J8RgMT7cLAdtDwOJbuZ11aheE0x2QOgaZq7pmnN0/ftNE1z+t8NS6F4w9GnwR4vSAoD5zKATMUbOHAgtrbGSPUlS5bQuXNnnJ1lvv/y95cT9MGvbC7uRJu7OvYnQsCDADqu68js1rO5O+wuqzquAqBEnhL4h/gj9HqmLlrEsK5dswxh8uTJ/Pnnn0+OLSRECv3Exhrd9seOQbFicv3fy0sGAE6eLK9PnAjdukGfPhAaKu9ftEhWBMyVK2fjLwSMKAv3J0DDP80z/nqdzBKwKwKNd4CFevNXKDIwaQKgaVofYAMwP/2UG5DNXwaFQvGviTwnXdQtj4FtQQCEELRr146bN28abtPpdCxYsCBrgF7IZqIOdsbrn1hOJsn/3j7HfQCwsLDA1cnVcGtPz57ULlobP39/IoD2NjZZhjFjxgw6duz45PiKF5c5/gULGt32w4dLIx8dLdX9ypWTKYNWVvDddxAQIA25a/rzJ02CAwee/TvExUH1inDkIwjZBO8cl1H75pAQIoP9hADbAua1VShec0z1AHwBvA3EAAghrgEF/1eDUijeWIReRrYn3AYr45uxpmkcO3aMEiVKsOD0AuJT4mkzvg0xVjGUrSz16nv4OBB7pCvNb6dy8lsoFyZTAE/3PQ3Ao8RHhv4+2/wZ4w6Mo45bHX777TeGzJyJ5efGN+sxY8Zw8uTJLFLAxjEKuZbv72+cAHz5pVwSsLSU0f8bNsjzvXpJb0GbNln7uHEDxox59m8RexW6XJa/Q/NDYO9myi8oibsJl34CxxLgtd48OWCF4g3B1AlAshAiJeNA0zQr4PUWEFAo/r+5tRbS4qHR31kK8wCMHDmSe+myt/229uNc6DkiDkfQ4dMOOE92JvTSdCblSWBl/m6cTYHqfeFKfqhYoCIF7OWbb7eqxrXvoIggWpRqwY2yZTm4aRM9e/bM8rx3332X0qVLQ48e0oU/Z47MAKhWTRr33Lnlunzu3PD118aGOp28x9paHi9aJAWBrlwx77e4vRH83oGO86Hu0iyToRzR6yBXXnAoYd4zFYo3DSFEjh9gCvAtcAVoAWwGJprS9r/+1KhRQygULz16vRDnvYWIu5XNJb1Yv369SE5ONpy7deuWyJs3r4iLixNJ1xaJR6tsxezdAwzXU9JSxNagrQJvRJf1XQTeZPvYQZaWYlTp0lnOnThxQsTGxsoDEMLSUogCBYR491153KOHEP36ZVQAECIqyrj/9ddyGxoqxM2bxj7GjhVi6FAh3n//2b+DLlWIMyOE+NNdiPATOf9ujxN2VIhDHc1vp1C8RgCnhCm23aSbpKegD7AeGQvQh3QVwZf9oyYAipee8+OFiLr81MtXrlwRaWlpWc71HNxT1O9YX+iuLRJik6uYtPUzgTciMjFS4I3AG/HBmg9Et03dBN6IVedXPdHvo0ePhIuVlbh74ECW8/379xeXLl2Sk5Lhw+Wfic6dhfDzE8LTU25BiHz5hLCyMhr/zJ+yZdP/vGRi/Xohpk9/+u+QcF+IPY2E2NdSiMSHOf5sWUhNECIqUAi9ToiEB+a1VSheM170BOB9IJcp975sHzUBULy06PVye2erEMmPnnpbq1atRHBwsBBCiGn+08SFexcEjoje4xG3lyEOnV8odHqdaLKsiZhyZIoYtnOYOBR8SOCNyDMpj4hNihV4IwZtHyQ7TEwUIjxcTJ48WXR1chL7/vjJ+DCdzjgunU7+idixQ4jNm+V+t27ZG3xHRyGaNZP7xYsLUazYkxOAZxF2RIhNRYU4N0YIXVrO9z/Og/1CnBpifjuF4jXE1AmASbUANE1bCjQFDgFrgF1CiLRnt3o5ULUAFC8tJwdCsU5QuKnJTbTxGt+4fEOBwA0Mb5XKLKf3sXQux8DtAynmXIw0fRoxyTHEfRuH1Q9W6ISOSc0m4XvTl17VevFhpQ+hTRtSduygVNGiTFg0gZ7He0r54IRwPnUowCwPD8qcOyeV+2xtZZnflSul+A/Iyn99+8L+/dkPUqRrBCQlGeV/QWYD5M4t+zp/3nhvkA8E/gR1lkDRd837DcNPQMwVKPWZee0UiteYF1oLQAjRE/BALgF8AtzQNG3RvxuiQvGGkhYvo/3LD5claJ9Bz549CQ4O5u3Fb1Pwl4KIcYLCV9fTscYNSl26zZm4GGafnA3AN/W/ITQ+FFcnV5YHLMfe2h6ArVe3sqjdIjpX7MxY37FodXbgM+cXypUrR49WPRA9pWRvgV8K0KZbXUpv3w4ODrJS39q14OMD48bJyQBA2bKQkY44fryxot/GjUYlPlvbrMYf4I8/ZJpgzfS/S6lxcPRjCF4mS/iaa/yFHmxcIFf+nO9VKBRPYFY1QE3TrIFWQE/ASwjx0ifWKg+A4qXj5BdQsBG4f5jjrQcPHuTtt9/mTtwdElITcAlcSkLArxyrPpE1If40LdWUwLBAFp1dhBgn/y9nKP7Vca3DudBznBtwjnKzyrHivRW0K9eOktNLkjY3jTVz1vDuu+/KFLlNm1i9fj3v/vEHBp3BH36AsWNlKt/ixfKco6PMz2/bVqb7nToF9vYy9//YMThyBIYNkwJAj+kKZCGk8GCRAAAgAElEQVT6ChzpCPnqQM3Z5kX5A/yzDGKvw1sTzGunULwBmOoBMDUGoBWwDLgFLAfaAFamtP2vPyoGQPHSEH9HrvWnxhvX2Z+Bv7+/SEhIMJ64NFmELckj3Joj9Hq9wBvxzZ5vBN6IglMKikK/FBL+t/1FTFKM2HtjrwiLCxNNljUR+/7Zl6Xf/fv3i3LlywmdTmc4p9frxbBBg0Ts9u1C/PyzEPXqGdf3bWzktkMHIerWfXL9v3t32cnMmUK4uQlRp86z1/9vrRdiQ34hri0059eTJIULEX9XiJRYIZIjzW+vULwBYGIMgKk6AD2Qyn9lhRDdhRDbxSsSA6BQvDT8sxTubgcre5OEaWbNmkVERIQ8uDgRcWMprabk4k4ZiEiMQIwTvFXoLQDCEsIIjQ9lRcAKfIN9af57cwr+WhDfm740W9GM5LRkQ7+//fYbQR5B+N70lSd0OlK++IKpRYrg2Lo1fPONFPkBWbUvJcX4Zh8TI6vudeggr+fJI5cB7t2ThXtCQmSBn5iYJ7+QPk1W4js7UsryevQ2/ze8tRbu/Cmr+Nnkyfl+hULxdEyZJbzKH+UBUPznPAqQHxPe+p9ArxcpAd8L/ZYKYvdfy0XdunXFglMLhD69r5N3TxrS/uwm2Bn28UaM9x0v9v2zT6SkpRi6u3z5sihYsKAICQ8RuoMHhBgzRqScPCk8QESBEE5OQiQnCzFnjhBlyggREiLT9zLS/r75Rna0cqU816mTEKmpQnh7y2M7OyF27Xrye8ycIMRYTYhtjYRwRGYYmEPIn0I8OGD+76dQvIHwIjwAmqYdSd/GapoWk+kTq2laNlN8hULxBLHXIe4fs+Ro27dvz7WrVxHnv+fKmQkUDrjMzEUb6N27N31q9DFI9NZaWAtrC6m6l5iWyNEeRwGoUrAKjUs2ptmKZkw5OgVq1IC8eZk+fTr9+/fHLZ8bFkFXYfp0rGvVIgDk2r+NjSzQM3AgXLsmC/z4+so4gF9+kWv+PXpAu3ZyoBs2yIWAcePktkcP2SYzYUegkA+4tYR39sIWX5lhYApCL/u1dpZv/QqF4oXxzHLAQogG6VtV+U+hMJf7e2Q1v5Kfmt3058mTKRWzEC1sN46tj7M+PIlGExvx5c9fAjBi9wiWBSzDt7svndZ2IiJJLhX43fUD4ELYBVJ0KVQqUImPq3wMf3Xn4b17rH3nHa6cPg2lSsHhw+h+/53vrawY5+srXfhXr2YdiJ0d/PabjOqvUwc++0wGAjqmG+MNG+SkQaQHE8+ZY2wrBATNgMBJ8PYycG0tzzdubPoPETAaXDyhxMdm/oIKhSInTK0G+Lsp5xQKRSbs3cCxlNnNdmzfTpGHs0m5v5V8p8+Tz6U8ezftxb2+O03KNgFgxbkVJEVFsDxgObEpsQDkt8/PyD0jEeMEJ7sdoXnpFlz85Ail8pSEoUOZ9/ffdOzYkULW1hAczNzhjUk5fBj3wEByAUyZYizvC3JCkJgojf9XX0HXrlLXH+QbfHS0zAY4dEhW9jt3ztg2NRaOfgTBv8uqhhnG31TibkJaApQfCsU+MPs3VCgUOfNMD0AmKmU+SC8GVOPFD0eheA248zeEHwPPn8xvKwQ7V3xLtfYavLudgQ5LKPprURJmJKD/QI/NBBs2dNpAx1LvMrfTMvKMWkZKenp+eEI4n3t+zobADXRe3xnx/fdSeEfTSNqwgel5c3Po0FEoUIDw+p4MWBtACNA/NFR20LYt7NkjU/quXYORI+X5lSuhYUPpDdi3T1b8A3B2llsvLyhaVL7Zr1oF0ZfhcEdZurflUbC0Nf93uPIbFG0LRVqa31ahUJjGswIEgNFALJCGLAUck34cAUwyJcjgv/6oIEDF/xt6vUzxS4kRIvaf52ivE/rj/YXYWVeI5Kj0LvVi265tomrVqqL58uYCb8So3aME3giH0YhcP+YSCSkJYsqRKSItXUL3YdxDgTciKDzI0PViEMXzI84tmyKD9kaNEg/ff19UA5Hm7i4D+JychDhyRO7XqiVEnz5CPHwoRHCwLAaUUSAog5kzpaxwZm6tkyl+1xeZ//2FEOLqPCFig58vYFKhUAghTA8CNMmIvirGPruPmgAo/t+4u12Io92er61eJ8Sx3qJRVWcReM5YBa/BkgaCyggfHx8RmRgpXKe6CrwRabo0MWrPqCeq/KWkpYj3/3hfXI+4LhJSEkSBKQVEfHK8qARiadtG8r/88eNClC4thKurDLFr3FiIFi2kfr8QQjx6ZDT2b70lsuT8X71qfBgIcfGi3NelCHFqqBB/lhQi4vRzfP90g//PSjkBUCgUz42pEwBTpYBHa5rmomlabU3TGmZ8/gcOCYXi1UOvg9gbUKQV1Jptfnsh4ER/iL3K2m1nKVfZuLo2w2sGjrcc+fTTT3H52YWfmv5Es5LNsPrRislHJ/NRpY/QxmtM9ZtKcGQwgWGBbA7aTJo+jVxWuYhOjsahlwOxZYrT/eO+stPRownr25du9+7J4wMHpL5/SAj4+UGfPjLILy1Nrut36yavz5qVNcJfCKhUCRLvw75mEBsErU5B3urm/waHO8KjszJg0rGE+e0VCoXZmBoE2BtZCGgXMD596/2/G5ZC8Qrx6BRc8JZpftZmJswIAaeHQPRFVt/rDtYOWGRKkXt39LsklEzAOY8zX9T6gq5VuxKXEkfZvGUB2Hl9Jw7WDozYM4JSPqXwnO+JsJpAOUd3EoZ8wU6/UjTY7sSQoUPQIiOhdWsYNQpHPz962dpiSEwsXVpuAwOlpr+mgZUVbN8Ov/8ur3/xhbEeQAZhh2FnLf6PvfuOjqpoAzj8u9l0SCWQUAQSSmgBQu+9ioiK2KiiICLSwY8aOkgoUqQpKgjSg0qRJr2FXkLoEFpII5WQujvfHxMSQgKkgzDPOXuye8vc2T3izJ37zjs4tYDGm8DMPnPfP/Kq/A2qzZLR/oqi5JmMBgEOAGoCR4UQTTVNK4fsCCjKm0sfB4F7oUhrKFAr8+cLAWdHQMghaPYvN6bPo+UTjb8QAodLDqyat4r6S+tzzP8Y4THheN/zprh1cUyMTAiPCydseBj5zfLTd0tfFr69AIxNONmoDMuuLCIhGK6HQt+efWXjXb06ca1acQZoAjKy32AALy950V694O5dGDdOfm7bNmWK35MMerj4vVzJr85vUKRN1r7/qYFQbTZYl838+YqiZEtGUwHHCiFiATRNMxNCXAJcc69aivIfEHMf7m2SDVkmkvwk85kE97ZA0+3ECXNGjx5NwYIp62sdO3aM2NhYGjduTHhsOAArfVYCcDv8NmULyEbTbrodC44t4KdTP6FHJs5xq9iUudtgUxj0GNAXMz8/aN0a3n8fv++/57devWD4cBnh/8cf0Ly5vGiNGtCgAbi6wuXLaessBNhqsK0J+G+TQ/6ZbfyFAS7OkKsiNt6sGn9FeUkyOgJwV9M0W+R6ADs1TQsD/HOvWoryCkuMgWuLwbU/1JyftTIuzgC/FdBiP5gVoEXDhixcuJCEAglUW1IN4SGYMW8Gjg0duRNxB3cnd66EyiQ9TW7AnuWgjb2AkZERBgwM2D6A6JHRRMVFYVOjPqYXLxMARAZaMmTOApi/GPR62L4dV2DJnTvQsqXM3PfbbzKhz5EjMqlPvnzg7g4FC8qOwJPu74A5+aFwY6gyDowy+r+QJEIAGmgmIBKy1nFSFCVHZOhfrxDi/aS34zRN24PMGrot12qlKK80A+hj5Z2sltFBtCdcWSBfLfeDhSMA27dvx8LCgoi4CKY0m0JUVBTrN6yHb6DEnBIAOFg4EBITwsjR29h6uA1iAnRc8x5eF72Y3GwyGhqj+5XH82ow+a2t+fHrr+kSEUGBAgVg8mSwt+dwsWIsuHGDFQYDXLokX46O8vFA06ayQa5ePe2wvyEBzo4Gv5XQZhM4NknZFxcHwcFQrNjzv7c+HnY1hiZboNyAzP9uiqLkrIxMFQDs03mZZOTcl/1S0wCVHJMYI4R3HyHiI7JexrVfhNj4Vqo8AfPnzxe3bt1Kddhoz9HiPRANe8iFffwj/cWh24cE4xDH7x4Xbw1EtOks9wW7u4pJDRC6MUlT9RwdRTSIglZW4vJTS/cmJiSImyCn9+n1cuEfvV4IPz95zM8/p0zteyzqhhDbagux520hYoLSfqdBg8Rzl/8VQi6GJIQQkdey8qspipIJ5PBywKeAYOAKcDXp/U1N005pmqYyAipvBiMzcGoOjwwyY15m+a2Cc6Oh2S74/heZPQ8wNjbGyir17IGNf2wkuKHG7dIOiHFwzXMEMw7NoIVzC2r+XJMfem3AWA9iHDicvsw71tXxHx4ol+f9+muWA3UbNaLs/Pkyer93b24D/4wfT0lfXzh8mFpL67Do7C+cDDgNt2/LC48ZI6f2PXZ7PWyvDcU/klH+5gXlKMH69SnHzJqVfqDgY/ERcGqIHDWxKpX5301RlNyRkV4CsAho/cTnVsAsoA7gnZEyXtZLjQAo2WYwCLGvQ0qCmqVLX3zH+7TbXkJscBQi7Lz8fPasEEuWiJCQkDSHnjt3ThQtWlTYT7EX/bf2F607y7v3ml+mLPVbaUElsb8YItDKSNSa7Czrk5AghE4n9CDKWluLvcOHy+3W1kLEx4sVDoiFj0cDhBD5p+QXP9Y3E9HWFvLC588L8csvQhgbC3HisBzt+MtFiJBjqSs4b54Q/v4v/s6PAoQ4PUJl9VOUPEYGRwA08byeexJN004IIWqkt03TtDNCiFd2Am+NGjXEiRMnXnY1lP8qQ6IMdAs7A7ZVsha05r8djnSFpv+AfeoBsxYtWuDp6Ym7u3vytgEDBmBlbUXD7g1pXbo15wPP03NMZVyafsCd6PucvHeMqAl6TA0QuXUrNsfe5hOLOvzy9VYstu5g0/79jFuwgBOA1rIl7NxJfFwcOjMzdAC3buFvZ0zRWUXRd/LB6LwPfPxxSqW+aAPv3IRC1aDWYrkUb2bpYwENbq+Fkl1UsJ+i5CFN004+3WanKyO9BGAH8B1QIuk1HNgJ6IBTGSnjZb3UCICSLfs6CBF8NOvnBx2SufGDDqa7OzExURieuEO+GXxT2GqIIp/LO/0B/wwQp++fTr7zrzC/grhsn3QXf/GiECDGNUYUnl5Y9HxXbm9gZSVWaZoQFhbi8bP/33/+WXzTu7e8y4+KEgaDQey5uSd1ZQwGIa4tTcnln9U799DTQvzbImvnKoqSbeTwCIAD4AE0SNp0EJgARADFhRDXMttDyStqBEDJkvhwMLaC+AdgVjBrd7Bh52BPS6izLN258hMnTuTTTz+ldOnSHLp9iPrF67Ny5Up++aInBUeV515RKw7eOQiAsZExiYZEgqZDwVpN5Fz9iRPls/vQUHyLmlIoXyGqdy2Izguu5M+PsaZBlFwqWNy4QYyLC5Ygn/H7+KSuTEKkTEccfh4arAGbCpn/vnGhEOELhRrI38/UNvNlKIqSbRkdAcjoWgAhQohvgYZCCHchxLdCiGAhRPyr3PgrSpadGQH3/gLzQllr/COvwt62UH3uMxPlVKhQgUKFChGbGMt78xsQERnM0qVL+Wq6J6tHn+aTSp8wp80cmpZsSqIhEc0AZtNmMOwDKzZ1qcUn3zgRv20ruLvjPrci89cOI/6WE0MKO2H88KFs/B89YvuWLfx97hyW16/L/P4+PrBnT8r3enAC/qkmh/pbH8ta4w/w8AYE/ivfq8ZfUV55GR0BqAf8DOQXQhTXNK0K8JUQom9uVzC71AiAkikxAaAZy8bQyCRrjf+ju7CzIVQcCaV7pXvIzZs3KV68ODqdTm7QNK516kS9vXu5ExyMWc2axBzax8N2LenieAjvija4X4pgzzJw7QeilAtXBt1AODmhhYTgW0BAoJ76VpbcCwjG0tIy+VonNY24X3+lXo8ecoMQMGMGxMZAJyu4MFUuYlS8U+a/K8hshhE+UOG7rJ2vKEqOytERAGA20Bp4ACCEOAuo1QCV18+tVXB3I+hMs9b4x4bA7lZQ5utnNv4IwfCPP+bsmTOptv1SujRdu3bFzNsb/fJlWE6x5MZ9X76o0IWIuAjsGrehem+4PB+22n4DgDZkCHTqRIVAPTOAwVGPsIyPh/LlYdEi/DWNCkA9vT7lWrt3w4ThUPcw3FoNrb2z1vjrY+WjA/vqUPTdzJ+vKMpLleE8nkKIO1rq/yHqn3WsovznPLoLsYHgOjDrEesJkXLYv1gHKNlPzskPCEi7gl5cHOuOH4cyZQBINCRy8MYB5s2civeJcwS5OHL1wVUAOn1mytbZKzDrDV49tzG2gzXauEicfIZwv3FjGDYMgLt16vDnsWNcMxhkyt+wMAgMZFnz5tgXL85X7dunXP+vaeBpDAWqQJVJcqQjKy7PA00H5QeDhVPWylAU5aXJaAfgTtJjAKFpminQH7iYe9VSlDwW7gMPr6eZppdhiTGwrwPY14AqU2QjnJAgc+s/ZfDIkXzh40NFazm9zmSiCXbXrKgcD6UHDaB/Z3sqLNqArjX4xwRSKRgWiXbU/mILqxtP5vrDv1g5ZT+cnA9ubkTbWPLD0aN0R6boZPx42bmIjmbErl2IuDgwM5Mr+PlMhCY+UGdT1lbwA7kIkGUxKDdIdgAURflPyugjgD7AN0BR4C5QNemzovy3PbwJN1fIxrBsFv+TNiTCoU/kXXCN+XIEwdgYoqPBKO0/sffee48SJUokf/625reY++bncAcw/XcP+05soP8xSBweReJE8KvlSoXfttDJF5x7DGDlBkFiQjzee+XKgMuKPmKpzohBIJ/v+/rCwYN4WFjw7/r1aObmEOkHu5tB8AFoeyrry/eCHOlIfCjzI6j5/Yryn5XRxYBCgM65XBdFyXvCAIb4bJwv4MS3YIiDuuvB6Pl3xGfOnKFGjRocCTjCoZOHqF20NgH+AURci6Bop6JErL7A5kchFLIszZCp7+A4qRMtoh2pNfUy+0sABgPixg2MBVSq2JSg8iuJ8L1De51G8ccN9K5dAHx66ZJcCMhnOeyqA2W/hQr/e2Edn+l4H5kSuMRHWTtfUZRXynM7AJqmjX3ObiGEmJjD9VGUvPHwJlz5Edw9s5ef/tJsCDkELQ9m6Fn6woUL6devH3PPzmb80C2sXzIArxXreEcPM382x+Z/Nth+b8tRPqX2lFU0/bUJn99aR7y9LUOPhKO3tSHmzk3yA8YDBmF98Q5zgR1duqRcRAgOTp1K+Z5dsL3pgf7eJnQN1sv5+VkR4QtWrlBhhBz6VxTltfCiRwDR6bwAvkBmBlSU/yZzR7mkbXaGsO/8CZdmQuPNGU6Xu3jxYr6/+j3uRatTNRDGNBhNiX3QxdyYEg3fST7OeOBghraEao5Vmd92Pj+7PiI6nym68AjyJ8pjzM77sqxYMaoBPwUuQ58U6T99xzj+8RyF/5qGHLq+mQI+d7Pe+IOMG4i4APlLymF/RVFeC8/91yyEmPn4vaZpVsAA4HNgNTDzWecpyisrJhCOdpeNdtF30u43GNJ9bp/GgxNwrBc03Qb5iqfeFxEBGzZAz56pNvfo0YMBAwZQzqEcLnYuIARHd+7EwtaWw+7hWBxazsFdRZhVcywfT63JtZ3Azh9Y7wofXoY4l+IwZjzUqQPly6M/dYoZ1aqxFGhcBxwOTiYy5gFTNizD8GM+zOt7QomPCM/K7yQMcHYklB8O9VdlpQRFUV5xL+zOa5pmDwxGxgAsA6oJIcJyu2KKkuMMiTKzX9Vp6d/Jdu4Mf/zx/KVtAaJvwf4OUPvn9GcNHDkCX3wBLVtCgQKQlJTnf//7HyVKlMDdImXhn1+XLuXz8HAsqzam3a59vHNoGmIcMqAPuFPclg8vyybczNgc8ueHcuVACDauX48DELNjMQdcK3DdbyvNo9bR6t+HLGq9iHJZfVavjwOdGdi4gVHaWQyKorwmnrdQAOAJXEcO9+fPyOICr9pLLQakCCGESHgkxJbKQsRHPPuYyEgh7t59fjlx4UJsriTExdkp2x4+TP9YEKJ3byGEEHv27Em99G98vIjs1ElY5LcQ7UdVEQLE0ipy4Z4KX5O8iM/jl/cdbyESE5NPNxgMokaNGmLjxo1y0Z7L84VYX0CIy/NFwP37qRYYypTEWPn94sKydr6iKC8dGVwM6EVjnUOAIsBowF/TtMikV5SmaZG52TFRlBwT9wCMLaDZzuc/q7eygqJFn73fkAAHO0GhxuA6QG47e1belYNsqiOf+GdhMMDixQBs376d4OBguT04mLDjB1i3bh3iLT0HEs4CsLqeFQBTAiqwZWK35GKGtzai7MQf5dRCgF9/Ze+OHUSdOEFrvxMy+dCNZdDyEPN3CEzNzNAyG9tg0IP/P/LOv+UBlctfUd4AL4oByGieAEV5NQkD7GkLDdenfVafqXIEnOgn1wmo/kNK8GDlyimN/siRMG2aPLZ2bdk5iI1FCMHUqVNTyipUCEsj+BUYGhbP7PzmQCzlb0RhN9KYsCm+PNrki2jQAM3ZmenLl4OmcWXRFIb80Z5NPTfzfalS/PjDp5iYTebmxeo49zlCnN5AeGgolhYWmf9+iQ9lWmDH5qrxV5Q3hGrglddXxEXZAWh5MHuNP8ho/5CjcqncJ+MHNE2OHABMngzxSTkF/voLLl6EuDg6tm+Pt7e3zAyoabB3L7c7dsLX2IixAfCT1oErU4YyZzuEmyQSZaahM0DUpg3w9tsE9e7Myc/bUKJVJ477H2eGG/R65w5NnU+geTnj/M1JMDLBfLQ5oz08MOvQIePfK/o2HOkuR0bqLpNrICiK8kZQHQDl9XVhslzfPruN2u0NcHkONNkCJlbpHvL15q9xmFEITJJyATg5gbMz9OjBoi1bqFq1KpcirnNtylBo1Ijf1q2jW6KBLzvn49MxayjruZTzlRwZFl0V6xGCpXVMMZr/I+f/XMLh/X/Qq3YgZs6lCfh0KZ/3hpKOzhh9dBXd+JUgBLGxsbhscOHhzZvg5fXi7yQExAaDRVFw+Vxl9FOUN1CGlgP+L1PLAb+Bgg+BVRkZ8Z9dD47D3nZyup99tWcedjnkMg9/XUz1dQfh2LHk7Vu2bKFy5co4LfwR792/08DbH31cHCXMzPgHcAMSHOwxCQkF4KY1OEcI0DTC8+n41U1PU6/TVC3gDKcGkeCzjo5LBL9u88P+uxFoI0fKjgag1+tTlhd+kdCTcG6s7NQoivJayenlgBXlvyP4IERdff4xn30Gb7/9/GNig+FAR6i15LmNP4CrgyvVa7QH95QpfmgaV/bsITo6moS5P1DP2x+ArRXLYWYuG38+/xzx+++cOLkZvyKWxJlAkZlF0MaB7cNEBh0RVCUItrqBkRn/6/eQCqXfxWFeQd5tFgDOzkRHR9PzqZwDz/TwBtz9S05fbPRnxs5RFOX1lJGpAv/ll5oG+Aa5t02I4CMZO3bzZiHWrHn2fn2CELuaCXFmZObqYDAIMWaMELGxIq7zZ0LcuSMS9AlyWp7BIESvXuLjYsXEwHEDkqf4bS2F+PQDhN5IE1NaWggBYtA/g0TDHysJ0RMhVjoI4b9DBPXoIexsbYW/v78IiQ4R0fHRQgghHj16JP766y9xI/SGsP/e/vl1C78gxJVFmftOiqL8p5BD0wAV5T/EIIP+MqJdO/joOYlyzo0BzQhMPoU9ezJXjYkTOXZ2K2Zn/2Cbjw8Tm5nwdyNHHsSE4lDUi60REfzwaA7aODjwVVvaXoc/vECPoOfROABmDZnN/ngf0AGJE6FwS+b/9hsfNmtG4cKFKbB9P5Z9vkWv13PhwgXeffddAJlhMD1+q+R3sqkAZb7K3PdRFOW1pDoAyn9f0H64tgSKtIWC9bJf3p2N4PcH1FsFc+e/+FHBkzQNhKBGzQ5c2XmFpvXrM34fdDgYjDh3joTTsbSJimKdv3w8N9A9kJv3fFlTAUwM4BhvYP9EU/garpxwwudvDbr1ITo6mgUODgx9PJ0wJgYCArh16xbTp08HwNnOmeO9jqeuT2wIxATI38a1f/Z/G0VRXhsvpQOgaVonTdMuaJpm0DStxlP7Rmiadk3TtMuaprV+Ynt1TdPOJ+2bq2U604ny2rJ8C6zL5UxZkVfg2FfQYB2YO8CiRbKxfZbHA/lP2fT3JuIfxGOWLx+8/z5NusO1YhZEHo/mc+DDFSfoXeVLLL1PUfj9LnzsC22+h3vzIbgQ0DuUst2XU+mWvPbSpUtp1KgRZcuWlRf47DPYsgUXFxfWrl377PrdXA73Nsm5/TkRFJlBYTFhJBoS8+x6iqJk3ssaAfABPgD2P7lR07QKwCdARaANsEDTtMdhzQuB3kCZpFebPKut8mqK8IUT30J+ZyjUKPvlJTyEAx9AlUngUCtj55QtC/b2qbfFxxP988/oK1UCnQ5272Z8aGV++KwuhWJsaJl02JqjP1M631v4G9/Hd0NFVhS34aLrYJp08QdTO2jVCqZNI+HBA2bOnMl336VegPP48eN07do1/Xpd+0nmLSg3CEr3ytzvkAPsp9vTa1PeX1dRlIx7KWt7CiEuAumlK+0ArBZCxAE3NU27BtTSNM0PsBZCHEk6bznwHvBPnlVaefXkc4biH+dceacGyej4UplouA4dgqRleDl/HsqV41GtWnx29ixBtiZERifQqmMEnWIjeWuLRleTGPR21hiHRVK/Qgvant2FzVdwQe9E9SsRBLw3FhtzGxL0CTyIuo+TVWHWhoTg4uJCrVqpOyXu7u6MHTs2+bM2XuNj57dZ3XUz5C8l7/hf0kCZ8Hi9pxcryuvgVYsBKArceeLz3aRtRZPeP71deRPFhsDu1jIjX2bWudfrZYP44EHaffc2Q8AuqDEvc42mpoG/v8zyV7kyDBnCsMREVo4YQaGufVixaybVA2DgH34s0Ql6xsVzyDqSy93LMTt+Nx+ZQeT5dtR5ezt+gwOwMbcBYOS/Iyk8szDCYGD6/v0MHz481WVv39FgQgYAACAASURBVL7N7t27KVOmTKrt3eK2QugJcGoG+Z8REKgoikIujgBomrYLcEpn1yghxF/POi2dbeI525917d7IxwUUL57NFLDKq0UY5LN59+lgZJK5c3U6aN8+JXXvY7HBcKw31F/9/MWC0jN9OsyYId9HR0O+fMy7d49EnQ6cnHi//2m67IKdJiaUTUjgcusChHR4QFWbm4wMy883Vp/jNnIO98bEcz7oPG22XIZ9+/D8/HM8PTzZunUrAG3apH7iFRQUxPXr11N+k2tLEKNjEQY9mFhm7jsoivJGyrURACFECyFEpXRez2r8Qd7Zv/XE52KAf9L2Yulsf9a1lwghagghahQsWDA7X0N5lRgSYUd9GdVuVyVrZfz9N5g+kRpYCDjeB0p2zlocgacnHD0q3w8dilepUhz18sLUyQmEINgollhj+C0hgSnNdLT94AFVitSm1PV4dsXa4uoXzReeDTE2MqbtyrYwcCDcvg3x8YjISCa/+y4jhg9P9bgsPj6eatWq8fXXXydNe9QgNpiwqDsYTclHvD4+a7+NoihvlJcSA/AcfwN/aJo2C7kMcRngmBBCn7QEcR3AG+gGzHuJ9VTymj5OLlXbYA1YpDewlEV+K2Tkf72VmTvvzBkID5dpfzt0gO7dYeFCrPr3x7J+fflIAPi3c12+sIf+Q6CmqR6TqRBs4s0lfyj77W1Ml/zMUP9zXAq5xLQd8GjSOCxHeQCwf+dOggwGOn2cEuew8/pO/vzjTywjLfGcMgZ2NYGWh8BtDHbA4Z6HMVUL+iiKkgEvaxrg+5qm3QXqAls0TdsOIIS4AKwFfIFtwDdCiKQIK74GfgauAddRAYBvloOdZFR7dlf1e1JsEJwaDPV+B5155s6dPh06d4bvvoNy5WDZMsIvX6aZtTVVq1UDY2NIeMigBcMwHgX7zmqYrKtEQrg1g1qD36+ziTQHbRxUWFIZB0sHjARsvr41+RKTPT35308/oTNO6acvO7uMC0VOM6FfM/m4ovHfYJyy/G/dt+pm91dRFOUNoRYDUl5tCVGgs5Dr1ZvY5GxU+7GvZcNffXbGz7l7F956SwYUGhmBo6MMKoyKYsKkSdiYmDAg5hG0doDIH8G+Hi06raWVrS1Dd57CKD4BSpcG4HrodUrPK42zrTMX+l7gXOA5qhWuhonOhOPHj9OxY0euXbuG6ROPLLZs2YIlD2haYC/UXqpW8VMUJY2MLgb0qj0CUJTULkwGK1co9XnOlht+Ae5sgHcuZfwcLy/o2BF27JCNf1CQfJUtC5aWjAX0n7WCYrvgvA5Kjudq45H8mw/+7R1K2Uenea/ce3yw5gO+dP+Sfbf2oR+rRzdBR0HPgtR7qx47uu4AYPLkyQwbNixV40/IUaqJ5dwuOBhqd8vZ30NRlDeO6gAor6bEGEiMArcJcrpfTjs9DCqOBDP79PdHRICtLcTHg0nSbAM3NxgzBlq2lDMK+vaVHYCAALw2exG5cxw9Gu2ArcBMA/h2ZBkjsatuTeikSDj6IyypwjHvjbg7ubPOdx3D6w9nXad1uBZwxdbcFiEEczbNwdvbm+Urlif9Fo8gPoz7MQ4UqDmUwo41c/73UBTljaMeASivJr8/IPwcVJ2W82UH/AvH+kC7C/CsgLnERNnQP7kQkMEgG34fH/Dzg/LlweN/EL6Ok5VAH12QGn4uaBsPoQ0ejGHCBJzfeotm0zsyoMaHVC1dH+HsjBYeLsvSNLTxcgj/ceKcqLgorGtaM+08zBwKQZ4CbvwGj+4ybn0iJUuWpEePHjn/myiK8tpQjwCU/yZDIkRdgZKfgfgkd65xdSFUGP7sxh9kEN+pU7BggbzTB9n4Dx4MFSqApQn0LQUfmBBi2YhyTWeSr0gNvtnyDT8aG0O7duzt3Ru7qCjm9JiDmbEZGJth3i+cL07BLH0c5sYy8PDYl8eSLxt4JxCH+w585ebEt916w/2d4NwdNI1xleTy3YqiKDnhVcsEqLzpIi7AhaQV77Rc+M8zIRICdkLxD198bLNm8GT63cuXYdxoaG0EW1yhQ1mYmMCGubH88Ot2qFWLH9ZGcvvMAaheneVmZpj2rInN9zaYTzZHG69hb+OEab8BRA3uR8/RbjQs3pDKjpWTL/H9998z8JsvsD17Fkun6nKhI01j1KhRHDhwIL302YqiKFmiHgEorwYhIPhAzizq8zR/fyhSRL6/sQzuboRGf774PE2Tr6go+LIHuAaC41F4ZA81v4c+34ODA2zZwpFwH0puO0rhcjUgKoqYdu0oApy4dQ0LWwvKzC3DI/0jdnfbTfPlzbkxW3C4d1s65/uHMY3GMKHpBLyOetG9TXdCvFpgVuFbmc43yblz5yhatCgFChTI+d9HUZTXinoEoPy3JITD5blQoLZM+JNTwsOhaFGIjQUzMwjaD4WT0ur6+EBwMDRsKBt6nS71uQYDlCkCt5ZA7fUgCoHxILApA417APAnELZuHV/d/YqP3T7h94aD4P59NrdsSQ29nlIlSkO/fsTYPwIjOBd4Dk3T8Fz5NVOaT2HSsfmMajQKhODM6q8pUNcMs8arUuUlOHDgAG5ubtja2ubc76IoyhtPPQJQXr57m0GXDxquz9nGH2QkvxCy8QfAAEamclvNmnJtgHz55Nx+TYOwMLmvpTOMLwpTY2HBYAjqCJF9wawi9OoFtWsD4FayJNWsrYn3SOT3DsvkrIAiRVhhacFnXbqAhwfMn495InxQ7gPMjM34tNKn/NjuR2zMbZIafwNBwcFo/lF4L9yFNsmCf2/8m/wVNm7cSEBAQM7+LoqivPFUB0B5uYQB/LdCfDor9OUGq7JyFoBeL0cFPvxQpvUNvA+tXODeQvjHHXolQMOPoP1lqPErTFkPMTEy5S9AqVIENmuG5dq1VOnUiblDG4FOR8K333CgIOzYtYMPPvgAxo2j0dKGxJjC7DazMdWZYvFE5j70sbCtOj/+MJWQgp/jWLIqM1rOwM3RDQCDwcCsWbMoV65c3vw+iqK8MVQMgPLy3NsKdlXBskjeXTM+HHa3hJAH4H0TOvcAr9+gkgn4J0CTr6HkB+DYLP0gxL59YdYsMDdnw4YNnD9/nnH9+nFVC6PVxLKs6/MvZw/dxOMnD/b/sx8XOxfyTcnHo4RH9K7WmyWnlmBnbkfosCAI2gtOLQi750Ppyo05ffp0qtUrhRDUr1+fFStW4OKilvZVFCVjMhoDoDoAystzaQ44Nsn6yn5ZZUiUMwHiw0EfI1MMF2oEm/dBp04QEgLVq8OKFdCggTzHxwcqVXpmkeXml6OlS0vmvT2P5s2bc8TpCDFlY7j8zWVcf3RNPm5so7FM2D8B8V0Q1/99j9X5WxP3byL+/v78/PPPacoNCAjA0dFRRf8ripJhGe0AqEcASt4LOwOB+6DcgLxv/EFmFizSFkp+CqV6QvGOYF5QTvv74w+Z6vfWrZSgQINBZgEsWFDGCTx8yObNm/l+ypTkIkc2HEm3Kt24d+8ep0+f5sHPD/j9vd8ZuG0gAOMbjwdg49EJbHJxBPOCrLV+hxN+p1mwYAFuHd2YtH9SqmrOmzcPS0tL1fgripIr1CwAJe/Fh0Fc6MuuBezbB02aQKFCEBgI9vbw6ady3+O/IPP+R0bKgMJSpcDSktq1a+Pcvj3UqoVo3pxuVbqhN+iZ88McwkqEUX95fU4HnMZYM6Zvjb5M2e9B/0odKP9WM0pa27LGZw0jGo5g0r5JWL1tRbx1PEduHUm+ZGJiIqGhoVhYWBD4MBCnmU7ox+oxyo3cCIqivJFUB0DJO7HBcPdPKN3rZddEcnSE4cPl0r7x8WD6jMyA338P//ufnB0ABAUFERwcTMX794mwNsN2ghGtS7Vm+/XtlFlfhn59+jE/YD4AtwfdpsisIryXDyYUdSJ/jW+os7QOJ/xPYJpoyty5c9m/fz/lypVjWP1hyZeMiorCw8MDAFvNlh5Ve6jGX1GUHKX+j6LkHUMc6ONe3vWFgGLFIDRp9KF8efls//59sLaGmTPTnhMSAuvWyfOS+Pr6sm7dOnBywsbSDu8vvNl+fTuEwFW/q4zoMoJPK8oRBMPtDYR/9guJRd+h791Iph6Yygn/E3xU4SN6efSiWbNmaSL8o6OjqV27NrGxsQCYGZvxa4dfc+c3URTljaWCAJXcZ0iAizOg3KBUCW7y1C+/wJo1cPgw3L4NdnZyu6bBjRuwbZuMAShaFC5elDkCAM6dgypJcQpJC/j4BPlQqVDagMBx48axw3cHRyoeYWX7xXTb9BWVzSBRwLkRgjG7x1DavjTdq3bn0aNHuLi4sHPnTtzc3NKUlZiYiLGxGqBTFCXzVBCg8uoQBjAyAy0PGrQ9e2RD/TQnJ3B2lml9Hzf+IEcFnJ3hq69g7lxYvDh1/v/KSXn6p04FTeP3jb/j1sGNtT5rafhLwyeKEaxcuZKeXXsCYOs7kbV1u3JdWHM+Xh4zsdlEuleVeQSWLFlCvXr1iLaLTlXN0NBQevfuje7prISKoig5THUAlNx1cRbEBkL5wTL6PjcJIe/ir1xJu+/tt2HRIhgzBh4+TP/8BQugR4/kZ/3JPvgAPv4YgA/bfMiV5Vewt7SnqHVR9t/aD8DjUaaGhS5jZwQf+d2n45Hf8f3GlzuD7hAWE4Y2XkNv0BMbG4unpycDhw+k7tK6xCbGJl/K1NSU999/X0X+K4qS61QHQMldZgXAOH/eXEvTZOP9dNa8kSPlPoBJk+DmTfm+USPYuxc++0yODAgBTy6207UrnDwJGzaAszMhISF4e3tTpkwZWri0wK2QG41/a8xPJ3/ij5W/0rlzZ0yFHlfrwtwaHEgH1w40WdaEYtbFsDCxoLJjZXRGOn755Rfc3d05nHiY/rX7Jy8L/OjRI65evUrbtm1z/7dSFOWNpx4yKrnDbzWYO4BL97y5XmQk2NjIdL3mT8UZDBwop/tpGgwdKuf0gzwuPh5WrZIvkPP/t26VnwMCZIBgkjt37rB//35MS5ny3a7vOPD5AUY1GoXZOI0zb+kwbnMY54q1cPS7gYOnA6d6n8Iv3E9eytics33OEhMTw5QpU/Dy8uIYxzB/IibiypUrLF68mEWLFuXiD6UoiiKpDoCSO/K9BSZ5uHqdlZV8jm9uDkePyuC93r3lvkKFoFUrqF8fZsyAkiVhwABITJT7hZCL+OzdK6P9L12C/fvlDICkEQEhBO7u7ri7u7PPbx/GmjHER8DdjWxpsJO+HkPZM0TGDjQp0QSdpsO9sDvuhd2JTYylxfIWmBiZ0Cq4FdWrV6dWrVrUIiXWQAhB1apVVeOvKEqeUR0AJWeFnobA3VB+SN5eV9Pknb6pKYwfD/Pnw4MH0LmzDAA0NZXvb90CY2O5GJBOJ+MFSpWSnYSPPpJl/fCDfD3h6NGjzJ49m7Vr19K4ZGP2dNsBiY84cWUt03+Kp33HboBsyAftGJTq3O8Pfs+hO4cgDg79eIjj+4+nqf6GDRs4evQoM2bMyJ3fR1EU5WlCiNf6Vb16daHkoUf+QvhvfznXvnFDiBYtUj6DEE2ayL9PbrtzR75v0kSIX3/NUNF6vV7cvn1bfri/S4iDnwghhHCb6ybM8puJu3fvCiGEOHT7kGAcovis4iImIUZMPzg9uYypU6eKjz76KN3y4+LiUspXFEXJBuCEyED7qPIAKDkjMRrOj4PKk0BnlvfXj4iQqXohdRS/Xi9HAgoVSntOcLDcnpAgRwWeWXQE27dv5yQ/cT7gFFv7BUFiJNpUe/AFm/M2DF00lN03dzOz1Uw+Wv8RV7+9ypUHV3Cd74phrIHIyEhKly7N/v37KV++fKryjx8/TlxcHA0eLzykKIqSDSoPgJK3jEzBppL8+zJYW8t0vWFhMrAP4MQJyJ8/bVDgYwULys7CCxLuhAQHcu3aVT53bUsRYyMWnlwCpnZ8Vf0rOA+tOrRi141dFLcpThGrIlwLvYY2XiM2MRbhIdA0jdmzZ/P222+nafxBdjDCwsKy+wsoiqJkiuoAKNl3cSZE35YR/3k5fz08POW9psln/z17glnSCMRXX8m7+2fl+M8g5xBPRnarjKFIG5YGhxAaI1MJf1f9O4z9jFk8fDE6Ix3NnZvjNNMJI4wwNTKl+fLmADx48IB58+YxduzYNGVHRkbSvHlz2rdvn606KoqiZJYKAlSyz6IomOZhxD/IIX87O4iNTWnwmzeHgwdTUveePCn/XrwIFSqkTfDzPELArVVciq7A0NHn2LxzMRU0I4SHLOPbrd9S/HZxEoslYj/XnruD7lJstlwvQO+hT1WUp6cnDjUcsCtil+YyEyZMoEKFCvTs2TNz319RFCWbVAdAybrAPZAQBSU/yftr29ikfXbv5QXLlqXM83/MxQX++EO+1zR53Pvvp1+ury+UcwXNCCJ8KVemEcvX/gOaEdp4jYvfXKT2z7WJjIuk+I7iNG7dmMKVCmNrbsuA2gMY32R8quICAgJYsmQJYT3CuBd5D3sL+1T7PT09SXw8HVFRFCUPqUcAStaZWIOJTd5eMyoK1q+X759+dl+woEz007p1yhz/06flCMGncnU+Jk+GatXSLzs4GKpXhG3VQB/LozIjmbd0I3ZJawes6rgKZ1tn+tfqz9aPtuJ/xp+6Leqy2mc1Xhe9mOM9h16bUi91PG3aNLp27YqYJSiUr1ByOmCA6dOnc+bMGUxMTHLkpwEIiwnDINJZC0FRFOUpqgOgZF5sCPh6gl01cGyct9fevRs6dUr5LIS8q792LWVbRASYmMhlf6tVS537f+RIKFEibbnxYRB3GGIENPkHjC2IjIwkPj4+OS//J5U+ofny5kw6MIkTh0+Q6JDI1A5TKWNfhm5/diP8u3CWv7+cNT5rcJrhxJ07d1i+fDkjRowAoFC+Qvzy7i/ojORCP+7u7hQtWjRHfx776fYM3DYwR8tUFOX1pB4BKFljapO3AX+PdeiQ+lm+psllfp9s1G1s5JK/u3bJvP/btsGHHz67TIMeEqPRBx/mrO4tqhWWIwR2dnYMGTIEgzAghGDCvgkcunOIkGEhjBg4ghn9ZdKeK99ewSfIBxtzG0rNKcWN8BsAjJ0wll69euHk5JRUVY3P3T8H4MyZMzRp0iRH7/6B5BgFRVGUF1EjAErGCSFX9zMygdK9c6bMv/+WU/eyymCQGfyebkjNzeUKfn36pB4xeNqtNXB6CFgWY52JO9WXVEdv0BMYGEjlypURQlBkZhGsp1rzXrn3uN7/OrZmtvz9998MvT2Ujms6st53PZUKVeLqg6vcCL/B1zW+Zs+7e/jb62+GDx+e7mWnTJnC7du3s/69FUVRskl1AJSMEwZA5Oyyvh06wKZNGT8+Xz54PGVu7FiZztfDI+1oxOM5/k2awHffpS0ncB9M/Raq94LKEwA5xC88BMYTjTkVeYrTp0+jaRpXv73KkneXUG1JNcJjw/H29sbE2gTsQS/0nAs4R3xiPN3/7I6duR0L2i3gtzm/0a9fPwo8ubrgE9auXUupUqUy/r0VRVFymMoEqGRM8CEwtgK7yi+3HidPgoODHPLXNGjTBn75RY4kfPVV6mOjo2UioOhosLSU2wwJcgTj5u8QApyLp6PVVrwueiUPn98Mvcny+csZOWJk8hC9Nl52MApYFKBnSE9MzUyZNHESQgiMJhhxoe8FKi6oSOyoWPyu+9GgQQOuXr2KrW3q6ZGJiYk0btyYTZs2YW+fekaAoihKTshoJkDVAVAy5vYGGfVfuGXuX2vWLKhYUUbzPxYcLO/qn6Zp0L07/PZb2n0GAzRtKlf5ezxCsLsluHuCXdXkw+5H3ScoOogqTjJ/QHR0NIsXL2bw4MEAnPQ/ST7TfBSxKsLZ+2fp0KADYe3C+Omrn/iy2pdpLvvpp5/i5ubG4ZKHGVpvKE1KNkm1//Lly7i6umbmF1EURckwlQpYyRn6ePDfBsU75k3jDzBkCAwblvI5PFzm7I+LS3usEOk3/gBGRrBvH+hjZbZCYYD6q1M1/gCFrQonN/4ABoMBXT0dvTfJOIe3/3ibQdsGYW1mzYGTB4h8FMldz7v0/6c/zZY1S1XWuXPn2LxjM6MejuJh/ENiE2NTlbtkyRJcXFwy93soiqLkAjULQHm+GH+4txkKt867qP+nR6VsbZ+dxe/WLZgzR44aPMlggCVL4POP5ciFIR70cWCW/jP5x+Lj46lcuTLDVgzjp1M/UcKmBIFDAwEIjg5m1IJRfPnJlzT4tQExiTEERQelOn/EiBGMGTGGdt3aUbFQxVT7oqKiuHHjBsYvWHtAURQlL6hHAMqzhZ4C28o5G/SXUQ8fynn8xYunbAsPT1nx77Ft26Bt27QdhNBQqFYAfm4OLXZl6tIJCQmYmJiw2mc1n26QCYR8+/piqjOlXp16LPphEV3OdGFi04n0rdkXc2O52NDmLZsZMngI58+fxzSd9Qeio6PJly9fpuqiKIqSWeoRgJI9QsClWfDw+su5fv/+MtAvNhamTZP1sbODv/6SQX2PtWmTtvG/vxMit4OfgKZbMnXZCRMmEBUVBUCFghVoWLyhfL+gAk3mNCHxQSLtWrYjemQ0g+sOTm784+Pjad+9PW2+aYOpqSnaeI2fTv6UXO7Vq1dp2rRpFn4IRVGU3KE6AEpa8REQ9wDqrQDrlxSsNnGi/HvnDowYIUcEEhJgzBgZ2Z+emPvyeb9FYchXUm7TmWX4kgaDAeN8xljks0AIQfUl1VnbaS3tyrSj3lv16J2/N++88w5mU8wY8e+IVOfOnz+fJu5N8PzGE4C5bebSwqVF8v4yZcqwf//+DNdFURQlt6kOgJLWvU1wZe7LrUPRovLO/vFceSFk7v+zZ0GvT/+ccx4QtB9sK0HBupm+ZFhYGKMejmLknpFomoZrAVeMNWN0RjoO3znM7m27eVTqEQB9qvVJPi8oKIipU6eycN5CTHVy6P/b2t/ibOcMwMWLF5k6dSrm5uaZrpOiKEpuUdFISmrx4eDcJXNL52ZF1aqwfTs4Oj7/uMeBh1FRYG0tPz8ZjCgMcLgrVJsFtRZnK1CxTZs2XF9zPTlK/0yfM5SZVwa/cD/qOtZl74G9hG0MY5HxIhw8HTjV+xTuhd0ZNWoU3bp1o1y5cumWa2NjQ7VnLUCkKIrykqgOgJIiIRJ21ofWJ8DYInevdf06xMQ8/5i7d2HwYNkZebpDIgzw4Di06w+rxoKZfbZnKXh7e2NklDIoptN0+IX7ET0ymuOHjzOs6jCsrawx0oxIGJOATtNx6tQpNm3axKVLl9ItMzg4GCEErZ/MaaAoivIKUI8AFEkIOV2uzamcb/yrV4cHD1Jvi4qCkiVTb1u3LmUZX5AdAC8vmRfgiYYZISAuBC5MgePHwKaOzO6XDVOnTuXmzZsERwcnb9M0TaYGNjJm175dxBSJQTdBhxCC66EyOLJ///5MnDgxTca/x44cOcLChQuzVTdFUZTcoKYBKpLPZDAvmHOL/DxJp5Pz9YsVe/YxQshG3tcXypdPvS8yUnYGKlSAe1vAfwvUXJCjVVyzZg11Gteh5OKSxI2OS36WD9BpXSfWj1rPykkradymMX7hfjT4tQGrXFcxffp0jh8/jk6ny9H6KIqiZJVKBZxEdQAyKCESDIlyKP1le/hQdgYMhpSI/7t/Q/5SkL8kJEaDeaEcu5y/vz9OTk6phv+fZDAYKFCgAJcuXcLa3ppSc0txodcF3Cq6UbxncQ6PP5zmnKCHQdT6ohajW47myy/TpgtWFEXJLSoPgJIxCVFwuAsYmb0ajT/IYD8XF7CygnMH5TZ9LBhiwThfjjb+AMOGDXvuFL0LFy5QsGBBnBY5YTPNhvsP7zN7xmzcarhxxOhIuuecuH+CWyVv8fbbb+doXRVFUXKKCgJ80+ksoWTXTM2Xz3UGg/wbFQmHmkMpLyjxUa5dbuXKlTw5EhaTEIPbQjeuh13H6yMvLuy8wNV8V1nx/gq6bOzC1lZb6fJOF06fPk3xJzMVPsHirgVXvrxCkSJFcq3eiqIo2aFGAN5k/tvhwVEo8opEqNeqBT/+CI/uwpHuMG8e/OYM+d6S+7t2BYucDVD84YcfOHr0KNoTMwh0Rjquh8kgvw/WfsDhY4dp07gNXTZ2gTj4qNNHTJ8+PVXjL4TgYvDF5M83btwgJCQkR+uqKIqSk9QIgPLqaFMHypqCRRFw7g63gyEmZTU9JkyAHH6eXq1aNYoVK0ZYTBh1l9blbuRd1nVah/CQIwJCCKo2rso57Ry1K9am4D8FcWzjyBdffJGqHN9gXyotrIRhrIHY2Ng0+xVFUV41agTgTRV6Si7vW7D+y64J6BPA1wf6tIW3HoFmBE7N4OOPU1ICAzg7Q+PGOXbZa37XcHN3o1ixYuiFnmuh1/i86ucUt5F39vej7mM0wQhdtA7yg/cGby5evsj8+fPTlFWxUEWEh0DTNDp16sShQ4dyrJ6Koii5Qc0CeBMZ9LCvPdT9LccD6rJkU3vw2Ayn8va/RZPmJugK6IhdG5vufoMwoJugo+6OukSaRBLoG8gx72M4Ozs/t9zY2FhMTU2fOasgL8w+MpvBOwYnj2QoivLmULMAlOdruvXlNv76WDjaU/5t/TucNOR5FWJ3xlKsfjGO3TuW7n4jzQjhIZg0cRL1XevjfdT7hY2/h4cHoaGh2W78DcJAlUVViIyLzNL5HSt0ZNl7y7JVB0VRXm+qA/CmCT8Pe1q9vOsHXoPDS0FnDsU6gKYDU9tsp/HNrGXLlvHnxj8pbluc7n9253kjYc2aNWPx4sW4uLiQaEjkhH/6I0pCCFxcXChQoEC262ekGXEu8Bx6wzMWPnqB4jbF6ValW7broSjK60t1AN40tm5Qf3XeXlMIOHoAEmNg0TSY+SWsWgVHE7KdwjeratWqRaVKlbAyteJSyCUexj/kTMAZhBBsvbKVT9Z/ku55e/32UvOnmunuu3jxIt26dcPMLGemVAoPgZ2FFeJAuAAAIABJREFUXY6UpSiK8jTVAXiT3PlTvswL5k75deqAhweEhcGpUynbr1+HHxvB7XXg8TNsELBmDWzalDv1eIGAgAAcHBxwdXXlyN0j/NvtX+Z4z8F9sTtj94yl3ap23I28m+65LVxaIDwEHdd2JORRyjS/+Ph4evfuzcOHD/PqayiKomSLCgJ8k4SeBM0Y7KrkTvkzZkCNGrBrF0yeLIMN978PtX8CE1t57blzYcCAPB/yf9LKlSu5desWI0eOBCAqLgorMysA9AY9sYmx5DPNl+65QgiMJsh+8/mvz1OpUKW8qbSiKEoGqSBAJbXYILAqm3uNP8DQodCkCYzoBdeWyul8FUeBaQHQmcoVAAcNgvj43KtDBnTu3Dm58V91fhXW06yT9+mMdOk2/sHRwWjjNfRCz7Tm0wCwt5CpkwMDA2nZsiUGQ94HMiqKomSV6gC8Ke5shKs5u4JeGqGnIfo2GJnL6H4Ah1pglLRSno2NjAfIoWfkWVHimxL0GN4DAG28xq4bu2hXph0J+oTnnudg6cCSd5ZgbGTMdw2+Y1CdQThYOgBQsGBBZs2a9VKn/SmKomSW+j/Wm6LMV1Dhu9wpO/qW/Bu0D6KugIUjlO2bO9fKJoOjgWWRyzAIA3u77+WXM7+w5eoWEg2JAHz595fcjrhNvD6ebde2JZ+naRq9qvdK/jyr9SxMdaaEhobi5eWFm5tbnn8XRVGU7FAdgDdB2Bnw9cz5cvXx8k5//3uQ8BDKDQSnFqmPOXMG/ve/9M/P4/iTiIgIdn28C7FIYKQZ0bhkY4SHQHgILEzkGgNLTy/leuh1jtw5QtuVbdMt58GjB8nTBoODg7l582aefQdFUZScojoAbwIzByjwwniQjBFCvu78Cce/lvP525wCk/zpH3/hAvz6a/r7jIxg3bqcqVcGXLhwgc/+9xm/n/39mccID0FT56bJnYP0OHg6sPjkYmJjYylVqhTDhg3LrSoriqLkGtUBeBNYFIWCDbNXxuO79QMfQOgJKNIWJt6RQX/Pi+jv3BkCA9Pfd+YMvPtu9uqVCfXq1aNM5zJExUdlqxzhIehTow8bNmxg0KBBOVQ7RVGUvKU6AG+C8+PgwtSsnSuEDO7b115+rjEP7KuDzgyGjYTRo7NerypVcj0gcI3PGkrNLYWvry+9e/dm9Yer6VuzLxGxEWjjNWITZbCiT5AP2vgXT00MjQmVswEMejp37oynZy48WlEURckDajngN4HbuMzNu0+MAWML8O4Fxd6Dwq2h9s9yn2WxlOOaNMnJWuYKFzsX2pdtT5fdXbhmdo0lLAHAytSKnlV7Ym5sDkChfIXoW+PFgYtWpla8V+491qxeg42NDe3atcvV+iuKouQWlQjoTXFvC0RehvKD09/v/w/Y15D5Ary/gNZHISZALhikPTVQpGlw4AA0aAAREfDtt7B8ee5/hyzS6/X8ufNPqtSqQmn70kTFRSXP/T/b5yyVHSsnH3vS/yQ1fqrxwlX0Tp06hZmZGRUrVszVuiuKomSWSgSkpFagJjg1l9n5/m0hI/gD98LZMXJ/2GmICwab8tAyaS17C6e0jT+AlxdUqybfBwbC788OqnsV3L17l40rNlLavjQA+U3z83HFj+lbvS9VFlXh0O1DyccWsy7GkLpDnlvehQsXcHV1VY2/oij/aWoE4E1jSJRBfAVqQVwoxAWBTYW0xwUHw7RpMHNm3tcxj2y+spnVPqtZ0n4JliaW6R7T7o92tC/bnj41+iRvGz58OG3btqVp06Z5VVVFUZQMUyMASvqMjMGhjryzN3dIv/EHuHwZZs3K27rlgvDwcFq2bMndiLto4zUMIiVd7ztl32HFByue2fgDlLIrRVGrosmfhRBMnz5dNf6KovznqQ7A627Vqmcn4nmeBg3yPFFPbogQEUyaMomB2weysN1CfjvzG61+b5XmOG28xo7rO9Jsn9t2Lu1d2yd/btWqFVevXs3VOiuKouQF1QF43T14ABcvZu6c12hRm5IDS+IV6sWGixvo4NoBp/xOuNi5JO8XQqCN12jp0pIaRV6cLGnJkiWULl06N6usKIqSJ1QH4HXXrx/89VfGj79wAXS61+LuPz4+nvci32NCkwkID4GZsRmtS7Vm0TuLko8xmmBEvWL1mPr/9u48Pqrq/v/46yRkAwJoWGQnKChbCASSWAVBFGiFiiKLovQnfgsiVKv+bLV8AaO1alupG2r5VkT4srgQqlAKiFVxYTNsIpElshgJiwkggQSGzPn+McOYkAQCTGZ9Px+PPJw59557P3OYh/cz5557Tp+nPav7/XD8B3488WOZY1lrmTp1Ko0aNcL4cSljERFvUQIgZbVvDzt2nN+8AQEqOjqaBQsWEOOebCjhzwlc8uwlZfbZeO9Gvsj9gi+++8JT1uAvDej5Rs8y+508eZL9+/d7jiUiEuw0EZCUZQxcfrm/o/CKQYMG8cILL9CyZUsAskZnsWL3ijL7JDVK8jzzv+fwHvIK8yqcA6CwsJAnnnii+oMWEfER9QCEMqcTfv97KCnxdyR+MXnyZJo3b+55f2XClTy49EFMhuHMx1+/+eEbWr7QkvTX01n7/doy0wLn5uZy4403lqsjIhLMNA9AKDtxAmJjobAQatXydzQ+tXr1atq2bcsll5Tt8l+duxqH08G1La6ttO7h4sNMXz+dh67+adbEU6dOUaOGOsxEJPBpHgBxLbRjbdhd/AHeffdddu/eXa58ac5SerzRg/lb5jNjw4wK69aLree5+K9bt44JEybo4i8iIUc9ABJSrLWVjtI3GYYPR35ITGQMczbPYeehnSwesfisxysoKGDr1q1cffXV1RGuiIjXVbUHQD9rJGR8tuczerzRg/8+9d+kpaUxYMCAMtvHdx/PVfWvokl8E65pcY2n3GQYbmt/G+8MeafM/t9++y0Oh6PcxX/kgpFsPrCZdWPWVd+HERGpZkoAQt2iRTBwYEg8138u6c3S2XTvJpKeSWJKXNlpjHvN6MW1La6lSXyTcvXWj1lPo1qNypVv2rSJffv2ceWVV5YpH9ttLHmFed4NXkTEx5QAhLrUVJg6tXrPcfPN0L8/jB1bvec5hxoRNYg5EsPknpMZ1HWQp3zPkT0MbDuwzLK/AKecp4h6Mor9/38/DWs1LLOtpKSEQYMGUZGrm+t2gIgEPyUAoa5hQ7jvvuo9R8uW0Lhx9Z6jitauXUsrRysSL0kEIKcghyteugLnJGe5sQE1ImqwZMSSchd/gAceeIAePXowbNgwn8QtIuJrfhkEaIwZAjwOtANSrbVfustbAdnAVveuq6y197q3pQAzgDhgMfCArULwGgR4hrFj4a674Gc/83ckPlF4spD4p+M59odjZ131b1rWNKIiori7y90AFBUV4XQ6qVmzJidKThBbI9ZXIYuIXJRAfwxwM3ArsKKCbTnW2mT3372lyl8FRgNt3H/9qz/MEPTpp/Ddd/6OolosWLCAJ554guOO47Sf2p4Dxw5QK6oWv7/m92e9+AN88d0XrNm7BoCXX36Zffv2UatWLUZkjiDuqThfhC8i4lN+uQVgrc0GqryoijGmMVDHWrvS/X4mMAj4d3XFGLI2b/Z3BNWmT58+JCUlcWfmnWT/kE2RowhjDM/c8Mw5684YNMPzumbNmtStW9dTXnrxIBGRUBGIYwASjTHrgR+B/7bWfgo0BXJL7ZPrLquQMWY0rt4CWrRoUY2hSqA4cuQI2dnZpKenk3l55gUfJycnh7vvvtuTnEZHRhMdGe2tMEVEAka13QIwxiw3xmyu4O/ms1TLA1pYa7sADwFzjDF1gIq6Ciq9/2+tnWat7Wat7dagQYOL+yDB7uRJf0fgEzt37iQzM5MiRxHFp4o5WeL63HO/mst/dv6nSsc4deoUI0aM4NChQ9UZqohIQKi2HgBr7Q0XUOcEcML9OssYkwO0xfWLv1mpXZsBe70RZ0g7vRZAQQGcMSd+MLtuxnXUMDXYfWQ3O+7fAUBycjKH6h6i5p9c9/pb1m3Jrt/u4pnPn6F3q95cn3j9OY9bo0YNVq5cWeVbUyIiwSyg1gIwxjQwxkS6X7fGNdjvW2ttHnDUGJNuXP93Hgm858dQg0NMDOzbF1IXf4D84/mM7DySaQOnAa7V+gYMGMB1ra6j4HcFfHv/t1zd/GoyPs5g470beb7/8+c85oEDB+jfv79W/BORsOGvxwBvAV4CGgCHgQ3W2n7GmMHAE8ApoASYbK1d6K7TjZ8eA/w38Bs9BigADoeDb775hk6dOgGwdMdS+s/uT+tLWpNzf06VjuF0Otm0aRPJycnVGaqISLWr6mOAWgxIgtbRE0ep80wdFqYupP+N/cut2LcgewHRkdHc1PYmAAqKCrh53s2s+H8rynTz5+fns2LFCm655Rafxi8iUh0CfR4AkfPys9d/xpyv5pQpi4+JZ+7Aucx4fUaF9+1fy3qN51c9z54jewD4av9XfLbns3L7HThwgO3bt1dP4CIiAUo9ABIURi8czfCOw6s0mK80k2F4MP1BpvSbUuH2Y8eOERMTU673QEQkWKkHQELKtIHTyl38rbX069eP/fv3A/DJrk/49fu/9my/5717+PHRHyu9+AO88cYbPPnkkwBMWTkFk6EnAEQkPOhnTzDZvdu18I54dBvZjRvm38BX933F/mP7WbdvnWfb9A3TmdBzAvEx8ZXWHzduHA6HA4BhHYZVuFywiEgoUg9AIJo1CzLds9mdOAHGuB7na9UKfvzRr6EFkpUrV9Kjcw/PIL+hHYaSNTrLs91OtrS+pHWl9Z988klWr15NdLRrpr9a0bW4a8FdlDhLqjdwEZEAoAQgEM2bB0uXul7HxMD8+XDZZWAt1Knj39gCyNy5c0mMSuTpPk+X21Z6NsDK9O3blyuuuMLzPjoymgY1GxAZEen1WEVEAo0GAUpQa/1Ca4pOFZH3cF6ZcpNhaFG3Bbt/u7vCekuXLqVnz57ExWmlPxEJLVUdBKgxABKUegzvQYPODfhs/GdYazEZhtm3zuaOTncA4JjoqLSu0+lk7ty5pKWlKQEQkbClWwD+ZgzMnFm2bPduV3mI985cjOuHXU+TNk24NO5Sxv5rLH8f8HeSGiVhMgxO66RGRA1qRFSc3zocDmbMmEG9evV8HLWISOBQAuBvs2ZB//5ly5o2hTlzXEmAlLNlyxZGdR3Fy7e9jKPEwcJtC/mvrv/FjgLXwkARpvKv9d69e+nevTtOp9NX4YqIBCSNAZCgM336dGrXrs3QoUPLlBefKmZ93nqubn71WesfPXqU+PjKHw0UEQlmGgMgIWvUqFEVlmcfzKbwZGGl9datW8cnn3zCgw8+WF2hiYgEDd0CkKCyaNEiMjIyKtw2de1U7lpwV6V1GzZsSOfOnasrNBGRoKJbABJUDh06xIEDB7jyyivPq9727duJj4/nsssuq6bIREQCg9YCkJBz8uRJtm7dWubiv+b7NXz47Yee91/u/ZKKktr//Oc/LFu2zCdxiogEAyUAEjRyc3N55ZVXPO93HtpJ2j/SuG/xfZ6y7v/TnQ37NpSp53Q6GTNmDCNHjvRZrCIigU4JgASN1q1bM7PUnAkt6rZgwbAFbB2/1VNmJ1u6NO5Spt7NN9/MmjVrfBaniEgwUAIgQcHpdDJo0CAKC38a5R8ZEcmgqwads+4bb7xBSkpKdYYnIhJ0lABIULDWcv/991O7du3zqjNp0iRiYmKIjNQCPyIipSkBkKCwfft2UlJTeGXtK+fe2c3hcNCoUSNq1apVjZGJiAQnJQASFJ5++mmWr1nOuMXjym0zGYbM7MwyZU6nk5ycHMaNG0dERNmv+b7CfdUaq4hIMFACIEHhzTffZPD1g7GTyz/it/Kelfz8ip973ltr2bFjB4899li5fUucJTR+rjEHjh2o1nhFRAKdEgAJeNOmTWPx4sWA69f+Z7s/K7M9vVk6cVGuZX3Xfr+WiIwI2rZtyz//+c9yx4qMiMROtjSs1bD6AxcRCWBKACTgpaWl0bZtW8/7B5Y+QP7x/Ar37dq4K882epZJkyb5KjwRkaCkxYAkoB0+fJjmzZuT8FIC96fez+xbZzMicwSHig+RUDOh3P6REZHcf/f9/PDDD36IVkQkeCgBkID28ccf89FHH/Gv8f+iQ4MOLP92OYPbDeaKS6+ocP+FCxfSvHlzkpOTfRypiEhw0WJAEpRMhuHF/i/ym7TflCmfP38+rVu3pkuXLpXUFBEJbVoMSILevn37SByQyMyNM8tte/2Xr3PzVTeXKdu+fTu33norUU2jWJajhX9ERM4mLG8BOBwOcnNzKS4u9ncoQSU2NpZmzZoRFRXlk/NFRUXRJrkN9WvWL7dtVJdRZd47nU7uuece3n77baatn8Y/1v2D4xOO+yROEZFgFJa3AHbu3El8fDwJCQkYY/wUWXCx1pKfn8/Ro0dJTEz0yTnz8/NJSHAN9Mvam8WOgh0M6zis0vgA/XuKSNjTLYCzKC4u1sX/PBljSEhI8FmvibWWbmndOHDANWFPZnZmhbMAAmzcuJEBAwbo31NE5DyEZQIA+qV4IXzZZsYYdt25iw1HNwDwVJ+n+OF3FT/al5SUxGuvveaz2EREQkFYjgGQwPfuu++S9cssul7e9az7vffee8TFxdG3b18fRSYiEhrCtgdAAsuBYwcwGQandQIQHR1NdHT0Oes1bNjQM05ARESqTj0AEhBqR9emT2IfIkwEp06dYuDAgee85bBq1Sq6devms6cSRERCiXoAgFatWmGM8dpfq1atznnO7777jt69e9OuXTs6dOjACy+8UP0fNIDVjKrJ8pHLAVe3/t133w38NLr/TNZaXnzxRfLy8nwWo4hIKFECAOzevRtrrdf+du/efc5z1qhRg+eee47s7GxWrVrF1KlT2bJliw8+beAbPHgwU6dOxVHiIOKJCAqKCgBIejWJhVsXAnDy5EnmzJlDixYt/BmqiEjQUgLgJ40bN6ZrV9cAt/j4eNq1a8f3338PuB5r69mzJ+3btyciIgJjDJMnT/ZnuD7zQc4HvPrqq8TGxhIVGcXKe1ZyadylAHRu1JlL4y4lJyeHnj17Vto7ICIi56YxAAFg165drF+/nrS0NIqLixk2bBgzZ84kNTWViRMnUlxczOOPP+7vMKtdibOEvtP7MubHMURGRgKQ3izds33WrbM8rz/44AM9yikichGUAPhZYWEhgwcP5vnnn6dOnTosWrSIrl27kpqaCriecV+yZElYXOwiIyKxT539V/1bb72Fw+Hgzjvv9FFUIiKhSbcA/MjhcDB48GBGjBjBrbfeCsDmzZvp1KmTZ59169Z5bhWEgwkTJpCZmVnp9u7du9O5c2cfRiQiEpqUAPiJtZZ77rmHdu3a8dBDD3nKExIS2LRpEwDbtm0jMzOT4cOH+yvMavX+1vdZvH2x573JMKQMSuG6666rcP/p06fToEGDMgmSiIhcGN0CAFq2bOnVLvaWLVuec5/PP/+cWbNm0alTJ5KTkwH405/+xO233877779Px44dqV+/PnPnzg3ZiW5eXvMy8THxpDZNpX7N+tzX+T4ijkZ4Pm/7qe358cSP5D6US0lJCTk5OZ6xASIicnHCcjXA7Oxs2rVr56eIgpu32+5kyUli/hhD/u/yyc/N549//CNvvvkmAHuO7MFpnVxiLqGgoMBnqxCKiAQzrQYoAWtZzjIOFR0CIDoyGjvZcmncpbRp08Zz8QdoUbcFreq1YvXq1UydOtVf4YqIhCQlAOJz/f63H/M2zytXPnPmTD788MMyZYcPH6Zv37789a9/9VV4IiJhQWMAxOfs5IpvO7Vp04Z69ep53judTvr27cvbb79dpemVRUSk6pQASMBIS0sjIsLVKVVUVERMTAwrVqwgNjbWz5GJiIQe3QKQgNGtWzeys7MBePbZZz1TAouIiPepB0ACxueff86+ffvIycnh4d89THRktL9DEhEJWeoBEL85VHQIk2FwlDgAiIuLY8mSJQx/aTh1/lKHmJgYP0coIhK61AMgflM3ti6/TfstUZFRnrKxY8cy6tQoTpac9GNkIiKhTz0Abg8//DDPPfccAE2aNGHv3r18/PHH9OrVC4DRo0czbdo0wLV879GjR1m4cCEDBw4E4I477mDOnDkAVZpVsLi4mNTUVDp37kyHDh3CZrnf0iJMBH/r/7dy5TE1YoiPifdDRCIi4UMzAQIpKSlkZWX5NC5rLceOHaN27do4HA6uvfZaXnjhBdLT089d2Y+qYxbFDfs2UFBUwPWJ13v1uCIi4UgzAZ6H07/sveV0T8DZGGOoXbs24FoV0OFweHoONm7cSM+ePWnfvj0REREYY0K6h2DKyincmanlfUVEfEljAHB16XvTokWLuOOOO865X0lJCSkpKezYsYNx48aRlpZGcXExw4YNY+bMmaSmpjJx4kSKi4t5/PHHvRpjIJl5y0x/hyAiEnbUAwAMGDDAq8erSg8AQGRkJBs2bCA3N5c1a9awefNmli9fTteuXUlNTQUgKSmJgoICr65WKCIiogQA2LZtm1ePd3pgYFXVq1ePXr16sWTJEjZv3lxmvft169bRtWtXr8YnIiKiBAC83r0+evToc+5z8OBBDh8+DLimvV2+fDlXXXUVCQkJbNq0CXAlJpmZmQwfPtyr8YmIiCgBADIyMjxJQNu2bdm2bRtZWVmkpKQA5/+I4Onys8nLy6N3794kJSXRvXt3brzxRgYMGMDtt99OYWEhHTt2ZPTo0cydO5eEhASvf2YREQlvegxQzovaTkQksOkxQBEREamUEgAREZEwpARAREQkDCkBEK87euIov/rnrwj18SUiIsFMCYB43Q/Hf2DmxpmavEhEJIApARCvS7wkETtZv/5FRAKZEoAQdfjwYV555RXP+71793Lbbbf5MSIREQkkSgBC1JkJQJMmTXj33Xd9HkfhyULavNSGU85TPj+3iIhUTgmAn+zatYt27drx61//mg4dOtC3b1+KiorIycmhf//+pKSk0KNHD7755hsAcnJySE9Pp3v37kyaNMmzlHBhYSF9+vSha9eudOrUiffeew+ARx99lJycHJKTk3nkkUfYtWsXHTt2BCAtLY2vv/7aE0uvXr3Iysri2LFjjBo1iu7du9OlSxfPsS5GhIlgR8EOIk3kRR9LRES8yFob0n8pKSn2TFu2bClXdi4TPpxg84/nn3e9yuzcudNGRkba9evXW2utHTJkiJ01a5a9/vrr7bZt26y11q5atcr27t3bWmvtTTfdZOfMmWOttfbVV1+1tWrVstZa63A47JEjR6y11h48eNBefvnl1ul02p07d9oOHTqUOd/p91OmTLGTJk2y1lq7d+9e26ZNG2uttY899pidNWuWtdbaQ4cO2TZt2tjCwsIycV9I24mIiO8AX9oqXB/VA1BFT336FNkHs716zMTERJKTkwFISUlh165dfPHFFwwZMoTk5GTGjBlDXl4eACtXrmTIkCEA3HHHHZ5jWGv5wx/+QFJSEjfccAPff/89+/fvP+t5hw4dyjvvvAPA22+/7TnusmXLeOaZZ0hOTqZXr14UFxezZ8+ei/6cTuvEZBj2Fe676GOJiIh31PB3AMGiOka1x8TEeF5HRkayf/9+6tWrx4YNG6p8jNmzZ3Pw4EGysrKIioqiVatWFBcXn7VO06ZNPasOvvXWW/z9738HXMnE/PnzufLKKy/sA1UiwkSQ0SuD+jXre/W4IiJy4dQDEEDq1KlDYmKi59e5tZaNGzcCkJ6ezvz58wGYN2+ep86RI0do2LAhUVFRfPTRR+zevRtwrUp49OjRSs81fPhw/vznP3PkyBE6deoEQL9+/XjppZc8E/isX7/+gj5H4clCHlr6UJmySddNokaE8k0RkUChBCDAzJ49m9dff53OnTvToUMHz0C8559/nilTppCamkpeXh5169YFYMSIEXz55Zd069aN2bNnc9VVVwGQkJDANddcQ8eOHXnkkUfKnee2225j3rx5DB061FM2ceJEHA4HSUlJdOzYkYkTJ17QZ9h7dC9/W/W3C6orIiK+oeWAg8Tx48eJi4vDGMO8efOYO3euV0bpn69gbDsRkXBS1eWA1ScbJLKyshg/fjzWWurVq8f06dP9HZKIiAQxJQBBokePHp7xACIiIhcrbMcAhPqtj+qgNhMRCR1hmQDExsaSn5+vC9p5sNaSn59PbGysv0MREREvCMtbAM2aNSM3N5eDBw/6O5SgEhsbS7NmzfwdhoiIeEFYJgBRUVEkJib6OwwRERG/8cstAGPMX4wx3xhjNhljFhhj6pXa9pgxZocxZqsxpl+p8hRjzFfubS8aY4w/YhcREQkF/hoD8AHQ0VqbBGwDHgMwxrQHhgMdgP7AK8Z4lpF7FRgNtHH/9fd10CIiIqHCLwmAtXaZtfb0AvGrgNM3lm8G5llrT1hrdwI7gFRjTGOgjrV2pXulo5nAIJ8HLiIiEiICYQzAKOAt9+umuBKC03LdZQ736zPLK2SMGY2rtwDghDFms9eilaqoD/zg7yDCjNrc99Tmvqc2r5qWVdmp2hIAY8xy4LIKNk2w1r7n3mcCcAqYfbpaBfvbs5RXyFo7DZjmPseXVZkSUbxHbe57anPfU5v7ntrcu6otAbDW3nC27caYXwEDgD72pwfyc4HmpXZrBux1lzeroFxEREQugL+eAugP/B74pbX2eKlN7wPDjTExxphEXIP91lhr84Cjxph09+j/kYDvV8IREREJEf4aA/AyEAN84H6ab5W19l5r7dfGmLeBLbhuDYyz1pa464wFZgBxwL/df1UxzZuBS5WozX1Pbe57anPfU5t7UcgvBywiIiLlheVaACIiIuFOCYCIiEgYCpkEQNML+54xZogx5mtjjNMY061UeStjTJExZoP777VS29TmF6GyNndv0/e8mhljHjfGfF/qu/2LUtsqbH+5eMaY/u6RZZYFAAAEEElEQVR23WGMedTf8YSKkEkA0PTC/rAZuBVYUcG2HGttsvvv3lLlavOLU2Gb63vuU38r9d1eDOdsf7kI7nacCvwcaA/c7m5vuUghkwBoemHfs9ZmW2u3VnV/tfnFO0ub63vuXxW2v59jChWpwA5r7bfW2pPAPFztLRcpZBKAM4zip8cEmwLfldp2ehrhppzH9MJy3hKNMeuNMZ8YY3q4y9Tm1Uffc98Z777VON0Yc4m7rLL2l4untq0mgbAWQJX5c3rhcFWVNq9AHtDCWptvjEkB/mmM6YDavEousM31PfeSs7U/rtspT+JqwyeB53D94FA7Vx+1bTUJqgRA0wv73rnavJI6J4AT7tdZxpgcoC1q8yq5kDZH33OvqWr7G2P+B1jkfltZ+8vFU9tWk5C5BaDphQOHMabB6QFQxpjWuNr8W7V5tdL33AfcYypOuwXXoEyopP19HV+IWgu0McYkGmOicQ22fN/PMYWEoOoBOAdfTi8sgDHmFuAloAHwL2PMBmttP6An8IQx5hRQAtxrrS1wV1ObX4TK2lzfc5/5szEmGVcX9C5gDMA52l8ugrX2lDFmPLAUiASmW2u/9nNYIUFTAYuIiIShkLkFICIiIlWnBEBERCQMKQEQEREJQ0oAREREwpASABERkTCkBEBEPIwxJe5V7jYbY94xxtS8gGP84/RiLcaYP5yx7QtvxSoiF0ePAYqIhzGm0Fpb2/16NpBlrZ3ijeOJSGBRD4CIVOZT4AoAY8xD7l6BzcaY37rLahlj/mWM2eguH+Yu/9gY080Y8wwQ5+5RmO3eVuj+71vGmF+cPpExZoYxZrAxJtIY8xdjzFr3gjtjfP2hRcJFKM0EKCJeYoypgWv99SXuBZ3uBtJwLcyy2hjzCdAa2Gutvcldp27pY1hrHzXGjLfWJldwinnAMGCxe3rXPrhmLLwHOGKt7W6MiQE+N8Yscy+xKyJepB4AESktzhizAfgS2AO8DlwLLLDWHrPWFgKZQA/gK+AGY8yzxpge1toj53GefwPXuy/yPwdWWGuLgL7ASHcMq4EEXPPqi4iXqQdAREorOvMXu3sRoXKstdvcvQO/AJ52/1J/oionsdYWG2M+Bvrh6gmYe/p0wG+stUsv9AOISNWoB0BEzmUFMMgYU9MYUwvXKnifGmOaAMettf8L/BXoWkFdhzEmqpLjzsN1a6EHroVecP937Ok6xpi27nOKiJepB0BEzspau84YM4Oflrf9h7V2vTGmH/AXY4wTcOC6h3+macAmY8w6a+2IM7YtA2YC71trT54+NtAKWOfueTgIDPLqBxIRQI8BioiIhCXdAhAREQlDSgBERETCkBIAERGRMKQEQEREJAwpARAREQlDSgBERETCkBIAERGRMPR/E5Ixh8c+MK0AAAAASUVORK5CYII=\n",
"text/plain": [
""
]
},
"metadata": {
"needs_background": "light"
},
"output_type": "display_data"
}
],
"source": [
"# Plot the samples using columns 1 and 2 of the matrix\n",
"fig, ax = plt.subplots(figsize = (8, 8))\n",
"\n",
"colors = ['red', 'green'] # Define a color palete\n",
"\n",
"# Color base on sentiment\n",
"\n",
"#data.negative[data.sentiment == 1] = data.negative * 2\n",
"\n",
"ax.scatter(data2.positive, data2.negative, c=[colors[int(k)] for k in data2.sentiment], s = 0.1, marker='*') # Plot a dot for tweet\n",
"# Custom limits for this chart\n",
"plt.xlim(-200,40) \n",
"plt.ylim(-200,40)\n",
"\n",
"plt.xlabel(\"Positive\") # x-axis label\n",
"plt.ylabel(\"Negative\") # y-axis label\n",
"\n",
"data_pos = data2[data2.sentiment == 1] # Filter only the positive samples\n",
"data_neg = data[data2.sentiment == 0] # Filter only the negative samples\n",
"\n",
"# Print confidence ellipses of 2 std\n",
"confidence_ellipse(data_pos.positive, data_pos.negative, ax, n_std=2, edgecolor='black', label=r'$2\\sigma$' )\n",
"confidence_ellipse(data_neg.positive, data_neg.negative, ax, n_std=2, edgecolor='orange')\n",
"\n",
"# Print confidence ellipses of 3 std\n",
"confidence_ellipse(data_pos.positive, data_pos.negative, ax, n_std=3, edgecolor='black', linestyle=':', label=r'$3\\sigma$')\n",
"confidence_ellipse(data_neg.positive, data_neg.negative, ax, n_std=3, edgecolor='orange', linestyle=':')\n",
"ax.legend()\n",
"\n",
"plt.show()"
]
},
{
"cell_type": "markdown",
"metadata": {},
"source": [
"To give away: Understanding the data allows us to predict if the method will perform well or not. Alternatively, it will allow us to understand why it worked well or bad."
]
}
],
"metadata": {
"kernelspec": {
"display_name": "Python 3",
"language": "python",
"name": "python3"
},
"language_info": {
"codemirror_mode": {
"name": "ipython",
"version": 3
},
"file_extension": ".py",
"mimetype": "text/x-python",
"name": "python",
"nbconvert_exporter": "python",
"pygments_lexer": "ipython3",
"version": "3.7.1"
}
},
"nbformat": 4,
"nbformat_minor": 4
}
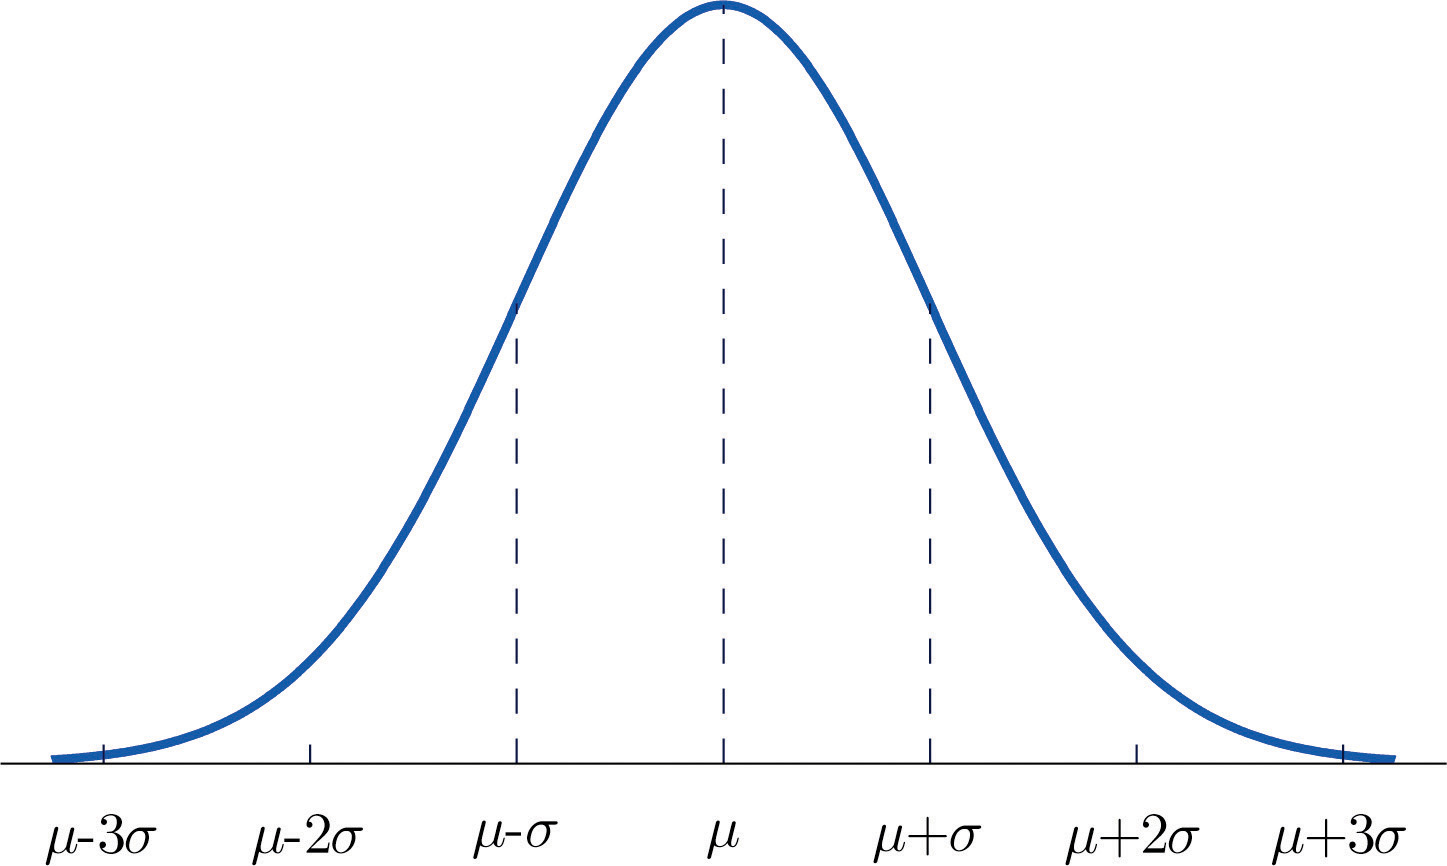 \n",
"\n",
"\n",
"In the next chart, we will plot the data and its corresponding confidence ellipses using 2 std and 3 std. "
]
},
{
"cell_type": "code",
"execution_count": 4,
"metadata": {},
"outputs": [
{
"data": {
"image/png": "iVBORw0KGgoAAAANSUhEUgAAAgAAAAHjCAYAAABVQKdLAAAABHNCSVQICAgIfAhkiAAAAAlwSFlzAAALEgAACxIB0t1+/AAAADl0RVh0U29mdHdhcmUAbWF0cGxvdGxpYiB2ZXJzaW9uIDMuMC4zLCBodHRwOi8vbWF0cGxvdGxpYi5vcmcvnQurowAAIABJREFUeJzs3Xd8jdcfwPHPzRSJICQ2sWdra0uMaoxaLdWWouavKC01alWLGlWqrV1FFa1W7U3sPSL2JmJGJILIvrn3/P44iMhNchOJ+X2/Xn1J7nPOeZ6bP/o9zxnfY1BKIYQQQohXi82zfgAhhBBCPH3SARBCCCFeQdIBEEIIIV5B0gEQQgghXkHSARBCCCFeQdIBEEIIIV5B0gEQQgghXkHSARBCCCFeQdIBEEIIIV5Bds/6ATJazpw5laen57N+DCGEEOIxCjBATCgYAAe3J2rt4sWLFChQgCNHjoQopdxTKv/SdwA8PT3x9fV91o8hhBBCJLTlXXj9e8hR5YmaCQgIwNPTk40bN1KnTh3s7e0vWVNPpgCEEEKIp8UYDocHg9kENf5+4uAfGhrKxx9/TGxsLN7e3tjZWf9eLx0AIYQQIqOZ4+DeebDLDM6FQJnAIXuamwsODubnn3/Gzc2NvXv34uDgkOo2pAMghBBCZLSQvXBiNBhsoHhXsE19wH7AZDKRKVMmbG1tUUphMBjS1I50AIQQQoiMcvpXOD8DPLzgjVlP3Jyvry/NmzcnS5YsfPnll2kO/vAKLAIUQgghnrqAvyFfMyjQHOyz6s+eIFiHh4fj7+9P5cqV+e2339LlEWUEQAghhEgvcRH63/CLEBMMzgXBIesTN+vr68uCBQswGAzkyZPnidsDGQEQQggh0kfsHdhQHd49BOWGpEuT69ev59KlS3z22WfUqVMnXdp8QDoAQgghxJMIOwuBG6BkT2joC7aOT9yk0WjEZDJRvHhx3N1TzOmTJtIBEEIIIdLCFA1xkXo734MtfXaZ06XpsWPH4uzszFdffZUu7VkiHQAhhBAiLc5OBRSU7guF26RLk/7+/tjZ2dG/f/9UJfVJC1kEKIQQQqTG0e8g9BCU6q2Dfzpat24du3fvxtHREVtb23Rt+3EyAiCEEEJY4/YRyF4ecnvrbH6G9HuHXrJkCa6urnz++efp1mZKZARACCGESIk5Dg71h+gQ8KgJjk92ct8DSimUUri7u5MzZ84nbs9oNFpdVkYAhBBCiKREXIKDX0HNxVB3Q7o3P3bsWHLmzEmXLl3Spb0zZ85YXVY6AEIIIcTjooN18HerDOW+eaIsfpaEhYVha2tL+/btcXFxSZc2b9y4QdmyZa0uL1MAQgghxKOUgrvHIWizDvxuldL9FuPHj2fBggXkyZOHLFmypEubXbp0wc/Pz+ryBqVUutz4eVWlShXl6+v7rB9DCCHEi+DEGHB0h2LpMyT/OD8/P1xdXSlcuDA2NjZPdJjPA0op4uLiMBgM2NnZYTAYDiqlqqRUT0YAhBBCiEAfMIZD4fbg2TrDbnPo0CHOnTuHra1tugR/gI0bN9K+fftU5w2QNQBCCCFeXUrpYf6gLeCUF7JZP4eeGjNnziRv3rx07tw5XdtVSuHt7U2lSqmfppARACGEEK8mUyysfwNiQqHC6AwJ/iaTCaUUFSpUoEyZMunattlspmHDhly9epUcOXKkur6MAAghhHi1mKLhxkbI1wS8Fqbbnn5Lhg4dSrFixejUqVO6t21jY8OECRPInz+//kApCN5pdX3pAAghhHh1KAXGe3BtNeRtBC6eGXKbwMBAnJ2d6devX7pt83vU9OnTcXFxoW3btvEfGu/CmV+sbkOmAIQQQrwagrbCvk6QyR2qTUvXVL6Pmzp1KmvWrMHNzQ0HB4d0b79Ro0bUrFkz/oPQg2CbWScsspKMAAghhHi53bugh/1zVgeXohl6Kx8fH/Lly8eIESPSbZX/o65evcoPP/zApEmTErZ/7jco0UOfVWAl6QAIIYR4OT1Y4X/rAKg4vcjPuUCG3jIkJARnZ+cMCf4AOXLkoHHjxvHtRwWCMsEbM1LdlnQAhBBCvJwO9oI8DcGzVYbf6scff6RUqVK0bp0xOQSUUowePZpPP/2Ud999N/7CjY0Qc0sfTZxK0gEQQgjxcrmxCTxqQ6mvwClfht7KaDRia2tL48aNyZUrV4beq2DBgmTPnl3/osxw9wQUbpfm9qQDIIQQ4uWhFFxeqOf6XQpn+O2GDRtG4cKF0+00P0v27NlDWFgY7do9EuzvnYdjw8BrUZoPKpIOgBBCiBefMRy2NYY6a6Habxl+u9DQUAwGAwMGDMDJySlD76WUIsG5PaEHIXulVK34t0S2AQohhHhxmWIgeBfYu0CVqWCX+ancdubMmfz777+4urpib2+fIfeIjY1lzpw5vPnmmzRs2FB/aIqFI0MhNvSJ25cRACGEEC+uyKtwYbbe4pdBefwfderUKYxGI/3798+wlf4PhIWFcfbs2fgPQv3AtTS8vSZd2pcRACGEEC+e6+vh0ADIUhTenJXmefDUOnXqFCdPnszw4L9582YcHR0ZPXo0Njb3Q7X/HLh7PN3uISMAQgghXhwxoTqpj/tbOvg/JRs3biQoKIg2bdo8lfutX7+ePHnyULp0aQj3BwxQZWK63kM6AEIIIV4cAfPBxgGKdwN716dyS6UU+fLlI3PmjF9fEBISwq1btxg7dmz8h8G7wRyb7rsapAMghBDi+Xdmol75XvLLp3rbxYsX4+fnx6hRo57K/fbt24efnx9Dhw7VhxaFHoTCbVOumAbSARBCCPH8igkFh+w6+GfQyX2WKKUIDw+nfv36VKtW7anc89SpUzRu3JjGjRvrD8IvQuB6yFUnQ+4niwCFEEI8v3a3gdt+4OEFmfM/tdsuXbqUfv36kSVLFgoUyNjzAwDu3LlD165diYmJ0Vn+Li+CbK9BhTEZdk9DguQCL6EqVaooX1/fZ/0YQgghrGU26XPtS/QAbMA2/Y/TTUp0dDQXL16kVKlSREdHZ3iSH4DAwEBy5cqFwWDQuwti78KRQVDpZ7B1THV7BoPhoFKqSkrlZARACCHE88McBwYbQIEp6qkGf4D9+/czdepUDAbDUwn+AAMHDmTz5s06+F9eBAZbqDo1TcE/NWQNgBBCiOdD7F3YWBMa7IfS/TL+fnFRELIbgrYQfGYD2w/684GXG7UaOcOpn/RhQoaMe082m82Eh4cze/ZsbG1t9TkGoQch51s6s2EGkxEAIYQQz1ZcFFxfBw5Zoe5GsM2UcfdSZgjcANtbwBJ3ODoUUIQV6MF5ly5QeyVUmawPFDr1U8Y9B7B27Vq+/PJLHfyvrYZ75/Scf+aMPcHwAekACCGEeLZib8G1VfoNOJNHxtwj+iacHAsri8PhAZCnAbx/jYvF/2LA33EUefNTBgz9AVxLgnsNqDQBLv2dMc8ChIeH07hxY6ZPn64/iLkFcfcy7H6WyBSAEEKIZ+PmTh1kq06FqpMz5h7h/nB8JFxZAgVaQPUFkKMqGAwopciVyx4vL6/EqX3ts+nkOxngzp07eHl54evrS6Z7fhAcBEU+zZB7JUdGAIQQQjxdxjCIuARulaFEBiX2ibgM+z6DdVUhcwF47yK8ORtyVgODgYCAABo0aICTkxNNmzZNXD/cHxzd0/2xoqKiyJYtG/v27SNTpkxg6wR2zul+H2tIB0AIIcTTdWUpXPoX7Jwga6n0bTvyGhzoAWsrgmNOaHoWXh+ukwndFxYWRqFChZg8eXLSh/pcWgAFP0rfZwM++ugj9uzZg7Ppuh6ZcKsIeeqn+32sIVMAQgghno4LsyBTHijSPv3bjrqh5/gv/glFOkGTUxbXEwQFBdGgQQN8fX0pUaKE5baM4XB9NVT+Nd0ez2QyoZTir7/+IkuWLBB7Wyf6eYZkBEAIIUTGignVq++zvQ5ZS6dv29EhcOhrWF1G36PxCag03mLwP3z4MLly5WLPnj3Y2SXz/ntpAbh7Qab0mwKYNWsWw4cPx9XRiGFvR7DPAvnfS7f200JGAIQQQmSsA92g+Ofpm9PebIQzv8KJMXqovtHRZFMF3717l/79+7Ny5crkE/wYw+HYMKi5NN0eNS4ujo4dOxIVFQUOLlCoFdjYp1v7aSUjAEIIIdKfUnBqgl7wV/2v9A3+N3fC2koQ6AP190K1aUkGf7PZzOzZs3FxccHHx0cvvEvOqXHgUUcvFkwHAQEB1KpVCzsbcPVrA9HBkLdhurT9pGQEQAghRPoyG/Ubro0DmGLA3jV92o0OgcNf60Q+lSZAwQ8hqUV89xmNRs6cOUNUVBQuLilk14u8Bmcnw7t+6fK4ZrMZT09Pli5ZgsHWHl77LuPyHKSBjAAIIYRIP3FR+u3cGAYle6bPPLoyw/mZsKas7kw0OQmFPko2+JtMJvr160d4eDhjx45NOfgDHBkMxT4D50JP/shK8fbbb+Pv70+u870gZD/kqJJih+VpkhEAIYQQT84Uo9/M8zeFd7ak31v/7aN6DYEyQ511etucFWxtbalUqZJ1gR90JsKb26HREUJDQwkICKBixYpJbxNMhlIKg8HAX/PmkL+AJ3iMBeeCqW4no8kIgBBCiCdnvKe3zplNkCln+rTn1xc2e0ORDlB/t1XBXylFq1atOHPmDJ988gmOjlacqBcdAvs/44BdD6pWfwdPT08aNWrETz+l7SyAkSNHMnv2bPLfmq63Jbp4ZuihQmklIwBCCCHSLvQQnP4Zqs+FatOfvD2l4Mpi8PsKcr0DjY9bPW9uNBqxt7dnwIABFCtWzOr73dvcBh+/THy9YDrjxo2jadOm/PLLL1y6dCkNj6/o0b0rtoY4cG2pM/09p56/LokQQojnX1wE3DsP2cpB2YHp0+a9C7C1ERz7Tu8ceGtOqhbNtW7dmp07d1KxYkV9wl4K7t69y/xR73Ll5CYuZf0fJ06coHnz5tjZ2bF7926qVUvdToD9+/fTtm1b3MLWkPXyz3oa5DnY7pcUg1LqWT9DhqpSpYry9fV91o8hhBAvl6vL4dYBKD/yydsyxcDJH+Hsr1C6P5T8CmwdrK4eEhJCtmzZuHPnDjly5LBq3t7Pz48vOr/P2l7BxNVcjVvRug+vnT17lurVq3Pu3DmyZ8+eTCvxlFKYTSaunNuPZ6m3wByTsccaJ8NgMBxUSlVJqZyMAAghhLBewAK4tFBnsUuP4H9jE6x5HW4fhIYHocyAVAV/gKFDh7Jq1Spy5syZYvBXSvH777/TpFF9lvd3wrXqdwmCP8C3335Lnz59rA7+UVFR1K5dm6jrO/AMHqdX+j+j4J8aMgIghBAiZXGRel9/2CmwcQTXJPLoWys6BA72gpBdUHmS3j2QSv7+/jg7O5MjR47kU/veFxkZSffu3Tl48CDbf66Im8NdqLUswQK9Q4cO0ahRI86fP4+zs/Wn9Pn7raBIpWZ6EaRNytMPGUlGAIQQQqSfwwPg8iJ9gM2TBv8rS2HNa+CUW+fuT0PwB1i+fDlbtmyxKvifPXuWN954A7PZjO+iPrhF7YG35iZanf/NN98wePBgq4N/t27d2Lt1OUXuTAJz3DMP/qkhuwCEEEIk7doqyPEGVByn3/yfREwoHPwSQvZBzUXgXiNNzRw5coSIiAi++uorq8r/999/fP7554waNYr/ffgmhs3vQN1N4JAtQTkfHx9OnDjBkiVLrH6WIV3ewqNcA3Bs9lwl+bGGdACEEEIkLey0zoz3pBn9rq2G/V2hwAfQ6DDYWT+8/ribN29y9+7dFMvFxsby9ddfs2LFCtatW0fl14rBuipQ6WfI/nqCsqGhoXTq1InZs2dblTtg4cKFXDh3ikF1zoChCRie/zn/x0kHQAghRGI7W+nc9aX7PVk7sXf1nv6grVB9/hMdCrRnzx6OHDlCt27dUix75coVPvroI3LmzMnBgwfJni0r7GihD+Ip3DZBWaUUXbt2pWXLltSrV8+qZ2lSJoSgCu9DifJp+i7PA1kDIIQQIl74Rf1v2cGQ5Qnn+gM36Ll+G0d9XO8TngiYN29eSpRI+Zm2bdtG1apVef/991m+fLlezX9sBETfhIqJs/vNnTuX06dPM2bMmBTbvnLlCi1aNCeTCqVwgVxp+h7PCxkBEEIIoZlNsOdTqPFvoiHyVDHeg0P94fpaeGMW5LHurTope/bsYd68eUydOpVChZI/qGfevHn07duXv//+G29vb/3hxfk6JW/9vYm2GPr7+9OvXz82bdqU8lHBQL6wv/m+3yfYvPZhmr/P80I6AEII8aozRcOp8XoPvvf2J1vMdnMH7GkPud7Wb/0OWZ/o0YxGIxUrViRLlizJllNKMXz4cObMmcOWLVsoW7bs/efZDn59wHsrOCV8Y4+Li6Ndu3YMGjSI119PvsPz4IyBiQPqUbZSnSf4Rs8PmQIQQohXmdmk9/fbuYAypT34m2Lg0ADY9TFUmQhvznri4H/8+HEaNmyIo6Mj5cqVS7JcTEwM7du3Z82aNezduzc++IedgZ0fQo2/IWuZRPXGjBmDk5MTvXv3TvFZDCdGMaJrNdwrdEqfI46fAzICIIQQr6roYNjSEBrshVIpB8Ek3T4Ke9qBS1F490i6BMgbN25Qrlw5/vnnn2Sz+4WGhtKiRQuyZ8/O1q1byZw5s74QHQJbG0P50ZDbO1G9/fv3M3nyZA4ePIiNTTLvwkrx04SfKO+ZFe+mbSG5si+YF+6bGAyGhgaD4YzBYDhvMBjS6QQKIYR4hZjjIGSvDtR1VqX9wBqzCU6Og83vQKk+UHNxugT/a9eu8d5772EymXB3T7q9CxcuUL16dSpXrsyiRYvig78pGna8DwU/hKKdE9ULDw+nTZs2TJkyhfz58yf/MGd+4dNqtyhX40NwsC418IviheoAGAwGW2AK8C5QBmhtMBgSj+sIIYRIWuQVODtZH73rlCdtbYQHwKa34foqaHAAirRPl0Q4e/bsIV++fOzatSvZE/327NmDl5cXX375JT/99FN8WaVgbydwygvlR1ms26dPH2rUqEHLli2TfhBlZte29Qz94yLubw4id+7cT/K1nksvVAcAqAacV0r5K6VigX+A957xMwkhxIvhznE4MhRcCus9+WkJ2EqB/xxYXxXyN4O6m8HFM10e7+7du4wZM4aoqKhE6X2bjSxHRHg4oDP7NWvWjJkzZ/L5558nbOTYd3or45t/JkrzC7B06VI2btzIxIkTk3+YS/9SzWEZLT/prI/1fQm9aGsA8gFXHvn9KvDG44UMBsNnwGcABQsWfDpPJoQQzyulIC5cZ/TzqJn2dqKDYf9nEO6vU+k+yVbBBI+n+OOPP2jXrh0rVqywWGbF0BM0O+lKjfJjmDx5Mj4+PlSoUCFhIf8/9Za/BnvBzilRG6dPn6Zr166sWrUKV9ckgrrZROjVw3TstYBF/86nfKaXM/jDizcCYKm7mug4Q6XUDKVUFaVUleTmj4QQ4pVwdRn49QX7LJCnftrauLYa1pbXyYEa7E+34A96O965c+eIiopKsowxNpbcLl1YsGABe/bsSRz8g7bA4a+hzmrI5JGoflhYGM2bN2f06NFUq1Yt6Ye5tY/sV39h8OAh2L/EwR9evA7AVaDAI7/nB64/o2cRQojnW9gZffBO/vf01ry0MMXCwa/gQHeovgAqjgXbJzwU6D6z2cyAAQMIDQ1lzJgxSb6V3717lyZNmnD16lV27NiReOHe3dOwq5V+vqylLd6nQ4cO1KpViy5duiTxMEbUjS183PNXLrh/yxtvJBpcfum8aB2AA0Bxg8FQ2GAwOACtAMvjRUII8aoL94d75/VcuG0aDqu5dx58qkPERXj3MOSqnfo2DAa4cMHiJRsbGypWrJj0cDxw+fJlvLy8KFq0KCtWrEicECjyGmxtBOV/gNx1Lbbxww8/EBgYmPy8f+RVDJf+4uv+/SlStGiKX+tl8EKtAVBKxRkMhp7AesAWmK2UOvGMH0sIIZ4vZybqxD5FO6W9jYAF+uject9CiZ5PtsK/WDG9DuERHTp0oE+fPrRq1SrJasePH+fdd9+ld+/e9OnTJ3E+gOgQ2FwPineDoh0ttrFu3TomT57MgQMHLJ/yZ4oB/z8YtTCYkiUb0rJllVR/vRfVC9UBAFBKrQHWPOvnEEKI507UDbDPCvma6fn+tIiLAN8vIXgHvL0B3Co+2TM9FviNRiP29vb07t2b0qUTD9c/sHPnTj744AN++eUXWrdunbiAMQy2vqunN8p8bbENf39/2rdvz6JFi8iXL5/lG5ljISqQNq3b4poth9Vf62Xwok0BCCGESMqJUXDDR2/Lc0xDMLtzDNZVBbMRGh588uBvQefOndmwYQMVKlTA3t5yAqKVK1fSokUL5s2bZzn4m6Jh23vgVlln+rMgMjKS5s2bM2TIEGrWtLDzwRQDfn3Ztm0rvWffxbNIcdzc3J7kq71wDEolWkT/UqlSpYry9fV91o8hhBAZ59x0yNsIMue3uPc9RUrB+d/g6FB9XG6RT9PnuVavhsaNAb2Qz8nJibCwMNzc3JJMv/vHH38wePBgli9fbnm1vtkIO1qCrRNU/wtsEicLUkrRtm1bbGxsmDt3ruVUwkpBwHyiPN7n8tXrlCxZ8om+6vPEYDAcVEqlOJfxwk0BCCGEuM9s0gHQzhmUOW3BP/YO7Psf3DsH9XaCazoFwk8+gQULHk4BjBkzhpIlS9KxY+K5esNwAyj4wekHpk2bxtatWy0HZGXWWf7MRvD6z2LwB/j11185efIku3btShz8lYJdrQkp0I/Wn81lzZpWL1XwTw0ZARBCiBeRUrDZG6pMgayl0tZGyF7Y1RryNYGK49K2UyApRiNERnIrLo7o6Gg8PDyws7NLEJC3BWyjzp91wAxsgLL3yrJ+/XrL8/VK6UWJtw/D2+vBLrPF227dupVWrVqxd+9ePD09E16832FSwXvBrQrHT57itddeS7ev/LywdgRA1gAIIcSLJniP/veteWkL/soMJ3+E7e9BpZ+hyqT0Df4A9vaQNSsrV65kwYIF2Nvbxwf/oUPB0ZFyHuVoU6YNzU41I09YHj4e/3HSi/WOfQfBO6H2yiSD/5UrV2jdujXz5s1LHPwBdrVCBe+mWadR+AdceimDf2rIFIAQQrxIzHFwahxUnQaZ86a+flQQ7PkUTBH6EB/njEmXHhwczLlz5+jQoUPii+3bYy5VEnuTPaF/hGJra8sHoz8gZ46clhs7NQEu/Qv1doBDNotFoqOj+eCDD+jduzf16tVLeNF4D+ycUZV+xpA5L2PHjqVIkSJP9gVfAjICIIQQL4K4CNjfVc9/11oCTrlS38aNjbCuEuSoCu9sTV3wNxhg/HgwmaBcOf1v06ZQqZLF4ufOnWPbtm2W2ypWDOdT/yNr2ay4u7uzdOlSJr03ie5Vu1to6Dc4OxHq+lhM8Qt60V/Pnj0pVKgQX39tYUvg4QFwZTHf/vAb/y78jzJlylheGPiKkTUAQgjxvDOG64V+V5ZAgeapX+xnjtND6P5z4K25kPud1D/Dg4BZujScOpXw2iNxJCgoiFWrVtG5c2fL7ZQty8kCHlQ+vpeatWuybt66JHcE4D8Xjg7RnZUsSWfnmz59OpMmTWLv3r0JMwVGh+iFgjaZUDaOBN64gYuLS7KZB18GsgZACCFeBlFB4FMDlAkKfpD64B9xGTbWhtCD0NAv9cHfYEiYBfDx4P8Yk8lEZGRkktf9v/oK70NHcXjdgfXz1ycd/C//B0cG6mREyQT/LVu28N1337Fs2bLEaYIv/gkBC1i/aTs9v/iCvHnzvvTBP1WUUi/1f5UrV1ZCCPHCiQ1T6soy/bMxIm1tXF6i1GIPpU78qJTZlLY2XF2VatZMKf2en/A/W9uHxW7evKm+/PJLFRcXl7C+2azUxo1KKaWOHj2q8uXLp6ZOnZr8Pa+s0M8dejjZYmfPnlUeHh5q06ZNCS9EBuq6ZrMym0wqJiZGXbx40dpv/MIDfJUV8VFGAIQQ4nlkvAvBu3SoTWLVe5JM0XCgJ/j1gaA2UOjz1I0cmEz6rf/ffyEsDFZYOHNtxQqIi3v4a9asWalZsya2to/tzb90Cby92bN7N97e3owbN47u3S3M9T8Q6MPtbR/w1vlbkL18ksVu375NkyZNGDFiBHXrPnYIUKgf3NhE0M2b1KxVCxsbG8u7Al5xsgZACCGeJ7eP6qx8VaekrX7YGdj5MWQpDm/8Do7ZYf9+qFrV+jaMRsiZEwoVgmPHEl/Plg3OnAEPDyIiIvjwww9ZuHAhLi4uFptbv349bdu2Ze7cubz77rtJ3/fmdtjREq/zweyKBvWd5fhkNBpp1KgRZcuW5Zdffom/EHkVQvZAwQ9RSmEwGLhw4QJFX5HT/R6QTIBCCPEiUUq/9buWgMJpTMXrPxcO9YXXR0Kxz/RbfGpf8tavh4YN9c+Wgj/o0/08PDCZTDg7OzN8+PAkg3/h/xUmfHk4y5Yto0aNGgmuzTg4gzhzHJ9X/ZzGv+Zkjlso7vV82PlB8usUevfujZ2dHePHj094IS4SooNRSuHt7c2MGTNeueCfGtIBEEKI50HQZjj/O3j9AznfSF1dU/T9E/y2wzubIdsTJLh5//2Uy1y7htlsxsvLi//++4+qSYwuzJgxg4B/A/j8l88TBX+AAT4DMJqNfF6sOrOz36L9DViTwiLFKVOmsHXrVnbv3o2d3f0QFh4A52dA+VGYXYphYzAwc+ZMGfZPgXQAhBDiWYq8DuHnIVddcPdKff2IS7DjA3AuDA32g/0TrnKPjk762oULULAgdyMiyGpjw+LFi8mb13IyogkTJjBp0iTO+Z2jWLFiFsvcHngb7pyAzd7kqrOINQU/SPbRNmzYwPfff8/u3bvJmjWr/lApyOSucxsYDAwcMIBKlSrRqlUrq77uq0wWAQohxLMUcUlv0TMYwNYxdXWvr4f1b0ChT8Br4ZMH/+S8+y4UKQJ2dnz88cccPHjQYvBXStFzYE+mT5/Otm3bkgz+gF7vsKUeVJqgtzgm49SpU7Rt25b//vsvPotfeABsbaRPBizQHLPZTL9+/WjWrNkTfNFXiDVbBV7k/2QboBDiuXR1lVInx6Wtrtmk1NHhSi3Jq1TQtrTdKdWWAAAgAElEQVS1EROj1NChSmXKpNRnnym1d69SFSok3uq3aJH+d+5cdfnyZRUdHa0iIyMtP1bHjmqgm5vCHbX+0Prk7x96SKnFuZUK+DfFRw0ODlZFixZVs2fPjv8w9p7eYnjnhFJKqZUrV6pu3bpZ/fVfZli5DVB2AQghxNNkjgNzDBjDICYUspVNXf2YUNjdFuLu6bd+pzypf4a4OH1YzwO2tuDkBOHh8Z9VqwY//wzVq+vUv5Mm8cWSJTRs2JDGjRsn/lpmM1/lzMnO27fptftPPqzyIU72TpbvH3pQv7lXmZrim39MTAze3t54eXkxZswY/WH0TdhcDxoeBBs7TCYTSimCg4PJkycNf4+XjGQCFEKI59G5qXDqJx24Uxv8Q/1gXRVwLaUX+6U2+BsMULGiDv7ly0PB+2cBmEx669/bb+vfbWwgMFAHf+Dc0qVcKVaMiRMn6uCvFDRvrjsMSnE7pyttW7fkQKlSbLp9m/Yb2rP7ym7LzxCyXwf/ajNSDP5KKbp06UKuXLkYNWqU/vDuSX0mQP3dYGNHYGAg1atXx2AwSPBPJekACCHE03D3JNw9DcW6QdnByZc1GuHxkcsLs2BLA6jwA1SeADb2Ca/7+SVM2ftAUJD+3GyGlSvh8GH9+ZEjcPlyfLmYGNiyRf9sNie4tmXLFnbu3JnwAJ1lyyAiAmNcHP+7c4/j506xYcMGsmXLhvpO8U6RxKv5f1/fibANtWl84SaHbQsl/zcARo4cyZkzZ5g7d65OGWwMgwOfQ1wU2DljMpnIkycPS5cuTZyASKRIOgBCCPE03PKFsJNg6wA2KWzAWrcuPnGPKRr2dYFT48F7OxT6yHKdnDmhY8fEn2fLBg4OMHiwPr0vOTly6KkAR0fYvp3TBgObN27ks88+o3Xr1vHl7ucXOMMdPvr4IyLqNWTfLr8kcwEAcHMHbe78x4fXolkTCVsubEn2URYsWMCsWbNYsWIFmZ2c4OJfYOcC72wBOyeUUtSuXZuLFy8muRNBJE86AEIIkZHOTIarK6DIp1CghXV1mjbVw+zhAbChhn7zbbAfspZOuk7BgjB7dsLPTCaIjIRvv4WxY5O/54QJcOuWPvI3OBiKFCHE05PrN25YLB4VFUUpr1JcvnOZZcuW4eSUxHw/cPPCQm6uq0WzS+FsuH9OUJ9NfTh+/LjF8rt27eLLL79k5cqV5M6dG8yxEHoA4sLBYMBoNGIwGFi0aBGFCxdO/nuJJEkHQAghMkJcJCgzeNQEtxTXYyV2fS1seAMKt4Ua/4J9lsRlunTRATtBvevw2mswYwbY2YGbG3zzTdL3sbXV7XTsCL16QY8enFy2jF8WLcLr4kXatm2bqEp4eDiNGzfmk2qfsG/DPhwdk96+uGJbL9j1MR/dgE1R+jPvAt4AlCtXLlF5f39/WrZsydy5c3mtbGk41B9MkVD5l4fbHHv37s2iRYt050CkmXQAhBAiI/j1gStL9YE2mVMxRK3McHSYHvb3WgSlvrI8tw+QNasetn9UZKRewDdihP49pWF/kwlmztRTBb/8AkqR3ds7Poue2fyw6NlbZxm1YRT169enaNGizJ07Nz4b32N6runJvYBFeF2ZygeBsO1+8K+YuyI+nXws5vm/c+cOjRs35ptvvtFnBhhsIVt5sM18/1HMxMTEMGrUKN63JmOhSJZ0AIQQIj3d3Amxt3VyG2uH/B+IuQVbG+u0wA199ehBcn76KfG8f7FiEBIC167p31eutO7e773HhQsX6NSpE7lz59YBdts2PUJw34ajG/imwzdUqVKF3377LdHCu2th19hxaQd15tTB/8QUorZ/SJNrcex8JLlgUHiQxdsbjUZatmxJ/fr16fH557CtGUQE6BGQ+wmS5s2bx5AhQ8iWLVuSHQ9hPfkLCiFEegraBDYOkLNa6uqFHoQdLaHAB1BhTOJV/sm5fRu++ALmz4d581J339hYcHRENWxIwYIF6dSpU/xqfy8vuHABpRRBQUFM/2I6A9sPZPTo0Ql3BNw3ZucYphyYQlNn+D0XNL0O+2MSlinqlvhwHqUU3bt3J1OmTEz4cZQe8Sg/Cpw9H5a5d+8ebdu2JTIyMnXfTyRJRgCEECI9HBqg89q/9l3qg//5mbClIVQcB5XGpy74g97q99df+mcfH1ixIulpA4A37h82tHw5xMZyKzgYr/nzUUrh5fXIeQS2tqjChbHpa8ObNd6kVatWiYL/t1u+pc6cOtyKvMWUA1Nom92Z3z2gsYXg/1mlz9jecXuixxk5ciSHDh3in3/+wXbne3DnmD7Q6P59Tp48SePGjbGxsSFLFgtrIUSaSCZAIYR4EnGRYJcZgrboxX6WFuslWTcKfHvqM+xrLoGspZIu27o1ZM4Ms2Yl0VacDpjWDI1Pnw6urpA7N1F16+KkFBcuXEhwdK7JbGLd+XWUtitNzTo16dOrD3379k3QjMtoFyKMEQCUcCtBk0zR9HO8TKPrcPix4A9YnPefM2cOw4cPZ/+mBbh7VtEL/h450yA0NBQ3NzciIyPJnDlzyt9NSCZAIYR4KrY2gjvHIdfbqQv+4f7gUwPiIu5v8Usm+APUrw/e3pavTZigs/tZ+0I3ciS8/z4xb71FtTJluH37doLgD3A65DRNJjahdu3aDB08NFHwB5jYYCIA/7T8h0qxZ+nneJkG1xIH/5hvYiwG/w0bNjBw4EDWrl2L+40pEOqbIPhHRUVRu3ZtwsLCJPhnABkBEEKItLixETzqgCkqdYEf4Noa2NcRygyGkl8mP1xvDWvr29vDkCHQsyfXcuYkX2wsYVFRuLomPkXw6NGjNGzYkMA3Atn+y3ZqFrK8ILHG7Bp4xV2kt9MNvK8qTsZavvXjHYDDhw9Tv359Nv39Da95tQJH9wTfIygoCA8PD2JjY5PdZigSkxEAIYTIKErBpX8gKjB1wd9sgqPfwv7PwGsxlOr1ZMH/0qXU1TcaoWRJlJsbbb28OH/pksXgv3//fspXL8+gUYNYNGoRx29aTtgDUDpsH184BlL3SuLgb8Dys12+fJkmTZowdepUXssbrY9Efux7dOnSBT8/Pwn+GUhGAIQQwlrmOPDtAeVHg2OOlMsD3LsHWbLoLX67PtEnAdb4B5zSmMTm5k292r9PH52/P1OmZIub8uXjbN3XKX3+DuzZw5HDhylZsiT29vYW8+f/ueJP+nfpz+36tzk84TBLTy/lr2N/carHqYdl6s+rj9FsZFXV97h14Cu8r8E5o75WMXdFQiNDGVZnGB0qdkjU/u3bt/Hy8uLnL16nfstekPPNBNdDQkJwcnLC0dFRtvqlkYwACCFEejJF6xz+eRsnmKdOkasrLP0F1lWG7K9D3Y1pD/4A+/ZB3776jTlTJp3nPxm3Cuei9Ly1sGcPhIQwY8YMjhw5YjH4b9myhQ6tO9Dzh57EFY8j0hjJkJpDEgT/c7fO4ePvQ+nbWwn17cvbjwT/ynkqExoVSsBXARaDf0xMDM2bN6d+/frUf68TOOZMVGb69OnMnz9fgv/ToJR6qf+rXLmyEkKIJxIXpdSqskrF3E593XPzlFqUU6mAf9J271y5lKpZM/53o1Gp3r2VAqXc3JRycdE/P/6fq2t8nchItf+nn9TF0qWTvM3GjRuVu7u72rp168PPgsKDFMNQRpPx4WcMQ33xM8p/DspzJIphqLaL2iqGoXyv+ibZvslkUq1atVJzBr6uTBf+THQ9OjpaBQQEKLPZrMxms5V/HGEJ4KusiI8yAiCEEElRCm5sBttMUG8XOGSzXM5shu7ddVKdh3XNcGQInPgG3t4AhT5OWGfJEli1KuVnaNkSwsKgYkWdq790aZ2yFyA0FMLDLddr3jz+Zycn/P74gzN371os6uPjQ+vWrVm8eDG1a9d++LmHswf7uuzDzsaOvuv70nZJW/plg17ZoM5VCIjT5eYfnw9AoWxJH/E7aODXBF6/TKt+C7HJ1zjR9R07djBmzBgMBoPFJEMi/ckYixBCJCUuHM7/BjnfAoesyZedPh3GjNFD8sYw2NUGjHf1Fr9MHgnLRkXBb7/pg3qaNEl4LThY/+voqHP9T5wIU6boz65f150Ba8yeDVev4legAMFr1tDV3R2GDk1Y5uBB1oeE0K5dO5YuXUqNGjUSXFZKUS1fNc6EnGHC3gmMzgHvZ4Xa1+BaXMKmXB1dORt6lpzOiYf1J0+ejNvNuaz5qTuOOUomusexY8fw9vbmnXfese67iXQhHQAhhHhczC04Ngwq/Qxe/6Zc3sYmfg9+2DnY/h541IbKi8H2kTn6mTPhwgX44Qc9WmBvIeNf+fI6qc/Nm3p/f506OrnPg8+s4empnyl3bmL69iUyOlqfG1ChQnyZW7dYW6UK7d3dWbZsGdWrVwfAMNxA+/Ltaft6W+rNq0e/t/oxYc94pnlAZUeoeQVuxZ8PRKXclTgRdIKwmDCyZUo8QrJiyQJmTh7JslXbyGzh6N7AwEAGDBjAqlWrLK5LEBlHOgBCCPEoUwzYZwOPWvo0utS4vh72tIPXR0Dxbomv+/nprXigD/GZP99CG9f1vw+GwV1c9El9ISEp379wYfD3B3T63DVr1tBv/HjdObGx0Z2PIkUAWL13Lx3d3VmxYgVvvhm/En92s9mM2TmGpaeX6scwG/krN3jYQt2rEP7YxjG/G34Pfy7jXibBtT179rBh5mes+fUT8hYrnehx9+/fT9WqVVm7dm3K302kO9kGKIQQD0RcgR0toME+MKRiiZRScHoCnBoPXgtTPsUvOWaznvdfujT1daOiHm4LDAoKYv/+/TQtVQratIH9+x8WW7lyJV26dGHlypVUqxZ/bsGDeHAn+g5uP7rhZIDFeSBGQasb+t+kmL41YfPI3+zC8Z180bkZX3w3//7Rvgnn9U0mEy1btmTq1KnkyZMn9d9VJEm2AQohhLXMRgjeA84FoO6G5IN/dLROy2sy6d/jomDPpxAwHxrstRz8ldIB8MERvY979IS73Llh61Y9/28NZ2f9b/fu4OTE5cuX6dixIx4eHjRt2lQfFBQQ8LD48uXL6dKlC6tXr04Q/AEyj8pMjh9zkN0pO9lswCcfBJmgZaDl4O9sr++9s+POBMH/5s2bfNPrI77t7s27jRolCv4HDx4kIiKCpUuXSvB/hqQDIIQQEZfh/HQdqB2yJ1/WZNIn7hkMUDYvTHLXHYh6u8D5/ir4DRvig96RI7BzJ9SoAcOHx7djMMCOHXD8uA7iZjNcvAgHDkDjxpDEiv0EDAY9RaAUfPMNCsh79izt27ePX0lvY/NwYeGQKUP4tNOnrF27lipVEr4ghsWEEW2K5nb0bTzHZGJrfjgQDZ2CwJTUn80YwbU+16hRMH7xYGTgAWYPqkYJr//xZoeFFustXryYY8eOpfz9RIaSDoAQ4tUVdhaOjYAsReGtP61Lq+vsrAPurX3wnQkqd4MaC/SJgA94esK0afrnkSOhbVvo2hXOnYsvs3OnPpa3bFkd7Fev1vPznp6W1wY8ysZG7zjo0UO/4Y8eTbirK7WLFSOmVCnq1KkTX7Z6dVCKxYsX8+vQXynSswiVKlXipyY5mDnz84fF6szRdQrZgU+eGBaFw1chkNIk8aKTi9gWsA0Ao9FIj96DcMlZmGHDhiUq6+/vz8mTJxk9enSiHQfi6ZNFgEKIV5M5DjLlguzlU1/3wh9weADUmA35miS+PmoUzJ0L3brBf//Ff96uXfzPjwbAmzf1vL+tbfzUQnKUgv799ahB6dLE9emDy+DB/LZiBc758+syBgOcOQMlSrBw4UJ69erFxg0bebOKXvDXbksos3Kshy66eKPijYgOPcT6vDD2NswMdwQsnOkLRA2JwtHWkXOh5yg5uSRjvcdSWN1hzfT3uXa7HjPmr7W4l//w4cOEhoZSpkwZC62Kp01GAIQQr57gXbCrld7bn/896+uZ48C3F5wcA97bLAd/gD//tP5o3h499DRBbKx1wb95c3By0lsDb97E3K0bXhUqcPnyZUqXfmSl/aRJUKAA//zzD7169UK1Vby1+q2Hlz0iFIP+vADArsu7aJAtO5vzweBbBqbchRhT4uBfq1At1HeKTHaZMBgMuDq64l3Ym6/f7M2CBUdY61uARYsWYf/Y9sawsDDWrl1LixYt6NKli3V/F5HhZARACPHqMBshPEAn9qlSLHV1Y27Bzo/Axl7vEkhprUBygoOhdm04cQKmToW//7a+7oPdAYsXc9fFBVeDgRUrVuDh8ViyoZ49+fvvv+nXrx8+Pj6UKRv/1h0dF41ZmXGyc2LO4TnM9+nEgtzQ6Sasjki649KqbKsEv+d2yY3Pe79y458KTJsRwe7dey2eLnj9+nV2796tdwOI54aMAAghXh0he+HUj3qVv1Mu6+vdOQbrq4FbZai9Om3Bf9o0Pc8P4OEBp07pufzff4c7d6xvZ+ZMvWvg/ffpUKkSu7dvTxz8gfnz59O/f398fHwoV64cNgabhyv1i04sivNoZ3qs6cGKTZ1YkAc+vAGrIyzfsmulrmxst5HuVbvHf6gU3LvAxgPXqfNNMKtXryFv3rwJ6plMJubMmUOJEiX4/vvvrf+O4qmQDoAQ4uV37zwE/KO36FWbkbq6V5bCprrw2nCo+CPYWJEcSKn4hD8TJuh8/X/9pU/yA1i0CJo2hapV4X//S76tzPcXF771lk4D3LkzQWFhREVE8Le/PzUqVkxU5c8//2TAgAH4+PhQtmzZh5+HxYRhGG7gXM9zFMtejKiz05jqAQ2vwfYoy7evnKcyv/n9xoQ9ExJeCPfn7qY2fPJJa2b8uTjBfR6IiorixIkTGB/8LcRzRToAQohXg+l+hLP2oBllhmPD4WAvqLMWCre1/l716sUf09u3L5w8qVf9d++uF/y1awcrV+otf8n5+GNYsED/vHs3ZMkCwK+//srSlStxUkofN/yIP/74gyFDhrBp0ybK/leWpguaopTi7K2zuDq68uf7fzLr0CyaqPOMyGFDnatwyPJaPwAOBh5kRasVrG5zf/QiLhIuLeTcDTOlugfw++8zqVWrVqJ6c+bMwWg0Mm7cOBwdHa36s4mnS9YACCFeXoE+ELgOKv0EWVIx528Mh73tISpQH+bjlDt19125Mv5kwLAwWLtW7/Fv104P/7u7w+XLSdevU0cnAxo5EvLl050HIDg4mPDwcEY2aIDNpk2Jqs2aNYthw4axefNmSpQowZmeZ8ieKTsb/TdSf359OlXsxLLTS+ntdJuuWaHGFTNX4hI1A0Be57xcj7iOg40D1fI9kjAoLpzwy1tp0H4A338/kvfeS7yIUilFYGAgMTHJ9CzEMycjAEKIl4/ZBDGh4F4dilnIyZ+ccH/Y8Jae539nS8rBf98+vb8/JgY6ddJb85yc4jP5deig3+TXrdPTAteuJR/8QQf/3Ll1ToAePeB+kN20aROLFy/G5ty5hNsLgRkzZjB8+PCHwR+gRI4SuDu7U39+fZzsnPjj0GxGuNymkTPUvEqSwT+3c26+f+d71HcKJ3snouOiIeoGHOjBnSg7avTcRZcu/7O4on/58uUcOXKEQYMGkTt3KjtO4qmSDoAQ4uVzdSkc/RbsnMG1uPX1bmyGDdWhWFeo9jvYWjF0XacODBum8/D/8Ufi60uW6GAdGakTAlmjTRt9KJC9Pbz9NqFTprB5zBharV5Nvz594PRpeCST3vTp0xk1ahSbN2+meHH9fcftGsfRG0cxDDfglskNZY5lWcEslHWAt69BSDI7Dj1cPDgadBSAOwPvUMg1PzjmIMatNu+935w6deowaNCgRPVen/Y6K0+t5GU/Y+ZlIYcBCSFeHpFXIfIa5KgGKk5v2bOGUnB2MpwYBdX/htx1dSKfkiV1tr7HnToFpROfbpeIyaT36+/eDT//DL6+cO9e8if7eXvDsmUQEaHLenpy6OhRVlWqxNCKFfWIg4ODzh7o6sqUKVMYN24cmzdvpsj9k/5AH+vraOtIjCmGMtk8GZs5ALOCj29A9CP/28/lnIugiKCHv09qOIlGJRpROFthncwn8jrsaEHc29v48ONWODk5MX/+fGxsEr4/Hjp0iO8XfU+/bv2oXqB6yn8bkWHkMCAhxKsn7AzcOqAX+lkb/E0xsK8LXPgd6u/RwR9g4EA9d/84sxnKlIGrV/VbvcGgV/k/8O23Ou0v6OAPUKuWHgW4fNly8K9QQf9bqRJs3AitW0OuXNzNmZPpv/9OhQoVGDptGnz3HcyerTssrq5MmjSJ8ePHs3Xr1ofBXynF1bCrgE7m82vdEUxzCeC2CT4ITBj8gQTBH8DBzoGiE4uy7dI23aHKnBfl9R/de/QkMjKSOXPmJAr+AE5OTnR8s6ME/xeILAIUQrz4rq+DiItQvDvkfsf6elFBsKM5OOWBervB3uWRNq9brmNjkzDL3/bt+kAe0HP833+vA7+Dg07vu2gRxN2fbH8801+uXDqX/+HDULgw+PnBrFl6LcH58xhjYwkLC9Mdit9/xzjsW+z/WQhduzJ58mR+/vlnrrS4wi2HW3jiCcCqs6to9k8z7g68y7++k6hy5ht2xEDv4IR5/W2xxdbWllhTLHbYEUcc7k7uVMpdCfWd0n+b7e9BvZ0MHfMbR44cYfPmzTg82N1wX1BQEJMnT2bEiBGUKlXK+r+9eOZkBEAI8eJSCqZOhLvOkMPCUH1y7hyDDW9A7nrg9V/C4P9ASql5ldLz9Q/299vb689sbWHyZB38kxMUpEcQPv9c7xL4/Xfo3JmIe/foX7w4Lr6+fN2vH4ahQwlZ+S8OjMB88gTTpk1j/PjxbN68GZOriX3X9j1ssmnJplz56gp3bh2hyeWxLI+AXsGJD/UZVmcYPav21F/z/nl/IVEhLD+1WOc+cMoF9Xczaco0/vvvP1avXo2LS+K/UebMmSlZsqTF3P/i+SZrAIQQz150tH5LthBgknXuNxjcDd69/9ZsrWtrYG8HqPwLeH5iucyZM1CqlB7yTy645cgBoaH6Z5NJjxBERED+/Cln+HNwiN8u6OICR49C4cKYTCbmzZ7Np6NGYRMUpBcYAqFRoSyet4gR3bqSe2Axdo44jqNdwoWKb/z+BrlMoUzJfIHxtxUTLTyCq70rYcYw8mbJSxb7LJwNPYu630VQg0IxHRrAXPsqOJ11pX///uzYsQNPT88EbURHR9O7d29+/PFHi+l/xbNj7RoAmQIQQjx75cvD2bPWH6ATHawT+xT+FBa01av9raEUnJkIp8ZCreXg/lbSZUuUgAsXdPBXCrZsgbp146//9ZdOzHPrFuTNq9/mba3IEgh6YeGBA/HBf9o0KFcOc5EidGjXjh8aNKDDZ5/pjoXZ/LDasgXLGPH996x3zcKb6jzHbh6jSl79//lDgYcYtGkQjqEH+D2Pol8IzL9n+fZhxjBsDbZcv3cdRxtHFIpzXX1xODkabJ05U6Q3nfqWxWO9Bxs3bkwU/AEcHR2pX78+We4nJxIvHpkCEEI8e2fOWB/8Aa6tgKsrwM7J+uBvNsKBz+HCTD3fn1zwBx34H6yqv3ED3nlHf/bllzoot22rT9wDvV7g33/1AT8pBcTXXtPtjRunf793D7p1Q9WogY1SdOjQgVwffaQPDMqeXY8wAHPnzmXo0KFs2rSJMnfCCBujHgZ/AN/rvmQJ8mFxXmgXlHTwf8CkTHqXgDkG9a2Zq1F3UG5VwMaeiIAI3Ne5s3jxYl577bVEdbt3787p06dp0aKFDP2/wGQEQAjx4rixUXcUinZOXb3YO/okP4Md1N8F9qkcss6TR9931izo0gV++gm++UYn+6lVS3cIDh/WQ/8pebB//949aNbs4bRHhw4d6NGjB3UfjDLkzPmwyt9//83AgQPZtGkTJReU5Nta3zL87eEJmr3uO4hf3M3UvwaHrUjAFzE4gkx2mQi9qxMfdTgeQM0i9fjG6SzNmjVj5syZeHl5Wazbpk2bBFsOxYtJRgCEEC8GpcAmE9hmSl29exd0Zr+sZaD2CuuCf0yM5RGJzp315/b2MGIE9O8PgYGwa5cO/o9OATw4xOdREyfqfydN0lv9li8nLi4OpRRDhgyhUqVKiar8+++/9O3bFx8fH0qXLs3hroeZ4TeDFv+00Nv9lBmTX18+dryF1xXrgj/ApH2TsIkOxufKAbzOXMFg58TYN8bSsGFDRo0aRbNmzRLV+f7771myZAleXl6S3/8lIB0AIcTz78xkODcNPLz0iX7WurkdfGpAyS/1gj8bKwc9M2WCr75KMP+ewN69erHf//4H58/Hf24yxS9kjIxMWKdoUT19EBYGX3wBq1YBMGjQIP766y9KlCiBnV3C51u8eDG9evVi/fr1lC1blin7p7A1YCs3wm+w9MxSdvhvZOUfWfE/O48aVyAgidS+DzjZOQHQ761+tCrVmCif2nRe+glFC3hjG2NLgwYN6Nq1K50sLKhUSvFGwzf4YP8Hyd9EvDBkCkAI8fyKiwQUFPwAbBxSLJ6A/59wqD9U/wvy1Etd3dBQfRCPra3lkYD7h/OwZInuCDzaUXg0KdADxYvrRYTZsoGzMyiF0WjEGBnJ4MGDcXZOvI5h2bJl9OjRg3Xr1vH6668TFhPGuVvnMJqNFM1elEymGHL5duSOGV4/G54owY8lV766wgzf39ixbwiF6v1ITMODzCu2jkaFG1F/Qn2qeFdhwIABieotXLiQw4cP8/W3XzPgbuLr4sUk2wCFEM+v4yPBPiuU/ML6OsoMR4bA5YVQexVkTSZlb0yM3up38qQ+wKdWLb26v0ABvQivTx+dEvjBQrfFi+H2bf3mnxwXFz0CYDbrpEA1a8LmzQmKTJs2jcDAQEaMGJGo+qpVq+jcuTNr1qyhcuXKgE7t2+fNPvzU4CfyjTSwNh9si9IJfsyAvY09RrPR4uNkdcxKDqccXOh1AeIiOL32HZzfmkP+HCUxmUy0aNECV1dX5s6dmyjLn8lkIqXbBX4AACAASURBVCYmhtDQUPLnz5/89xbPBdkGKIR4cd05puf7ywwEg5Vb6wDiImDPpxB9E+rvg0w5ky9vZwcBAXpOH3SO/9u3dQcgKgrmz9cdgL17dbKf3r31yvwHihbVWwUfFx6uOwFOTrp+8eJ65X9MDHH58nHjxg0+69yZuHPnElVdu3YtnTp1YtWqVQ+DP0DMkBgcRzlSI2s2dheAFeb8fBl89eH1pDoAXgW92Hl5JzGxd+HwQCj3HaX99oFfaea+P5etE7cSGxvL7NmzEwX/Y8eO0b9/f9atW0dmS2saxAtNOgBCiOfPLV9wdEvdSX6R12F7MzDlgfobwN4p5TqPD/EHB8f/XLDg/9k777Coji4Ov5cmiCB2sYu9FzDGFiu2qDFqYo9dY/k0GnuJqLHHEnvvvcTeRbGgUcTeEEQERFCRXhZ2d74/xgVWUMGYRM19n2ef3b135t7Zm8iZOXPO74Crq9Tvr5EiZbB2bThwQMYJxMbKsr3BwcbXLVVKpjZGR0PTpvJYjRrg4cG5EydYv3496xo2xPSHH4zuf/z4cbp168b+/fup6mQcEGhhZsGllrNwejSbrqGwJSoQrwFelFpSSv58bSymiik6Yaxe6B/hz77v95LfNh/E3wQTMyn1i4w/uH37Nq6urqkkfjUaDeXLl2dtWhUOVT4L1CBAFRWVjwff9fDkIBTrAQW+SX+/sBtw/Eso2AZaHISLHhm/d3BwsuiPq6vcDmjYEGbMkOcNUe9//infu3SRGQDm5km5+gA0ayZ1AcqVkwF/r9C7u+N56RL169dnzZo10LWrkfF3dXWlS5cu7Nmzh23h2zCf8loxo8c7qOwzjVmiEoUqjgZIMv4GUhp/KzMrCtoUJCTSn6JXu+OYq4RMn3xVJGn+/Pns3bs3TYnfyMhInJyciI+Px97ePsOPUuXTQJ0AqKio/PvodXLv3q482KajzG5KnhyGU85Q5TcoN1Ya1a++SrvtkiVvztW3sYF69WRQn04n0/iEgAkT5PkqVSB//mQvwapV8j0gQKoBGjhyRHoPYmKMRIEePXrErFmzEEKkcrXvPLSTjh07smvXLmrVqsXMRjN5NvwZ/hH+KJMUpizPztOznfnyYSRj7pxkhvuMdz6WOG0cG1v8jkaAfYP9YGGXdG7z5s3MnTuXY8eOkTOn8TZJZGQktra2nDt3DiurdHhRVD5Z1AmAiorKv88tF3i4BrI7gk2x9PfzWgSXe8v8/sLfv7v9wIFw547xMV9fqcpnbS2Nd48e0KSJPLdmjTT6Dx7AvHnw5Enqa06fnvzZ1FQG/nl5JeX8CyE4ePAgDg4ObN++PZVy3rlz5/j+++8ZPHswX72auGQyy0Tu33JTZH5hdhYrSO+sUN1fy7WEN6QlvsLWIlnj4FjHA9Tx/oXAgTfJaZ+cOnnkyBGGDRvGkSNHKFSokFF/IQTNmjXDx8cHOzs7VD5v1AmAiorKv0fcU0iIgNJDpa5/etHr4MoQ8F4Czu6Q88v09RMCvvhCfj58WEb8nz8PI0fKYkSWljBoEAQGws6dUvgHZF2ALVvSvuaYMbIkMMjUQRMTGSxYQsYvxMTEsHv3bmJf1wUALly4QNu2bTmx7wTju40HIM9veQiODsZCga15IbcmgLLeYQRoQeHNsrvdK3Ynb5a8AHi0mk2TrS3pl1iF/DkrIISgw64OHD91nB9++IG9e/dSrly55HEEXKDinIro9XpOnjxJ8eLF0/c8VT5p1AmAiorKv4f3Ugg6IgP+TNOZ558YDWdbQ8QdaHwBshRNXz+NBlIGtB08CMuXQ4sW8rtOJ/f3HR1lJb+OHeVxg7pf9TeUG65XT245hIfD8OFyQjF7NpQuzcaNGwFYu3Ztqlz/S5cu0bp1azZu3EijRo2Sjj+PeU7XbS04kd8EE6BVSCbK5a8FkFSxLy3W3VxHn6p9EBMScIq5wsshD1jYYkXS+e0nttOpfSe2bNlCjRrGdRAUFF4eesmBAwdUt/9/CHUCoKKi8s8TdATC70CFSVCkQ/r7xT6Bk1/JWvX1jxjta7+Te/eMSwYvWSJX7nnyyO+lSslIfUOw36FDULSonBiA3BowULiwfLezkwI/Qsi6AGZmUOuVsRYCb29vYtKIOfDw8KBly5asW7eOJobthlfs+noeO7IF80CfmfGa4mxsuxP3APc0V/8xY5Ov7Vy0PgMyv6ToXHvGahzIZlcCSzMpm/zgwQPy7s/LiuUrcHY2FkWKioqihFUJ/I770bp163c+RpXPB3UCoKKi8s+TGAnaqGSBnfQQdl1G+hduD1+sTIpmTzeVK6et6peQIMWADIF8Go1040PyO0Biihz7x49laeC5c9O81dq1a3nw4AGTJ08mj2GC8YqrV6/SokULVq9eTfPmzY07ht+i2p2fuGXtRIcfnvIgzIdW26Qmf1qr/1yzcgEw23k2j8L9+fXPJTyLDSWlwJu/vz+NGzdm+vTptGnTJtU1du7cydKlS1PJEKt8/qj/xVVUVP457kyDrOWlEc8ITw7Cnz2h2hIo1C5jfR8+lII8+fIZH/f2hv374eefZeW9+/eTzxmkfdMS+TFw6pTsl9Iz8ApLS8tUefUAN27coHnz5ixbtoyWLVsanww5TeLZtuSvu5lC6zvDpbTLCmcyzYRGp6GJQxOO+R7jmxItKHNnBDGRcCB7efZ12UUjB7mlEBISgrOzM8OGDaN79+5G10lMTMTb25uePXvyuSvCqqSNKgWsoqLy96ONkcp+UQ/AKi9YZHt3HwNeC+DuDKizB3K+YR/+bZiYyH36lFK8L15ArlzJ32/dAltb6do3eCVS/m3Mlk2K+iQmyn558shyvr6+0oMQEwPW1mz/+Wcsw8P5ZvNmoyEokxQaZG7A3bl3sWhhwaV5l5IC9oQQ3PYYT6nHS2n8KIwzcen/aWJsJMo0WypZgL+JHdvb7cC5mHTxh4eHU69ePVq3bk187Xi+K/sdjvmSlQWvXLnC1DlTGTh1YNKEQeXzIL1SwOoWgIqKyt/PtVEQsEvq8qfX+Ot1cGUw+CwH5wvvZ/xBruZf0+HHxgZSlrutUAF27ICyZaXhf31hFBYmDb+lpdQBcHGR2wAmJtCmjfQEWFlRctMmivv5yXTDFOyut5s7c+8wb948/Av4s+32NgC8XzxgxAIT7O5Pw9EnbeNvZWqFmWLsrG1WvBlNizUG1/oUMINiDm3wGfwwyfjHxsbSokUL6tWrx8SJE9l4cyP3XtwD5ITj3LlzODk5UaBrAZpvbp7qnir/DVQPgIqKyt9H+G2wsgdTK/lK755/YhS4dwR9AtTeCRZZP/zYnj5NvS3Qo4dxpgDIvf7gYFn5r3RpOHYMnJ2NfsupU6c4f+YMv0yYABcuQN26SZMILy8vGjRowKxZswgqEoSdpR1ty7bFzsKGhcss6Jg7D188eMFjrY7MZpmJ1cbimNcRz2BPo2EUsi2Ef6Q/e9vvxePmIqbdO4l+XAwPIgIplLVQUsBfQkICrVq1wt7entWrV6cSHXrx4gX9+/dny5YtmJtnMI5C5ZMgvR4AdQKgoqLy93FrsszRt2+c/j5xT8Hta8juBNUWZzzYLz1ER0svgKGUb44cxmp+KcmVK1n9b8gQuHZNZg+k+NsZFhaGn58fVapUAaTL3+d/PijhCnXr1mXKlCl0794dZZLC8hbL6VOpK8rFriTGBZP7kjt5spXCK9QrXUMXv+iIc/uGi7nakjV7BZxWOiVp++t0Ojp27IhWq2XHjh2pAvsOHz6Ms7Ozavg/c9QtABUVlX+Pxzvg5TWo8EvGjH/EfTheEwq2hS+Wfzjj7+2dvGJ/8AD27pWfDcF+KY2/pVxJY5DINRh/T08Z9X/2rCwTDNy7d4+2bdtiZ2eXZPwBnB2ceRn8koYNG2LdwJrOXTsDICYKRh/uR9TRmqCYUc07lHA9JGgT0vUzhtgBiZFY1T+A23NfnFY60bdqX3ltIejXrx9hYWFs3bo1lfHX6/Xs27eP0DdNdFT+c6gTABUVlQ+PqRWYZDDJ6Lk7uNaDChOh/LiMpQi+i7x5pVt+xgyZ779unXTn50yjXHDDhlIt8MULWfkPYOFCqFpVegyEgDlz0Ol0lCpVismTJ6eS913faD2dvunEgEED8HLwSkrhiw+7w6My9ix/fJ2vH0dw48V9mjg0ISwu7I1DL5uzLM2KNQOgU4XOoNcihKBLxS70qtyLqQ2nIoRgxIgR3Llzhz179pDJoGXwisOHD/Ps2TOWL19O3rx53/85qnxWqFsAKioqH47bU8G2VMZT9QL2wOV+UGMj5Gvy7vZvvVaALMaj1ydPIgYPlkY/Ksq4bffu8vjbKFMGOnWS1f+KFgW9nvCICBo2bIi7uzuWBo/BK54/f069evXo1KkT48aNSzounp0n+GgdXEJhny4PITEhmJuYk6hPfP2OqdhtrzD8ueCRFjpV6MSWW1uS3P4AU6dOZfv27bi5uZE9e/ZU/efOnYuzszMVKlR4571UPn3ULQAVFZV/Dl086LVQuAPkzWBK2YPFcGUQ1D/6140/SEU+kEF+Bjp2lMbf3Nw48C8t4z90qHz/4w+52r97F8aPl0WBBgwg7uhR7Ozs2L9/fyrjHxYWRuPGjfn222+NjD9+W0h0a0n3EBDF+zCq1igUlHca/6s/nKJ0ztL8+lLgp5XHgiKDKGBTIKnN4sWLWbt2LcePH09l/M+fP8/58+cZNmyYavxVUqEKAamoqPx1bk2CLMWgeO/09xF6uDFWrv6dz6df0/9d2Noap/HFx0PBgrLIz6JFMuc/R47U/bp1g/XrYeZMOHMmOU2wfXuYMgVKlkTv6UmdbdvYc/06BQsWNOoeGRlJ06ZNqV+/PlOmTOFS4CVWeq5gWdEChN+ZQz2/GO4kAFdXvnHopoopOqEjW6ZshGnCSDjdgLhwuG8w/sOCsLexT2q/adMmZsyYwblz59J07cfFZUBUQOU/x0c3AVAUxQXoA7yKvGGsEOLwq3NjgF6ADhgshDj2rwxSReVTY8MG+PrrtA3fXyHmsRT4KT8BTC3f3d6ALgEu9YRoX1nNzzKNvfgPRfHisoxv1ary++vPQFHkhOHWLSnoY1DwM6TPnT4NgYGE5shB9osXORUVha2trdElYmJi+Prrr3F0dGTOnDkoisLTCD9ahu1GsXCg/MMYQnTJ7c0wQ4s21VB1QjaqahJGn28388OpMRTN78DtTgeI0kQZGf/9+/czYsQIXF1dKVKkiNF1vLy8cHNzo1+/fhl/Xir/GT7WLYB5QojKr14G418W6ACUA5oCSxRFMf03B6mi8snQrVtqMZwPgf9OCDkFZplBSeefk8RIcGsu1QEbnHy78V+2TO69vw8vX0LNmmAwglevymp/AAMGJLcTApyc5Pm1a8HLyzh+4NkzaNCA/v37c/bs2VTGPy4ujm+++YbixYuzaNEiGRCoCaX10yV849AAU+fztKwoPSNZ09AzaFlSSgJ3rdgVU8WUwrYF6WQDw/Z3pkC24rg9diOLRRYj43/69Gl69+7NgQMHKFu2bKprWlpaki1bBtQWVf6TfHQegLfwDbBNCKEBHimK4gN8AVz8d4elovIJkNFg32nToFkzSJHaZkTwSTDLAmWGZ+y6sUHg1gxy1QbHBWDyjjl81qwyXz8twsPlij1/fuPjQkjjHRcHFy/KV5cusuxvy5ZSA8DKSlYDNHD9uiz7W7QolCxpdLnnz59jaWnJpk2bUun7JyQk0K5dO57qn3Jw+UEpuhPpDWe+hgLfQOWZCBRWXVsFQERCBIDR6v/AgwMAnH7kyvQcOg6Z2jI9sTjXhroDsPHGRqN7Xr58mfbt27Njxw6cnIzjvJ4/f87MmTOZNWsWhQ0VC1VU3sDH6gEYpCjKTUVR1iiKYpjG5gcCUrQJfHUsFYqi9FUU5YqiKFeeG3J4VVRU0s+cOTLv/U3otZCO6HUjIu7CiZpQuCM4LXqz8S9USGrsgwzeW7o07XadOkGB5GA4YmNl4J+JiZwAHDgA/fvLc5s2QefOMqf//Hlp7AEmTpTv3bvLsr8rV6ZKP1y5ciXbtm1LZfy1Wi0dO3ZEp+i4W/suv1/+nciAQ3CyjpwYVZlNnwP9MJks/8we73I81U9wspcGXAECo4K4Gg8ne17E+3/e5LbOTW7r3Pxc8+ek9nfu3KFVq1asWbOGevXqpbqejY0N1apVS6X+p6KSFv/K/yWKopxUFOV2Gq9vgKVAMaAy8BSYY+iWxqXSXNYIIVYIIZyEEE65Uhb8UFFRSR+hodA7jYA+n5XwcC3kawq566T/es/OgWt9qDgFyo1+e45/9uzSGL+LPXvkKn/7dqnjb20tI/xtbSFzZmn8d+wAgyCO4ZpNmyZfw7D/v3IlzJsnC/ssWwbIoD5vb2/GjBlD79eehU6no1u3bsTGxtLBpQOYwq3LozF1/x5qbIDifdlzb0/Syj9flnw03tSYMbXHANClnNzWuPL0CibA+QJQNWte5vV7ivl0W/oe6Jvq5/r6+tK0aVPmzp1LixYtjM4lJibSs2dPYmJiaN8+g5UWVf6zfNQ6AIqiFAEOCiHKvwoARAgx/dW5Y4CLEOKtWwCqDoCKygdArwOhg7gnYJIJMud7dx8D/rvAYwDU3Az2zh9uTPb2cn++cWNp9HfsgNy55bF3MWaM3ArYuFFOdkxMYOdOcHeH+fMBODJgAOcyZ2bab78ZddXr9fTt2xdfX18OHTqElaUl3JqE8F1HhxfWeMTE4TvEF2WSgoKSJAIEYKKY4JTPictPLgNQ2Ay+rzaCpvZlaVChOwDVVlbjatBVzE3NiR8fD8DTp0+pXbs2w4cPp7/Bq/Eahw4dolmzZurqX+XT1QFQFMU+xddvgduvPu8HOiiKkklRlKJACeDyPz0+FZX/JPfngtd8maqXEeN//3fw/AkaHM+Y8TdI975tgRIYKFP8jh6V5XlBbgO8jrk5NH+t4t20abBggYwjOHRIHmvXDubNQ6PRcPr0aZotXcq0tm2Nugkh+Omnn7h37x779+/HysIELnYl2Hst9rcfs+PJXarmrYoySeF45+NGxn/Tt5vQC32S8TcFduQzZ8Pl2TT8owfNNkm1v21tt2FmYoZGpwEgNDQUZ2dnevfunabxHzBgAFevXuXrr79Wjb9KhvgYgwBnKYpSGene9wP6AQgh7iiKsgO4C2iBgUKIdPgJVVRU3htNKOg0UHIQZCTpRujh+ih4chAau4N1BgPSChSQK/HXtwqKFJGu/jt3pFDPoEHyuEGQJzo6ucCPgcREOHxYThImT4b69eV1R40ynmBkyQIODvj/8Qe7du2inl6fSuJ3zNgxuLu74+rqShazODjVDCzzkKPFTW40iWe062jOPz7PyJojabzZuAZClz3S7W+mmHKpQX/OUJBNEQHsa9SF9rvbc/ThUUafHM2MRjPQTJDGPyoqiubNm9O8eXNGjx5t/IiFQFEUevXqRbly5TL2fFVU+AgnAEKIrm85NxWY+g8OR0Xl08fXF4oVy3gmAEDAbqnyV2pw+vvoNPBnd4gNkDn+mVJL06aJIXofZJT+kCGp2zx+DL/+Cv7+Mor/2TOoXFlW7DOQ0vhnywZhYfJ6L15A377yupUrw4gRxsO+d48tBw7QpXhxFi9enOrWU6dOZebqmXSf3x07JQiOt4TCHQh2GIj9DDucHZw54XsCAEd7xzf+TL3QcdVrG5ODXhCuhyE1fqK/U38ehT+iYp6KPI95Ti7rXPi98KPoF0XpXr87M2fOTDUZmTx5MsWLF6dz587veLAqKmmj+otUVD53smSB1q0z1uflVXh2For3TZ/xL1lSRtQnhMPppqBPgPon0m/8Qa7cUwbopYUQ0pBXrAgeHvLY9evw2uqYnj0hUyZp/C0sZGaBIQiwVSupA/CaIFBstmxce/iQhITUlfnmz5/PunXruOZ+jWV12sDJejwp3BsqTSWXdR5+rf9rkvEHaL87dSCeGfBH/kzYmUCfwBesarsLgCeRTxjtOppGDo3o/EdnNt/aTEJCAj/+8CNkhhXLVhgZfyEEOp2O3r1707Jly7c/LxWVt6BOAFRUPndy55YR8xkhIRw0L9PffsgQaPoFnKgDdhWg1g4ws8rYPR88kIqFKQkKkl4BvV4G7CmKzBKIiJAaAAavQcpVP8CaNaDRvPotCTJW4MYN+b1hQ+jTJ6mpEIKFCxei1+uZO3duqkp6K1euZP78+bi6ulJZXCCTRx9eOK6gwN6xFJxXkJDoEEbWGskvX/2S6if99MVPAFgqct/ysD4/YXpoX649dQrX4XS30/x+6XcASmQvgZgoGOQ0iC5dupDJPBMJ1xIwNzcuiTxm3hgGDR1E/vz5U4kSvS+xibHEJqYRP6HyWfPRbQGoqKj8iwTsgdgnUGpQxvp1rgt7a4KrKWz4/f1K+ZYokfqYvb3c63/0CH74AVavhl69ks9XrWq8tWFuLvf83d2hcGFp+OvUkVsHFSumeVshBPHx8aTMiDLsr2/atIlJkybhdvokuYOmwouz4OzO+Se3AAiMDKTskrJo9VpiEmOoU6gO5/zPJV1n/uX57Px2M6U8O1M3EFY99eVs97N8te4rviv7HW3LtmXd9XWsaLGCyssrc7f/Xeq0rkNoSChxd+JSGf+4uDhmhs3EpalLxp/vW8g1OxdmJmZEjI74oNdV+bhRJwAqKirSiAot5KgGtmUy1jfEDdzbQ9Ex0CDv+xn/N6EocPu2nBx06JBs/Nu0kRODa9eM25YoIav3DRsGly5BSIgsD/wGUaMFCxbQsGFDRrwWD2Ay2YSR2Ucya8wsbp13J7/fAM76nabRD6Hs8jmJxxOPpLYRmgjK5yzP7Re3k4y/Q1YHfCN8aZOrAN/t6UwhKztqFqvFYe/DHPCSyn+5zGXcwrrW6wDoXbU3AwcOJFNkJuhAqkqDV69eZcyYMYhjHz51O2ZszAe/psrHjzoBUFFRAd91EOUFlWdkrN/j7XDlf1BrG+RtAHU/8LiyZoXISKnRX7Om9ASUKyeNf0oMwX5378rvTk5QpoyM/A8LSyXva6Bw4cKpSuiGRIcw3n48y8cvp9r/cuLg1wWr/E1p0P0welMzdt/dzaOXj5La963alxVXVxhdwzfCl1HZYIDNM1xDoYZDE8xNzBEImhZvypw/51B3S/LD0v+iZ+TIkXh4eHDvwj0j175nkCfEgWNVR3bu3Pk+T1FFJU0+aiGgD4EqBKTyn2XNGrliftu/cW0sJLyETLlk4J75G3T30+LeXPCaB3UPQba03esZwlCAp18/mDVLRu5bplFh0NZWTgpSUqGC3Ov38pJZAqNHSwXAa9fk1sGtW0bPYf369VhbW9OuXTujyyiTFAqFFcJ/pT83Dywjf/AQ/PJ15LDiwBGfo1wIvMDWtlt5GPqQ8W7jGVljJLMuzjK6RiYFtMKE2lmsiTDLSvPyP1DYrjAdynfANpMtsYmxhMeHU2VZFUrlLMWlwEuM1Y9l9+7duLm5pZqQKKMU7HbYEeIVkkqOWEUlLT5ZISAVFZUPRNOmcs/8bQTuB+/lYJop/cZf6MFzKPiulml+72v8hQCtVu7Pg9Tnr1hRyvL26wcFC8qVPcgVvQGD8a9fX7bz8ZEGvmFDWLdOKgOamsKxY1IO+ObNVJMgJycnKlWqlGpIk4pNImZzDLd3jKVC2ASy19vDTbu6TDozmdWt5LPsuLsj10OuAyQZ/x+r/ph0jfUFstLSWs+Z6ChO97vFtPPT6HewH1lnZCVRl8iAQwPIPzc/ISNCONvjLFOtprJlyxZOnDiRyvg/evQIMVMQ4hXCIs9FXAq89H7PWkUlDdQJgIrK50q+fDIdLi2iHkLwKSjSASpOTv81dQlwoTOEXQXn82Bd6P3H9913MmivSBEZ1f/8OZw7J421s7Ms5xsWJicyBi/e7Nnyd4E07MuXy2wAkJOEkSOlMiDI9D+DQuArTp48ybhx4yhXrhwlXgs6vH79OkuGL+LiMmfKabdAw1Po8jbG1dcVrdASkxDDsC+H0aNSD64+vQpAzsyylPGyq8uomsmULAqElRmHa2IWAOquS3bzD/1yKOam5qxrvQ4xUU5IlixZwpIlS3B1dSXPa2PV6XT88MMPBAUFYWFhwZwLc5JUBFVUPgTqFoCKyn+R5xcg8h4U6/Xutga0sXCuHZiYyz3/jKb5vU5srHzlzJn6nCGQcMoUmDAh+biZmfQaGMiSRU4UataUk4S3/D0TQhAVFYW/vz/ly5c3Oufl5UXTRnU5O9uBgtmBr/YSoNFQaL6c4JTNVZZn0c94EfcCgEq5K3Htx2s4rXBCCMG1kGtMzwHHYk1xi9MlGXgDQ48NZf6f842Or1+/nvHjx3PmzBkcHByM2t++fZuSJUtibm6eSgBIReVdqFsAKioqqQlxg3u/Qa6aGTP+CeFwuglkygl1dv914w+yYl9axh+gaFH5ntL4g7HxBynos2ePNP4hIW+8lZeXF61atcLGxoby5csbpfydvHqSDt9+xeXpmTkbfpGReiewzI29jT1Lmi9hVqNZONo78iLuBcqroqTVC1THZLIJV4OvUiv+Gm3syzAmFNzidEz4agIWUyy49/weFwMuEh4fzoWACyROSC6fvHPnTsaMGcOJEydSGX+AhQsXcu3aNdX4q/ytqFkAKir/FfQ6sC0Nphk03nEh0vjn/goc54PyN60b/vgD2raFCxdktD9I0R9TU7k9ULIktGgBc+cm9ylQANq3h/XrpeBRGuh0OkqWLMmcOXNQFAWdXofZFDOe/vwUJUZhfF9nDgyFXFWmUSBzDRrlKkPTTU1pUqwJV4KusOX2FnpU6gGQVNzn4IODADRxaEJAyDGuPL8HwJpWa6hbpC4eTzywNLOk5pqabG6zmctPLmPy6rkdPHiQQYMGcfz4cUqXLm001rt372JjY8Py5cs/2GNVUXkTqgdAReW/QOABuDIQrPJCzurpHXokFQAAIABJREFU7xfzGE7WgYLfguPvH8b4168vI/Pj42H7dpnWd/Gi9AhUrQo//SRjA+zspHv/+XPZ78ED+Pbb5OtYWcm+OXPKvP80iI6OxsnJidjYWEq+SgU0NTHler/rWGotWfxzNVwHZ6ZAs/1Qbgx1i9Yjl3Uujj08xrw/57Hl9hb6Ve3Hjjs7KJ2jNL989QvPhz8nKDqITXmgmkUCmYt2ZFHbPZgoJthZ2uGQzYEjXY5QNFtRxERBpwqdEBMFCy4t4MjxI7Tu2Jotu7akGYR45swZPDw8Uh1XUfk7UD0AKiqfM3otxIdAvqaQ88uM9Y24K3X9ywzPWDGgd9GjB3TrBqdPw7ZtMtCvZs3U7cLD5buFhUzxA1kACORkoFs3WRnw7FmpGKgocovAVFYt1Gg0ZMmShcOHD2NtbW106RJZinJwSmkG1o8lcysPsCubdM6wUn8a9RSAPff3EKON4X7ofSafnYxZfBAKsN20IgfvnyZqTDQXAy6iF3ruPLvDpDOTuP6jzBI4+OAgdQrVwTaTLUNXDCX7/uzo2umo6lTVaDyPHz/m0aNHaZb7VVH5u1A9ACoqnzPBJ+D2ZBm4Z5nr3e0NhHqAawOoNPXDGn9IXv0HBkLt2nK1v3nzm9snJEgXv6LA1q3S2JcoIbcKAgOhbFmpF1CiRJLxF0Lg7OzM/fv3sbe3N75c1FO8lhclf84oSgdGoKQw/gYUFLRCxhs8i31mdK584DocM8GBoJsUy16cHXd24LzJGYAdd3cQHB2c1Lbl1pYceHAADw8Pch3Mxbat2xBrBdmssiW1idRE4uvny/379zP2HFVU/iLqBEBF5XMk/hkEu0K+ZlBtacb6hpwGt6/hi5VQ9I3Vud9MrVqyBDEkv7+OwXUPsmjPmTNptzO49rt1S47w37Ej+XzbtvK4paX0CgBRrVsjqlRh//79lPb0hIcPk5rrQm/wclsJHkdm53mztSxovQFlkmJktKM0UQgEWcyyYIpp0vFONmBnAm2CtFzRQNGsRfF56cNpv9OMqTWGQlkLcbTLUYKHJ19LTBSU15enZcuWzF86H2dnZ6Of9/z5c7K2y8ovvr/w448/oqLyT6JuAaiofI7EPoGXVyBvw4zt2wfug0t9oPYOyFPv/e4dECDz+h8+hOLFkxX+UnLunCzPW6CA/K4oshywoapf3rxQqZIM+Bs7FqZNk8fLlk17uyAFo83MqNesGd/Z2UGXLjB/PgwZggjYQ6xrJ9ZdceCn3z3peagnL2JfMKrmKHJmzsmYk2M4738eO0s7AKK10WSxyEJ0QjQAVW1zU6dqd/qfmYVugg7TKXJysPXW1iRvwUrPlSiKgn+EP6tareLu3bs0a9aMqXOm0vl2Z1ZFr+JUt1MA6PV6tFotvzv/zuAeH9jLoqKSDtQJgIrK50TYdQg6AuXGQPYqGevrux6uj4b6RyC7Y8bvbdh/9/dPPvZ6Xr5WK93/PXpIpb4//oAXMrfeaAIQHCxX/TodjB8PTZrIoMA3VPQDiI+PR6PRMGfTpuSSvkLwMNSbXFeGo7+9nKF/FGPhlj+xtLQkn00+rj29xgnfE1hbWDPD3bgOgpWZFcWyFmOwcoOZYTD8yTNc6zcBZmE6xZRB1QaxyGMRJXOUxDfcl/0d9tN4U2Mq5amE90tvRpUZRePGjZk9ezZdunRhwdIF5MmSLPbTpk0bJkyYwODBqvFX+ZcQQnzWL0dHR6Gi8p9Arxci/oUQQccy3vfefCH2FBQi/F7a50GIn356+zVe1RQUrq5vbtOkiWxTo4YQZ88m99m7V4j9+4VQFCGyZBGib9/kc4cOpX0trVaef/FCCCHEqlWrxNixY43bJESJncsQl383F/WqlxKhoaFJp4rMLyJKLigpcEEMOzpMXAy4KL7d9q2ovLSy6Lizo8gyCYELIibolLD51VLggrj77K5YfGmxwAWhSdSIkgtLilvBt8T++/vFKs9VQgghNBqNUIYowj6/vVi5cmWqYcfFxQm9Xi8CAgKEXq9/+zNVUXkPgCsiHfZR9QCoqHwOPL8IDxZAra1g3zj9/YSAWxPh8TZwPgfWhdNud/YslCr19mu5u8v9/zp10r6PiYmM2ge4f18W7TFQpAhUrixT+6Ki5LGSJaUeQO3aad/P1BTq10efOTP+fn707NkTnU6XfD76EZz9hkKU54fFMZxyO22ktV/IthClc5XmWewz2pVtR43VNZLONSveFNeC5nR5mkjNvUPRYUImk0wMPz6cvR32ctz3OJmmSi/DqJOjKJurLB5BHvSq2osnT54gNggcuzqyTL+MTomdyGyeOenaY8eOpUqVKnTt+h7xFSoqHxBVClhF5VMnIQzMbCEu8M0GPC2EHjyHwPPzUP8YWKYtpPNOgoKkPn9iIhw4AM2bQ926cP68jPAHGQzYtCl4eyf3q15dVu8zpPv99hv06SOr/RmoXBlu3HirxK+npyfTp09n165dyQeDT8GFTnjENqbRsL18Pa0FW3pvSTodmxhLbGIsOTPnRJmk4GTvxJWn8u/E9tr96HR+ORYKxKW4bV7rvATHBHO933WuBF3hzvM7jKg5Anub5CyDkJAQ6tatS69evfh5+M+YTjYlZmwMmc0zk5CQgEajASBz5syYmiYHGKqofEhUKWAVlf8C4bde6fObZsz46xPh4g8QdgMaur2/8b96FfLnl5+XLoWWLWVA3+XLcsWv1crvxYpJ4z9okGx7/DhcuiQL+ZQrJ48NHy4nEynx9JQTizdw8+ZNHB0d2blzpzwgBHgtggsdcWcALYcfZ+jiYRQvVtyoX8utLck1OxcddnUASDL+APlC3fj1y/5Gxh8gOCYYBYXKyysz5OgQ5v05j8DIwKTzoaGhODs707FjR0aMGIGJYoKYKJJW/xs2bGD69OnY2Nioxl/lo0D1AKiofIoIvQz4y14VdBpZzje9aOPg/PeAHmrvBLPM7+xihF4vjbvReF65+P395cq/c2dZ7W/bNinRW7q0PF6/vvQE1K4NzZpJb8Hdu7Ky35Ej8pxeLycOFhZvHcbLAQNof/s2h06exMLCQj6HKwPhxSWWvmzGgB9n43HGg0pVKmFmYpZKV3/48eHMuTgHE0wQ6PGu2YLqfx4kVJ/cplWpVuz32o+pYkpu69z8Wv9XSuYsyc/HfuZSn+TSvOHh4TRs2BBnZ2emT59udC+dTkdgYCCFChUiMTFRjlVF5W9E9QCoqHzOxPjDnanQri08e5n+fgkR4NYUzG3hq71pG39FSVbce51ffkkS2zHCx0eu6jUa6N1buv6rV5cTgxcvpPHPlEmmCC5eLGMFIiPl1kBK4w/y+pkyJccCpIG7uztZly7lxMSJ0qDGBUvhIs1LruRYyIRhaygzoAxOTk5Y/GpBu53tiNLI60VqIqm7ri577+2Vt0OPAKbeO0P0q/WQpaklAPs67ANgXJ1xPIt5RuvSraldqLaR8Y+KiqJ58+bUqFWDXyb9kmqicfnyZcaMGYOiKKrxV/moUCcAKiqfEto4eLhGuvvr7Ibdf8CTJ+nrG/8MXOtD1vJQc6NUB0yLS5ekWl9ajB6dtrjPihXQuDE8eyZL/CYkyHGlnCxoNNJL8OKFPN6xIxR+tW1hMP4gK/sBHD2a5hD0ej2LFy8myN8fGjaE0Ctw7Auwb8yd7JNo0boD036fxr0s9/AO9SZ0ZCgbWm/AdoYt/hH+xGvjOfv4LA/DH2IOPCyZjRFVe7I2LAqNAO//eROviwdAmaQQMyaGSfUnoRM6Tj46aTSWmJgYWrRoQfny5VmcfTHWM5Ilh4UQeHp6UqNGDTa/TelQReVfQp0AqKh8Sug1EO0L4lW0uxDg9E5Pn/QYnKgD+b4Gp0VvFwf64gvIkiXtc5kzJ5fqXbcORo2Sn2fPlmPJlk26/DNnllkBr/PgAWzYIPP7t26FnTuTgwANODrKa333Xaru58+fJywsjC1btlCwYEF4tBncmoHjfHytu9KkaTPmzp1Ln459GFN7DCUXlSS7VXaszK2Y3nA6hecX5rsd3+Fc1JkalpDFMhtf+EYz++qapHt4vfDCvacce7dK3bCeLo16nUJ1OP7wOBHxEfiF+xEbG0vLli1xcHBg2bJl+Az2wWugV9J1nj59yuTJk9HpdGpZX5WPEnUCoKLyKZAYCZf7g6klVPoVTDKQwRtxXxr/Ej9CpSmpVfnel6goY9GfgACp1GfwAgQHy3sZ7mcnFfaYNw9+/z05sv/evbSvnyULHDpkdMjNzQ0fHx9Z2vjaSLg5ARqe4qlZDRo1qE+bBhXp2LEjJpNNmH5+OmKivIfpZFNsLGwAOOt/lvN+JxiTXSFBE0aw1jjIsMXWFhz1Psr5HudZ3Wo1EaMjAOhTtQ+dKnRi4OGBFP2tKN988w358+dn1apVmJiYUCx7MUrmlBUHjxw5Qt68edm3b58a8Kfy0aJOAFRUPnaEALMskLcRmGQg2A/gpad0+1dwgdJD/9o4vv1W7tVv3gw5ckC/ftKQN20KY8bAiRPG7R8/lmM3ZAmYmMhJwK+/gkH9rmfPZKlgrda4f+/eSd6GGzdu4Onpyfjx46lepSScaSF/W1MPQnX5cHZ2pl3RfCzYeARFUejv1J/AoYFExEfw5SpZBfGM3xlsTeBo2fLoMaFVkCDm1RzkTDfjWgR/PvmTgYcHYmpiim0mmZbYtVJXGhRtwNImS2E73Iq+xbp161IZeI1Gw/bt24mMjPxrzzsNPvegbZV/FnUCoKLyMaONgxO1QRsNhdpmbPUecgZON4NqS6BYj78+lrg4aaSzZ4eXL6UbP08eKek7Ywb06iXPx8XJ9tleVbwLfJUqZ2oq3f2GIkAgSwLXqgXTp4PZa16N+fOlRwEIqF6dR4cOSW/GsepgUxLqHyUqwYLmzZvTpGkTnBYOTfIqLPl6CQXmFWDI0SFceiID9vbe20m0HuKzlGJCPRe0E7SYvPoT+DJOBlL6DPKhTqE6HOtyLKmkb0o0Gg3t2rUDC7hz4k4q4799+3bi4uJYt24ddgaPxwfEZLIJP+x5Q3yGikoGUZUAVVQ+VhIjZbT+l+vke0YIOiLz/GttkwWB3sWyZdKAm78hMBCMg/KEkJr+Bjp2hGrVoEyZ5Mp+YWHJ52fMkF6DHj2MAwPv3ZMeACurNG8ZEBDA2bNn6dyxI8I5J3FHv8DScR5K8V7Ex8fTunVrKlWqRGKDRNrvbs/35b+n0LxC6F7FSMxqNItjPscgPphD+U2oGWhC68u7gd2MP/0LICP+O/3RCYBLQZc453+OuRfn8nPNn43GkpCQwPfff4+1lTUJ1xMwT+NZPXjwgBo1avwtxh/g7oC7RvUEVFT+Cun2ACiKUlhRlEavPlspimLz9w1LReU/jl4r9+3jn4FtiYz1DTwAF7tB3QPpM/5CQP/+ySv1dxEQIIV+oqKS3fZ//gkFC8r9/zp1oEIFafS1Wpg6Fbp2lSp/ISGy/apVsiJgpkxvNP4gV9wx0dEwvCQ8/ZWGflHEFGqPVqulQ4cO5MqVi0WLFzGy9kgAjvoc5XDnw7h85QJAux3fkl8bTLAO2oZYodFrqZq3KgDLvl7GxK8mggJxWum1qJSnEuPqjMPzqafROBITE+nYsSMA27ZtS2X8t2/fzs2bN5kwYQKFChVK33N8D8rkKkN2q+zvbqiikg7SNQFQFKUPsAtY/upQAWDv3zUoFZX/NGE3QDGFxn9mXKEvYA9c7g11D0LOL9PXx7CtcObM29sZKFRI5vjnzp3stv/5Z2nkIyKkul+pUjJl0MwMxo2D69flRCNfPtl++nRwc3vjLSIiIpgyYQJFv2tJ37KnIOAPlKaXuTBKkNksMz179iQhIYENGzbQ/3B/Cs4rSMXcFVl3fR3lc5dn2IlhAPQo0YhRr3Yi/DQx/Fr/V24/uw2AiYkJk85O4s6AO5TNWRYTxYQVniuokrcKW9omywaPPzme7zt+j0ajYceOHVhYWKBMUqi9OrlGgZmZWZoeARWVj5n0bgEMBL4ALgEIIbwVRXlP7VAVFZU3IvQyst1pYcakfQH8d8KV/0Hdw5DTCe7cSdpDf/d9MxBcJoQ09PfuydW+Vpss8WtqKqP/Dbr8vXrJYMFq1Yyv8fDhW29hZmZGTmstJu3vg1l1aHQWzKwYcXwE51ecxyzEjDw/5qHggoKEDA8hVhvLttvbuNH/Bp5BnhS3MKN33nxMvLKWZzGZAA3tyrSje+XujD89HoC+B/oyutZoSiwsgZliRuvSrbny9Aq5rZP/tGm1WqYOncqXOb/k9JHTaPQaai6vCYB7oDsbNmzA3Nw8yTugovIpkd4JgEYIkWDIZVUUxQxQw1FVVD4kj7dDvuZQd3/G+/pthavDZFGfbJWkhn7p0u/uV6EC3L795glA9+5QooQM6CtaFMaOlSv6du1knn7WrNLIz5ol2+t0UKWKvGZionT1790LNjbpGo9Wq2XUqFGM61aB/iVWQaXlUKwPsdo4IqOD2bpsK5Gekfjf8CdYG8yTSCmCtKDpAkbUHEGXP7pQLGsRfGPDcVfCCUghJmiqmFJqUSk6VejExYCLPAp/ROlcpdELPQkigbG1x+KYzzGpvU6n47vO30Es/FnrTxptaYR7gNQHqFegHm6BblSrVo3o6Oh3P2cVlY+Q9E4AziiKMhawUhTFGRgAHPj7hqWi8h9DCIi8DzlrgHkGw2sebYLrI6HBCbArL49VrZq+vj4+0KLFm8+vXy9X9dmzS4Gg69dlbv7Jk8kxA2PHJk8ARo6Un0NCkrMBvv1WSghHRYGfH/zxxxtvZ6oIHHN4YeO9C+odhhzSc9B9b3d2btpJ1stZGbV6FHZ2dngFepEjcw7c/NyYc2EOB70PUsMSWttBHYev2epziPpF6nPa7zTFshXj0pNLNC3elMn1JlMse7Gke3bf2x0LEwsKZi2YdEyv19OrVy9CQ0JpM7kNy79djqliyppraxh+Yjienp6Msh1FmTJlUv2GmyE3qZinYvqev4rKv0i6igEpimIC9AIaAwpwDFglPoGkVLUYkMpHz63JUOh7yJqOFfvrPFwLN8dDg5OQNbUxeie1aslVehqGDCFgxAiYM0eu9ocOhQEDZJ2AmjVlVH9EROr8fYCSJaXqX8o/Ebt2SXngIUPSHMrYEYP5vtgFKpfMATU3g2VyuuC+ffvo378/Z86coUQJGRRZelFpCtgWILN5Zk54H6BSZlsux0TiZFcIj/BkgSILUwsSdAlMazAN3zBf+lfrj4liQuGshWmwoQHeod68HPUSC1Op06/X6+nbty/e3t4cPnwYa2tro3GGRIcgogUBAQFUe21rwz/Cn8LzC6P7RYfJ29QWVVT+RtJbDCi9HoBvgA1CiJV/bVgqKipJCCED8LI7gtV7pHb5rITbk6HhKbAtlf5+8fEyUC9HDqnLn1KwxiDKoyhyfHPmSPGf+Hhp9Lt2le8AoaHJ/bJkkYGBrq4ySNCw+k9Ju3ZvHtNzd5pk3UqxSj2h+jRZ3vgV586do03nNszZMIeIzBHcf36f0rlKc6XvFWISYsg7Jy+rv+hChO8mbmqs8Aj3x1wxxym/ExcDL2JhIicAo2uPxuF3B4KjgznofRCAoGFBaHSaJOPvE+rD2GFjCXoYxNGjR1MZfx8fH4YMGcLBgwfJmzdvqp9RKGuhJPVBFZWPHiHEO1/AWuAxsBH4GjBLT7+P4eXo6ChUVD5KLvcX4qnr+/V9sESIPYWEiPTOeN9mzYSAtM+BEOXKCRETI0RcnDw2eLAQ2bPLcyCEj48QDRokf3/9JYTsGxZmfO2xY4WYOVOIChWSj+n1YuH4tmLTEFshAg+mGs6NGzdE7ty5RfmfywvPJ54CF0TOmTmFEELUW1tPVJuOOHOqlwiKDBK4IGacmyGK/V5MPHr5SOCCsJ5qLRZeWigGHhoocCHFbfUiPC5cPI95bnSsQMMCwrSgqYiMjBQBEQFGY0lISBB6vV7cu3cvnQ9aReXfAbgi0mEf0+WjEkL0AIoDO4FOwENFUVb9LTMSFZXPHW2MjPYv/TPkqv3u9q/jtRDuzoRGp8GmeMb7Hz5s7Jr390/+vnQp7NsH1tayUt/27bBgAUycCJayRC4lS8q9fIBJk5Ir+u3enXwdS8tk7X8DW7fKLQND8aLEaHDvyNcOd6k34Ajk/9qo+aNHj2jevDlTZk3hts1tDvsc5niX4/j95EdYXBhnHrsRpocZV1Yz/Phwln69lNGuo3kY9pBp56fRoVwHbDPZ8r8j/2Nag2l0qdCF8Phw9ELP7nu7abSxEblm5wLkQmjo0KHYR9oTeisUy8yWFJxXkNBY6eWIiIjAycmJ+Ph4SqcnuFJF5VMgPbMEwwswB1oCfwDPM9L333qpHgCVj47LA4Tw2/5+fe/OEWKfgxDRfh9uPCDEH38IMWuW8Up+8mT53qtX8rEsWeR7ixZCODnJz5kzy+tcvCjE7NlC6HRCaDRvv2f4PXFsciHxU/uyQiTGpjodEhIiihUvJmbOnSmEECLfnHwCF8SCPxcIIYSYs6mCmLIQMfjwYJFndh5RcG5B4RfmJ0xdTAUuCJNJJqLo/KICF0TBuQXlz3RB3Ay+KZ5EPhG4IHR6nRBCrvyHDRsmHB0dRdjrXgshko49e/bsvR6viso/Den0AKTX8DcF1iG3AdYDzflEtgHUCYDKR0NMoBCal0Ikxgih12e8/50ZQuwrLkS0/4cfmxDS7e/mJt30NWokG30LC/n+zTdCfPmlSOXy79ZN9l+4UIgCBYSoXl28cYtBCCEe7xS6HTlE7K3Fwts79RZGZGSkcHR0FFYNrUS2GdmEEELcCrklZp6bKUT8CyFinghtfLjQxIaIPff2CFwQq6+uFltubhG4II77HBe4YPTSv/a8V19dnXR85MiRonLlyuLu47ti261tRu20Wq2oWrWqCAwM/EuPVkXln+RDTwC2Aa2BTOlp/zG91AmAykfDrSlC+G56z76/CnGglJxEfGi0WiEGDRJi2jT5PaVxHzxYvp8/L8SZM0KULSvEmjVyMgBC2NkJ4ecnxJMnQri+imeIjRUiMjL1fXSJQnj+LB4uyy/q1XJMZZSFECI+Pl40atRI9O3bN+n84/DHIuesnAIXxOJN5YTnmd5J7VMa+WFHhwnLKZYCF4TXcy9hMdlC4IKYfnZ6qvuExoaKPXf3iHHjxomKFSuKFy9eiJWeK43iBPz8/IROpxNxhlgIFZVPhA86AfiUX+oEQOVf5+V1+XqfVb9eL8RNFyEOlBEiNujDjuvsWSEmTBDi+vVkg29jI933S5YIUaKEEAEBQuzcKc/lyCHEqFGy76ZN8li7dkIkJgrh4iK/W1kJcexY6nst/FWIXxSRsK+OEFkQfr6+qZrodDpRsUFFQWmEVquVQ/Q7K3BBTNtaXXw1Uxr6MSfHCFwQB70OCtvptqL6iuoi7295RaIuUdhMsxEO8x3E9pvbBS6IEw9PCI02eTsiPC48yfXv4uIiypUr90bX/nfffScuXbr0Fx+yiso/T3onAG/VAVAU5bwQoraiKFEYK/8pMnxAZLBE2T+PqgOg8q/jvxsUEyj4bcb6CSFlgQP3yTz/90kVNODoCI8eyTK+BlaulBr+USnk8nLkME7vA5n7r9FIzYDNm6FAARkYmDWrPJ+QkFxFcMAA+N//jHUFnp2HM22Jf16R6stDODN1GnaviQ8JIRg8eDDXb1xn1vpZ1Cha49UJPUFRT8kX9wDHtQ24q7XEKZ8T35X9jiHHjPUEqtlXw+OpB53Ld2bz7c1Uy1eNyfUm07RE06Q2yiSFHx1/xOScCaf2n8LNzY08eYyfq5eXF7lz58bOzg4lI+WXVVQ+EtKrA/DWLAAhRO1X7zZCCNsUL5tPwfirqPyrPD0BjzZDobbvZ/yvj4YnB2Se/18x/iAj+z085OfoaHBwgObNpWzv7NnyeNmyMko/JVZWMHcurF4tBX9++AFatZJ5/yDFfSwsktsvWZJs/IWA+/PhfFtiqy7DcsAJTp50TTL+14OvJ3WbMGkCh10PE9cujtW3VuMd6k2iLpHTe7/k55UFuClysLrbNXRCR53CdZKM/9jaYwHIYZUDW0tbdn23i7lN5wLgEeRBsy3NCIkOSbqPdoIW+xv2LFm9hANHD6Qy/gA7d+7k3LlzqvFX+exJrxLgRiFE13cd+xhRPQAq/xoR9yAhHHLVyFg/IeDacAg5LeV9M+VIu110dLIhfh2NRqbihYXJlfr338OaNVKTPyBAivXMmiWle0uXhvv34eBBY1ngsmXh7l35efBgWd53/nxZ6a9NGykglCmTLA2s08l6AZUqyfaJUXCpN0T5QJ1dNG7Tj5kzZ1KlShUAHoc/psjvRdD9omPApAEsX7CcKRun8Ou1X8lmlY1M8cE804GtCYTpIeHVn6lMSiY0QmP0U80UM6zNrbEyt+Lp8KcIIXBxc2FS/Ul4vfCiVM5SuPu7U3ttbWZbz2b58uW4ubmRP39+o+t4e3sTExND5cqVM/SfS0XlYyO9HoB07aMDV1/7bgbcTU/ff/ulxgCo/OME7BPi2pj366vXC+ExWIgj1WTGwJuIi5N77uHhb24zfnxy3AEI4e+f3LdRI2EU7Gd4nTghxN69Mp3PcGzTpuS+DRvKLIHXyZdPiE6d5OfwuzJm4c9eIir8uUhMTBSRaQQF+of7C75H2NvbC/6H6LanmxBCiNiEWKH3GCTCHm4XOWbmEL4vfcWlwEtGAX+tt7YW089NF7ln50461mNvD4ELQqvTprpXtRXVRPmu5YWDg4Pw90/OolhxZYXoua+nEEKIffv2iXXr1r35eaqofCKQzhiAt0oBK4oyBjAUATLohSpAArDi/ecnKiqfIUKALg7y1Ae7Cu/RXw9XBsHLa3Llb5H1zW0tLeXe/Zs8AABTphh/37dPVvZr2FCK8eTMCdu2QZEiUtjHxka6/J2dZfnePn1g2jTpaXB0BF9fWQQLAgaCAAAgAElEQVTIwKJF0Lu3HMsTWZUP/53gMQAqz4BivZg2dixFixalT58+qYbnc80H25O2HDxxkDzF85DVMiv95ikci4XHWuhbNYHQuFBabW3F7ee3k/rpf9HzMOwhWSyyEBobym8Xf8Pnfz7ks8mHq68r7gHufFX4K6N7WV+xJvBMIBfPXqRgweSiPxamFkSFRLFt2zY6dOjw5mepovI5kp5ZAjA9Pe0+xpfqAVD5x3hyWAj3ru/XV68T4s/eQhyvJURCxIcdlxByJT9unHy/dEmIYsXkqh2EqFdPCGdnIQpKwRzx8qUQUVHyc6VKxh6CBw+Mr3n7tvysSxDiylAh9hYVItRTaLVaERoaKjQaTVJEf0quXbsmcuXKJVwNqYOvPBXuZwaIoTu/FaNPjE6Vy38j6Iaw/81edP2jq8AFMfH0xKT0PwP9D/Y3EvkRQohZs2aJYsWKGa38U3L//n2xevXq93ywKiofH3zoNEAgG/AF8JXhld6+/+ZLnQCo/O3otEJE+kgjlpBG/vu70OuF+LOPECe+EiIh6sOPz8CWLfKffIMGQixdamzYixaV7+7uQrRtK9snJspjXbtK/f9Fi5LrA6QkNkiI43WEON1ciPhQIYQQ+/fvF717907dVghx5fYVkS9fPrFz587kg2e+FaGBJ4UQQkRrolMZ/9df/fb3S3VdvV4vbgbfNBL+mT59uihevLgICAhI1T4wMFCMGzcuTT0CFZVPmfROANJVC0BRlN7AWWQZ4Emv3l0+tDdCReWT5OUVuOUiK+iZ22SsrxDg+RNE3Ia6h8D8LS799F5v6lRZvW/ECJmW9/338vjLl9CsGYweLV35KbcPihWT73fvSk1/RQEzM1k3YONGeX7gwOR6AAaenYOj1SBvI6h7AP7P3nnH53T9cfz9ZEiCJITESKyatRWl1GitWm0VNTusqp8aNapaJVSU0qrau6pUa5WgtfcWxIoZEkmIRPZ6kjz3+/vjyJNEEh5EaXvfr9d9Pfeee+45517jrO/387VzITg4mPbt2zNnzhwAxu0eh2G8sqgPDQ2lTqM6dOzfkS22W+j9SyMQYX/hDhRa1BxNNPJ/k/kb2BjUTuWBXgfY+d5OAFzzuWZ59Wpzq1F9XnWSxyRjMBjw8vJi6dKl7NmzBw8Pjyz5nZ2dqVatmm7tr/PfxZJRAnAWsAdO37uuBPxmybPP+tBXAHSeGqlJIsF/qfPHFfk5NUrkz9oixgcY8z1qmaBm7DNmiIwdK2ZZXhCpXTvzzL9nT2W8Z2+fnhYUJJLD7N2MKVXknJfI2iIiwX+akwMCAqRhw4ZiMqUvwd9NuCuHbx6W6OhoqVWrlowbN05ERDZf2iRBG2rI0N/bSIUfK8i84/NERCQmKUYWnVgk0w5Ok9d+ek3yTswreCIbLm6QvF55xXaCbbZNCo8Pl1uxt0REZMKECVKxYkUJCckqnhQVFSXvvvuurvCn86+F3FwBAJJEJAnAYDDYichF4BECkOvo/AtJvKX89EXUjPlROTcRgjfDa1sfbPCXHZqWfbrBoNpTuDAMGQL166tof5cuQatW0KED/PyzyvPZZ/DLL7BypTIMBGUc+OqrytXv0qWs5YtAAQP81RRC/oI3TkBxJbTj7+9PyZIl2bt3L1ZW6r+WU7dO4WDjgK1mi3NNZ87ZnmNPqV2sXlOP8s7FcW9/ina1h5GipTDnxBxSTal47fei76a+jNg+guCYYBJSE2hVthUejh4UyVeE8oXKs/DkwixNK5S3EEXzF2X8+PGsXLmShWsXUrRo0fuaLzg5OdG/f3/s71/N0NH5r2HJKAFYDxRALfvvAzYAWyx59lkf+gqATq6TkiDiN10Z7j0uF6aKbKwgknD70Z/duVPN1E051F+lSvps3sdH/VpbZ57537wpUqmSyIcfquvERJFdu5Tm/6lTKi07l7jgv0R+yi9y8kul7X+PlJQUadCggYSGhkqcMU5OhpwUEVER/A79KG+/87ZUbVJVfINPy8lgHxk1y17WnVosFX6sIHgiTZY2ETyR5suaZ9Lj776mu3nf32Gig4THhwueSK15tURE7ftvv7bdfP7VV19J5cqV5fbt24IncizomIiIxCfHy0DvgdKsWTMJDg5+9G+uo/MPgtxwA8wwSEiTMfM0GAy7AWfgr9wejOjo/DPQwJSk3PYMli6iZeDyHHW02Pd4Cn9Nm8Ibb4C1terOM7J2rZL8dXKC27eVUM+XXyq7ABcXJe4TEqJWEC5eVEeRImpv/7XX1ApC7dpZy9VSwHcM3FgBb3hDkabmW1fOn6eUgwMHDhzAYDDw3aHvGLF9BDJO0MZqtHuvHVcCrnDjjSu4Hn6LKhcCmNthFe+s7Urd4nUB2NB1A98f/p7IpEgCogMwjDfwQY0PWHluJS+7v8zd+LtULFyRQnmVKNK4JuMAuBF1gxbLW4DAwLiB7N26l927d+Pm5oaMS3+HW9G3mO0zm/M/nqdYsWKP/s11dP6NWDJKAFyyOWwtefZZH/oKgE6ukZoocvTjJ3PTu7pEZH0JkdiswXCyACoCX3YEBIhs2aLOGzYUGT063Wq/SBH1O39+5lk/pNsI1KihVhCMRvV744ZKX7Qo3bUvjVh/kb/qKSv/xKyBc/pVrSp70+wM7mPq1KmCGzJ/8/9EROTyjT8FTyQqMUrwRIpNKyYGT4NUmV1FrMZbiYhISEyI9FzbU5otayYT9kyQNefXCJ7IoC2D5EDAAfnxyI/mvX4RNfN/s8+bUqxcMfEPyv67tmvXTg/so/OfgdxcAQBOAiWASJQQUAHglsFguAP0ExGfXB6X6Og8f1jZQdFmkKDBse1KMOdRuPErnBkDzXbDlCVKmjdNQCc71q5Vs3GDARYtgj590u+VLAmnT6fbHpQvr6z2CxSAAQPA0xPeew9SUsDPT/0uWADe3srSv1QpsLJK1/EPDFS/X32lVgjSCFyjhH0qfw6VhqoVD4MBVq/mVsOGiAjzz5zBYDCgiYamadhYq/9WVq1axYwZM3B+H6qHLwPTd5Qv9QYyTgiJCSGPVR5ikmIQhPNh5zFgMHsLlHIuRUB0ALuu70IQRrwygjUX1lDepTyD6g0yN09EGDVqFAEnArjV4RbhhFOGMub7sbGx5M2blyVLllC4cOFH+/PS0fm3Y8koAZgHtMpw3RL4HqgPHLWkjGd16CsAOk+MponsfUsk9rq6XrxYJIcZb44ErlMW85Fn1bWvr8iCBZY9++efYhbwyUiDBmq2f+eOup+Skr7X/+GH6e10chJJTs7sAZDG0KEqzK+IyNmzIkuWiNjYiJw4pFY7NrwgEn4sc70zZ4qEhMjixYtl5syZ5uSi04oKnsgnmz+Rld4rpVwpRwnd1sfsIaFpmtyMVv74eb3yZvHtb7yksbz+0+uZ0n44/IOIiFoB2DwoUzM0TZPhw4dLrVq1JDw8PNtPN3jwYFm5cqVl31lH518CuSkElF1haWnccw18Xg99AKDzRKQZukWcejxXPxFlOLfGVeTuicdvx7FjqoMXEUlNFbG1Vf989+9XadevK0O+VatE5s1L7+hbtEjv8NPSAgLSy71wQT2Tkd6tRNZVEDnQNdvtjsTERDl+/Lj5en/Afvl8++cSkxQj+67vk2OnjolzITvJ8wEi/j+bv9vgLYPNHXusMVbye+U3XztNchI8kaWnlsrAzQPlvbVK7e/UrVMiIjLsr2ESkZAeG0HTNBk6dKjUrl1b7t5V4kNh8WEy5M8hIiISExMjd+/elcTERF3oR+c/h6UDAEstmCIMBsMog8FQ6t7xGRBpMBisgRz8kXR0/gUc6AThR6Fgzcdz9Qs7BId7QuP14FLbsmeqVoWAgMxpdeuqJX5Q0fvSlvYbNYJx45Se/4oV0LUrLF2qlvcdHGD7dvVMfLyKHXD2rDIGTOPFF6FLF3UuAteWQBsfqP4ZNFgJtlmjfl+4cIFly5aZr6/cvcKGSxtwtHOk8czGfPFRG1Z/acS2fD4MP7/PxkvejNk1hg0XN9ChYgdGNRyF4zeOxKXEkcegtiBikmMY9PIglpxawqw2s7h89zKFHApRzU3FVPiu1XcUdCh4r5lCuTbl+HPnn2zfvh2Xe+9z5e4VZhydAcCKFSuYP38+9vb2utCPjk5OWDJKAAoDM4FT946ZgCuQByhnSRnP6tBXAHQeC2OkErtJDH38mX+Er8hat0xCORZRpoyamWdH4cJKu3/MGHUdEKDc9tLw81OzfEdHdaTN+q9fTz+vUiVrucnRIge6iWyqKhJ1PtuqNU2TrVu3ZnvPL8xPCo5BerYuLV5eXqIlRQieiPt37mI/0V7ar2gveSfmlf0B+82zfhGRiIQIWe67PFMEvwMBB2Tzpc2CJxIaFypJKUny5U4l2atpmgwcOFBwRxhFlnbExcXJ2bNnzXl1dP6LkJsrACISLiKDgEYiUktEBolImIgki8jVpzIy0dF5lpweDcEbwN7t8Wb+MVdgT2uo/aNZKOeBhIVBcrI637ZNzfLvR9OUO9+8eSrS3549aoZfqxYYjWrVoFIlqFJFzfZjYyEhAVJT1QrBtWvq/Nw52L07/b3unoA/X1Kz/VbHwLlytk2Miopi+fLlGI3GLPduRtyk/D4rOjd0YfTo0QzfrSIR/vT2T6SaUvG+4k1CagKNljaiVpFafPnqlxjGG6i/qD6X715GE43qc6tz7s45Xl36Km1/bYuME9zyuRGeEI7Xfi92XtuJ1ctW+Pj4EHU+CpksWdrh4+PDTz/9hMFg0Gf+OjoPwdJYAA0MBsMF4MK96xoGg2HOU22Zjs6zIPE2JIVD7Rng0eHh+bMjIQh2t4RqnlCqi2XPuLkp3X5QFv316qnzDh1g61Z1vncv9O+vzk0m5bf/1Vdqa6BOHdXJb9qkOvi0+b6Dg7p/+jS88EK6dsCJEzBhPFycDnvaQM1v4OV5YOOQbfM2b96Mg4MDy5cvx87OLtM9CdqE/5KPOR1mQ5tRR9kfuJ/pR6fTqGQj3B3dSZVU6rnXo1XZVgCUcynHgZsH6Fy5M8GxwQREBXA06Chn75zlYvhFZJyYffgLTilI59WdQYOVk1dSMbUiW7duxdk5s3JiYmIimzZtonHjxkybNs2yb66j8x/HUhuA6UAr4C6AiPiiIgLq6Py7CPgVgtaDdZ7Hm/knhcOullB+AJTrl30eERVgRyRz2qJF6vzoUSXRC5CYmL4yUL++6rgrVYLNm1XasGHQubPq9AHat4eoKLW3P29e+jv4ZPDU3bULJnwGrxyCgFXQ6iiU7JzjK4kIW7duJSwsDICAqHv2CaYkSIlh2pLd7DyVl4jjEdjY2LDk1BIA9gfup/IctZpwNPgoW69tpWaRmqz2W83egL2svrCa+JR4vmryFY1+akT/2v3pVLlTprrdHd2Z2nwqbIKLfhc5vu84Tk5Z7RLu3LnDrl270rYsdXR0LMGSfQLuufoBpzKk+Vry7LM+dBsAHYuIv6ms9J9k3zg5WuTPOiKnPheJjxdxds4+fG5iopqfR2ewsNc0kfHjlYV/RoxGtWef9swPyi1OQkJEmjRJ39dv0kSkYkV1Hh6u3AM9PdXxyy8ioaHpZQ5qLjLXRuTkZyKm5Ae+0p49e+TGjRuZ0vBEjgcfFzn/rfz2Qz2hIMII5NO/PjXv77dZ0SbHUL5V51SVIVuGiM14G+nyexfBEzGmGEVE5LtD32WSAjaZTNKrVy+pVa+WxMRkDbWclJQkM2bMkNT7v5uOzn8YctkL4KbBYGgAiMFgyGMwGEYAfk9jQKKj80yIOgfhRx5v1g+Qmgh73wKXOlBjkhLYSUlJF9rJiL296rYzzmRTUpQ1f5s2EB4Ogwer/XorKzh/Xgn4HD6swvLeuaOW+2fNUs8WLqy2B9KC94wfr7YR4uNVmZ07qy0GzQRnPKHpOXjTG2pNASvbB76Wn58fQUFBmdKk35/UyWvPxmtl6fLlUegB5IfpR6aTzzYfnk08Wf72ctqWbwvAO5XeYcU7K8zPv1v5XWYcm0EDjwYMe2UYAHZedmii8W6Vd/mlg1r9MJlM9O7dG39/f/bt2IejY9ZQyyaTidjYWLQMwZFStdQHvpOOjo7CIBYsmRkMhsLADKA5SglwGzBERO4+3eY9OXXq1JETJ04862boPK/EXYewg1Cm5+OXoaXC/o5gkxde+QWsrB+/LINBdfhphnyOjkpxMDISmjSB6dPV3v+ePbBmjbIR6NEDrl5VWwci0Lw57Nypzu/cUVr/0dfh2AdgsIEGv4DDg/XwL126RGBgIC0yqh3KvaiHAb9z8WYCjTqMpMLAChwyHGJN5zVMOzSNa5HXqFm0Jtv9t2cqr6prVXpU68HoXaMBqFGkBr6hvsg4YeXZlTQp1QR3J3dzfpPJRK9evQgKCsLb25t8+fJlKm+j30be6vcW4RvCKVSokDm9/6b+LPBZQLH8xSiUtxBnB5x9zD8IHZ1/LgaDwUdE6jwsn6XBgMJR43wdnX8XooGW/ATPC5wYBJoRXlnzZJ1/WnkAoaGwf7/a6z9zBkaPhsaNlSeAv78yAnR1VVLBK1ZA3rzpz+7YkV6emxuc+xl21IcKg5SkrwVtjIiI4Pbt25kTj38MJd9ly5389Hl3CP09+3PV7Srrqq7j7UpvU9WtKh95f8R2/+04WDuw8M2FzDsxjwM3D3A+7Dyjd43mWN9jONg6UDR/UVynumIYb0DGCctOL6NxqcaUKViG1NRUPvjgA0JDQ9m0aRN58+bN0r7qRavToXEH8ufPnyl9gc8Cvnz1S3q/1Bvbh6xu6Oj813ngCoDBYBj7gGdFRL7O/SblLvoKgE62xF2Hy7Oh1tTHX/YH8Pserv8ELQ5kK5qTIyaT6rwPHABbWxXhLzUVjh9X92fMgKFD0zt1NzflKliwICQlKePAmjWVdT/AiBEwdao6F4ENG6BtCzg9CoK9ocEKcHv1oc2KjIzkt99+o3///mY3utvBuyharAkk3CQiKS+FKhWhRvsa+Jb2Ja9tXvLa5iU8IZxzA85RdW5Vc1nOds68X+N9Nl/ZzMe1P2Zkw5GZ6krT/b8z4g5u09yY+cZMtlzaQp71eUg2JrN27VocHLJ6JXz88ccMHjyYypWzuiueu3OO0gVKkz9P/iz3dHT+K1i6AvAwG4D4bA6APsCoJ2qhjs6zxL6ICmn7JJ3/zT/g4nfQZNOjdf6g9vZ9fVVnbW8PcXFQvXr6/cGDVYeetrfdrZvq/CMjVecPqvOvUUOde3ikP5uQAMM7wJZakBIFbXwt6vwBjEYjCQkJ5uugmCB2b2qGFnWWJJuivPn2O4zoNYLTS08T83kM0Z9HE54Qzo73dtD6l9YUz1/c/GxB+4LULV6XNZ3X8NmOz7gVewunb5yYuG8iADJO2NJ9C27T3Nj+3naGbBrCn1//CcD69euzdP5pk5UPPviAsmXLZtv+qm5V9c5fR8dSLLEUvPcPzxEYA1wHpgBulj77LA/dC0AnEwm3RXa1Stf4vx+TybJywo+LrCmcvb5/VJQKxGMJiYkqcM/UqSJt2qi0iAiRixfTLfw7dFC/5cqJLF2arvbn6ytiMEim4D6mZJH+hUV+cxG58ZtlbRCRlJQUmTRpksTHx6sEzSRyapRIktLZN5lM0qlTJ+nSpYuYMnyjY0HHBE8kJinGbOVfb0G9TFb/Rb4tIngihwMPi/V4a9l7I3OI474b+srha4clf8X80r17d0lJyf7PZsCAAbIlLQSyjo5OjpBbXgAGg8HFYDBMBM6gbAZeEpFRInLn6Q1LdHSeAlqqUvarORmssjF/6dFDCeU8jPgA2PcW1FuUvb7/4cMqdO/Nm2o2/iBiYuCnn9QMfssWlebikq4EWLUqrF+vzq2sIH9+dU9ErRiIwPXr98q6BNsaQslkeOFXKPXuw9/lHiKCvb09NjY2YDKCwQpj/goM2/45ANYNrfEP8mfZsmVYWVnx2fbPWHNhDS8vehmA+T7zAVjy5hKOhhw1l/tG2TcITQilvnt9XlnyCqljU2lcKrOEyNTGUxnWcxhdG3Xl559/Vm3IgNFoxGQyMXr0aJo1a2bxO+no6DyEB40OgKnANdRyf35LRhTP26GvAOiIiEhKgsjm6tlGtzMTEyMSFPTgcoxRSi/fb3p6Wlxc9nlB5KOPsr+XnCzSvbuK8OfvL+YQvqDC8qZr+aXP8O/3dU+biWuayKVZImsKqd9H1DL47rvv5Nq1a/fqSFLvZ4yUhScWCp5I9xHdBVfEYYyDiIgERAWYZ/dvLH9Dqs6uKngiKakpYvA0CJ5Ingl5xO+On6SaUmXg5oESGhsqLy98Wc6GqnDIC30WyqAtg4SRyEsvvSSDBg3KtLKQkXHjxsmsWbMe6Z10dP7LkEsrAMOB4qil/xCDwRBz74g1GAwxT3NgoqOTaxjvKonb17c/eK/e0RHc3XO+r6XAgc7g1gQqDlFpvr5qVg6qq47J8M9C02D+/KzlhIUp5b6VK1WeNFnbjz5SvytWwKpV6fmnTYMhQ9KjAS5dqrT/ra1htpeKOeC/DFochAoDH9muoVixYjg55uP86WkU/s6dm/VWEpAQTb9N/ZhcdDLeP3lDD3B1cQUgxZTCS8VeAmBjt42cCzvH2QFnab2yNSf7nwQgWUvmxTkvYm1lzcgGI4lMiuRs6FlijbEA7PTfyd07d3lh4wu0bNmSGTNmYGWV+b+jpKQkwsPDGTVqFB+lfRsdHZ1c44FugCJiqVCQjs7ziWiwuzU0WgP5Sj5BOQInPlF+9LV/SO9kq1dP7/S/+AImT1Z569VTg4OkpKxlubkpy3+At95S+v2g/PjTfP/t7eHVV6FMGRg+XNW3erXK17s3BAbC0R/h9Kdw+23o4q1EfUwmtVVgwSBg1apVODk50bVrV4Zt6sOIPDeJS4rgljGRCvlKQCB4TvfE1MPEwOYDmdVWCQ9NPTSVk7dOkvpVKgHRShY4VUtl9/XdlHAqwehXR5PPNh8tyrYgICqA0jNKU7tobRJTE2mwpAEyTvi23rc0b96cIvWLMMV+Ct8YvsnUtjG7xpByMgXrCGsmTZqE721fas6vaY4RoKOj8+RYJAT0T0Z3A/wPE+0HjuXVIMA6G0W+R8FvGlxffs/dL6siHaBm8yaT6txv31bW+sWLq069cOF0ZcA9e5TW/61bys//jz+U33///ukrAklJamDxxx9qYJAvn7pfogT06gzNQ8ApHGZrsPVqurugwQAtW6YHEHoAx48fx9kmmvKJy7Ha/jN3RtzBNZ+a5fv7+9OwYUNmzJ1BF98u2FnZ0aJsC1wcXAiMDqRo/qKsOr+KCU0mMHZvZm/hdyu/S1HHosx4YwYmzcT6i+vpVLkT0UnRLPBZQMdiHanVoBYjPh3BubLn+P3878g4wTDewLG+x6hSsAp1p9RlULtB9HupH9bW1kQmRvLDkR8Y/9r4J/lT1NH5T2CpG+Az36N/2oduA/Af5mAPkbsnn7ycgDUi6z1UvIBHpWtXyWSlP2+e2qNP29tfvVr9Fiwo8vrrItu2qXxDhohMmSIyeLDIW2+lPx+0SWQmIqtai9ghcuhQ5vrCwnK2SbjH8ePHxctrokjiHRFTqsjt3ZnuR0ZGSsVKFaX5J80lMCpQmi1rZt7zd5zkKHgidxPuysDNAwVPJDg6WGrNqyVvrnxT8ERC40Kzr1hE/Pz8xMPDQ2iLHAw8KMmpyXIyRP0Zjd4xWkLjQuXAgQMyZMiQh35aHR2d7MFCGwB9BUDn30fYQTXzt3d78rLuHoc9beG1v8DlpQfnXbFCCfgcO5b13pgxSqt/zRol+JPR0r1IEbUCAFCyJAQEqJm8iwu8/76S/02OhpOfwoW1UGcBVHtXrQiMHq22CR6B8PBwbpxcS508G6HpZnP6Or91pKak0qVDF3AFWkMp51LmZf4eVXuw4twKCjsU5odWPzDr+CwO9z0MpIv6ABzpc4S67nWxMliRqqVic8/j4syZM7zxxhtMnjyZqIpRdKrcieKO6boB8fHxbNu2jQ4dHjMMs46ODpB7QkA6Ov88wg5A7JUH5+neXQXeeRBJYUrj/+UFD+/8QS3316qVfm0wKDsAgNmzVecP0LAhdOyoznv1UqGBb9+GypUhTfxGBO7eVZ3/rW2wpRpY2cH/YiCyqCp7wYJH6vxDQ0MZOaAjBRP2U6dlf2j8R6b7K86sYOTQkRTIX4C6vesCcG3wNe4MVx6/f1xS+U1iYvTO0RwJPkLaBELGCaaxJvwG+lF/cX18QlT4YduvbTGMN3D4yGGzsd/777/PkL+GcDDwoLnuyQcm03BWQ44dO8a/fVKio/O8oA8AdP49hGxVEf0qjwLXhg/O26MHfPhhzve1VDjYFcq8ByXetqz+116DefNg7Fhlpf/++5AWqCYyUu3v9+unfP5//12lL12qrPx37oSLF9XAJM2ALzES+hhgdw+otxh+MkDIXRUUKAM7/XdmmoHnROFChejwZmusjapDf/O3jpwJPWO+/8rNV4i7HkdU2yhmt52NjBNijDFcjbzK+9Xfp1DeQhSwL0BkUiQ3Y28C8LPvzxwNOkr5meWxnmDNi7Nf5FjfY9R1VwOI0OGhDCs+jLfefIuFCxfSuXNnQA0YOldR57GxsVz94yrv1H2Hb775xixBrKOj85SxZJ/gn3zoNgD/IYK3iNw5mDtlnfpcZGdzkfNnRXbtsvy5tP39jHoC48aJ9OmTOU8aXl7p9gC2tiJFi6rzyohMR6QfIsvmqrwgcuqUOl+3TqR3bxERiTPGyYaLG3JskslkkrmfN5aofYNERORG5A3BEyk3o5zs9N8pIiJTFk4RK2crCQwMlOWnl0tCcoJomiYT904UPJUNQ6EphcRhooP8ceEP8fjeQ1776TXpubanLPRRegGBUYESnZRZZ2H79u1SuHBh2bZtm3y4/kPp/UfvLO1LSEiQH3/8MUcdAB0dnUcDC20AnnkH/bQPfQDwHyB0r8iV+aUp6JwAACAASURBVLlXXuA6kfUlRRLDRPr3F7G3f/yyjMb0Dv7MGSUABCKTJqXnSUwU6dxZpdsh8nMzZeg3qJFItWrZl7tiRbp08AP46ch3khDjL/t2bJSU2GCZdnCaJCQnyA+Hf1BVpyTKiRMnpIBLASk5oqRomianbqlBxssLXjYb/+32320+b7K0ieCJrPdbL9uubjMPEO7H29tbXF1dZd++fSIisshnkSw5ucR8PykpSXr16iWRkZEiIjJp3yRxm+r20HfS0dF5MM/1AADoDJwHNKDOffdGA1eBS0CrDOm1gbP37v3IPRfGhx36AOA/QKy/GgTkBtGXRNa4ioQdtSy/pj1Yec9kUlr+GVcR0gYEJpPIvn0ir7yiroO2iPxWXGRfNxFjhPIISEp6otf5dDCyc0VXERFJMaUInsiRm0dE0zRZemqp8Cni7u4uXvO9Mun3nww5KVGJUTJp3yTBE+mwqoP5nu0EW3P580/MFzyRt1e9nane33//Xdzc3OTo0ey/o6ZpommaeHt7i3bv+525fUZmHp35RO+ro6Pz/A8AXgQqAnsyDgCAyoAvYAeUQckQW9+7dwx4BTAAfwKtLalLHwD8i4k6L3L8k9wrLzlWZFOVR1tNKFdOpECBzGlGo8hnn6V39M7OIoMGicyeLbJzZ3oAn8hIkR07RNq8IrKvk8iGF9Q2Rhog4ukpEv0A+eKcuLJAJOywnPH1lTt37mS6hSey/PRyiYqOEoogjfo0koTkBLkZfVMMngaznO/1yOuSkJwgL856UVy/dZWyM8qaBwGZqrp7RcLjw83Xy5Ytk2LFiomvr2+2TdM0Tdq1a5cuP/wvZdXZVbLL/xG2j3R0connegBgrjzrAGA0MDrD9dZ7nX4x4GKG9G7AfEvq0AcA/2JSEkRC9+deeUf6ihx6/9G09ENDRUJC1HnaEn+tWuqfVvHiIvnzK1/9mTNF7OxEChUSKVxY3U8xiizuJPK7i4jvV+p97gdEVq2yvD3JMSKaJic2fys/TBysivBE1l1YJzv9d8qo7aNkwp4JwlikRZsW0qFbB7l295p8sP4Dc+f+yaZPzOc159WUrVe2Cp7Ia0tfk61Xt0pkYqS5uqjEqEzVz5s3Tzw8PMTPzy/b5hmNRhEROXfunHnmLyJS/NvigicSnxxv+bs+51SfW10GbRn0rJuh8x/E0gHA8+YF4A7czHAddC/N/d75/ek6/0WSwmFXKxXRz8I494BS6TMYlHvd/QRvgts7oM7MR9PSNxggJESp/FWvrmR769dXVv0dOyrd/5MnYdAg+OQTVXeVKjD8TfCuAVfXwKWuUH2CildwPyLQpYvl7TnQBSJOULZBP15r3weAb5p9Q6XClWj2czPm+8xn7J6xtLvZju3ntxPRLIKyM8uyzHcZprEm+r7Ul7NhZ3m74tvMaDWDgMgAWpZrSZNSTZjTdg4ty7akgH0BAG5E3aDAlAJpg3KmT5/O5MmT2bNnD5XSohneR9euXTl48CBVqlTJZO0fkhACwCdbPrH8XZ9zfD/25cfWPz7rZujo5Iwlo4THOYAdwLlsjrcy5NlD5hWA2UDPDNeLgY5AXWBHhvRGgPcD6v4IOAGcKFmy5NMYYOk8K7R7luIRpx/v+fbt1RJ9RhLviKwr9nh2BCNGpC/1x8er31u3RCIi1Pnt2yKOjsqQEESG9BE50kfVd32lyKKFkkkp8IcflM3Axo2Wt0EziVyeK5KaJMGBV6VTp06Sel/kwKjEKPOs/ttZ30rJMiWl7cK2gifS8ueWUnRqUcET+WLHFzJx70QRkUzL/Xgi/b37Z6k6OTVZNE2TsWPHSvny5SUwMDDbJkZEREhKSoqEh4dnmvlnJDAqUBwnOVr+3jo6OtnCs14BEJHmIlI1m2PDAx4LAkpkuPYAQu6le2STnlPdC0SkjojUcXV1fZLX0Hme0FJVvPvE21CwxuOVsXGj0uNPQwSOfwyle4Bb45yfy4mpU+HIEXU+YgTUqaP8+V1cVNmOjmBnp7T9W9lDtV/A2gHa+oF7J/A5CZcvp5c3dKgK9JOcrGIIFCiglANzQjTAoESLUuMo6l6GTz/9FGtr60zZqs2thoONAwTAN+O+4a/Nf3E9+Tp1itVhm/829vfaD8CkA5OYeWwm3x36jh7VeqCN1UjVVP1brmwxz/bTsDZYM2jQIDZu3MiBAwcoUaJEpvu7r++myU9NGD9+PGvWrKFQoUI5+vlbGawo61LWgo+uo6OTK1gySnhaB1lXAKqQ2QjQn3QjwONAfdKNANtYUoduA/AvIfWeNXxcQO6W6/+zyKaqIqmJj/bcqVMiu3crvf6LF0U++EDN5OfOVTYEKSkq39ChIh6IfIXI14iURrnvubmJREXdswW4l3fkSFVeGomJavUgJ5uE5GiRLbVEUhLEZDJJp06dcpyBi4is3LdSyI/UGF4jU3qNuTUk1hgre67vEd9bvpm8AfYHKBsL+4n2gieZZu/JycnSrVs3ady4sURFZbYFSGPtsbXSdFZTSU5OznHmr6Ojk7vwrFcAHoTBYOhgMBiCUAZ+mw0Gw1YAETkP/A5cAP4CBoqI6d5jA4BFKDfAa6hBgM5/hQOdlcrfk4T0vZ+kO3ByGDRYDtb2j/bst98qNcFRo6BSJVi2TMn53rqlwvHa2EBKHLxvC18ZwLYJrK4KMS5K3vePP1TUP5H0uACaBhln7vb2KiLg/TNmUzKE7gFbJ2iyEWwcCIwJ5NUur+Lunr1pTExMDN07dsftDTd8HX1Zc2GN+d6YxmOovaA2lQpXosb8GmhjNea0mYO7ozuzj82m2c/NMKYaVcS+e21JSEjg7bffJjY2lr/++gtnZ+ds673jc4eO0hFbW1td4U9H5zlDDwak83yTEquWzFPjwNb50Qz0HsaxAarjrz3d8meCglRIXpNJdfRFiijDvthYtVQfFQWzZkKrwhAzG1wawLhLULgsfP+9kgguV+7J2h1/E86OU/LABgNjx47lisMVViWvQsapkX3GztZkMtG+fXsKFi3IypIr0cZp5vsiwo5rO1h/aT1Tmk+h1S+tONTnEAUmFyDaGM35/52noH1BYowxVCxcEQDD5waKehflxXIvcuClAySPS87SxNu3bxMQEEC9evWe7F11dHQeGUuDAdk8LIOOzjPlvBc4VoSyvXK33KjzcHMttLto+TPr1inL/m3bVOd/5446KlSAvHlVnp6toPh2OGsNpcdDky/UzB6efPASfgRu/Ap1ZkD9Jebknj174ubmxq8FfuVM6BlqzKuBjEsf2I8YMQJjspGmHzeleFRxQuNDSTGlUMK5BNYTrBGEpqWa4mjnyKE+h7h69yrRxmhGNRxFOZdy5LHOQzHHYoDq2F/Y8AJNmzZlmOcwFp1alG1TL168iI+Pjz4A0NF5jtFXAHSeT1ITITUWbAsodz9DLu9W7W4DxVpCpaHZ34+OVgZ4yclga6vSrlxRkfsmTFBL9f/7nwr8c/s2xIXBivegWghsATYDFy5BxYpq1m9nB82bqwh+trYqIJClpCZAciTkKQCxV80GkJs3b+bw4cMM+3IYqVoqbvnc0ETjYvhFKrtWBmDZsmV4eXmxaOMimvyWOYjQV42/IjwhnLsJd1nrt5ZSBUpxbfA1c2ChUQ1HMbn5ZHP+jUc2MqznMN5//32++uqrbJf0Q0JC2L59Ox988IHl76ejo5OrWLoC8EyNAP+OQzcC/IdyfYXIqVFPp+xbO0Q2lBNJNeacJyVFpGnTzGkmkzLaO3dOZNMmkWvXRHp2FmmHyBxEppQSaV9f5Rs8WCQmRhkBiqjgQJGRSjUQHiw2lBZQKDRUXV9bKnL26yzZYmJi5OLFi1L+x/LiMNEhy/0TJ06Iq6urnD9/3px2MuRkJiO/5NRkqTG3huCJVPixgoiIjNw2UpwmOcm1iHSlvrNnzwqOSL8x/STVlCqBUdkbG964cUNmzZqV87vp6Og8dfgnKAH+HYc+APiHYUpREr8i6T7/uc2+jkoq92E4OSn53jRAZNgw1UH7XxJ5A5EFtiIbm6e3OS1f27bpGgEZSUrKXGZO1KolcmGhSMi2LIOFmzdvSrt27czR865FXJPGSxvL+TuqDbv8dwkjkVKlSsmaNWvMz6WaUsV2gq3gifRa30s0TZO1F9bmGMwnjYMHD4qbm5v88ssvIiLy45EfszwTEhIiw4YN0y39dXSeAywdADxvSoA6/3Wiz8P5b9R5bi/7A6TEwO3tULLTw/O+/jq8/HL69aVL4DkGWlnB5orwVgX4OgV+KwLOlVXeXr3gxg2oXRu8vJSVf0bs7NTWwejRcPx4Dm2MBZ8TULgy5C2RxXbA3d2diRMnYmWlvk9gdCA+IT5UmVMFgGqu1ai0pxIhpUOIKhNFjDEGgN8v/E6KlgJAmYJlGLp1KDOOzAAgLjnOXL5JM5nPN2/ezFtvvcWyZcvo0aMHAIPqDcpkYwBQsGBBGjRooFv66+j8g9AHADrPByJwZ5/a326wPHfLDsmgGXVzPRR5DfIUfPhzf/yhOvX4eOjWGVb2hV+KQKsiUP0n+NEaSjeCuXNV/mHDoHdvOH9e2Qm4uORc9sqVSjAoO472U25+rg3AOV1SV9M02rRpQ3BwMDVqpAshvbf+PZJSk8yd8pTxUyhRsATdBnejr3dfvPZ5sfXqVrqv7Q5APfd6WFlZMfvYbPYF7sPexh47aztzeTZf2/Cz788sW7aMPn368OvaXwktGpptU6Ojo2nbti0iQseOHR/+TXV0dJ4b9AGAzvNBShRc+hFMxtwtNyoK3N2VIR6oQUaxN9T5uXOwe7dy3zOZsj6rafBCEQhYAPXWgPMlsPkUnCdCkw/Bzw/274f8+dUApmtXaNQIatWCjz+G8HA1ex80KN0TII2AAHjvvfRrEbgyX2kHvPITFH09U3YRwcrKiilTpph9/Y8FHyMkNoSAoQHcGHqDTZc38dtvv/H76t/ZXnM7NYqpQcK3h77ljRVv8GKhF6nqWpWjwUcp7Vwak5jo+GJHmpRqwunbp+m2thsAQZ8GcWvrLcaOHcvu3btJLJLIhxs+zPJ5TCYTzs7OjBs3DgcHFcdgh/8OsxGhjo7O843uBaDz7AneBEVbgnWeh+d9Uo70AtdG8EIv5bpnba0C+RQqpER8IiKU9X/LF6ChEaokwt4ocOoIdtWgTBn44AOoVw+OHlUugGvWqEBAJpPq9IsUUR2+wQCenjB+vFpFSHMVvB/R1HbHhW+hzHvgUCxLlpEjR9KkSRPatWtnTjOMNzCgzgDmnphLAbsCRAVGwTI4uvco84LncfLWSQKiAhhQdwCjGo5ind86em/sDcDFgReZfXw2U1tMpeCUgjjZOWEwGLgdc5sRCSPYvHkzW7duzSLtm0ZqaioNGjTA29ubIkWKmNOjkqJY77eeXrVy2W1TR0fHYnQvAN0I8J+BZhI5NkAkIeTvqe/cJJED3ZWVPygJ3wsXRKwQafmCyFkvkc01RH5zF9kxRCQxVGTpUvXsqFFiDvzTvbtI69YiN26o69Wr1W/XriLVq1ventREkS01RYzZS+mKiAzcNFB2ndwlcXFxEmuMzXL/wp0LMm//PPEo7SFF31dBfdacWyM7/XcKnkiDRQ3MVv+7r++WVFOqaJomeCKhcaESHh8uEQkREhEXIa07tpb69etLeHh4ju2JiIgQEZGgoCDL31NHR+dvA90LQB8APPcEbRaJD/576zRGivxZR2R5GZFPEDn8ochIRJbZinyDyOEBIre25+yBMGCA0ujPSFiY+vX3F4mOtqwdphRVj4hIfM4d6bp168SmsY14X/KWi2EXBU8kJCZEYpJi0osymaRNmzYyZMgQMZlMgidiPd7a3On7hfnJJ1s+ETyRpBQVU+HbA9+avQZEROLj46Vt27bSunVrORVwKovufxqapkmjRo3k4sWLlr2njo7O346lAwB9C0Dn2XFxBhRp+viR/R4XLVV5AiRHgSlRSQy7NYZNe6FzZ7WMX7s2/PILvPqqeubcOahaNffakBQGJ4dD/aVgZZ1tFhEhMTGRsLAwinsUx4CBJFMSjt840vyF5gysO5Bt17ZR+Ghh9u7dy44dOzBYG7D92pZNXTeRN09eem3oRUB0AMs7LKdn9Z7msvN8nYf57ebTq1YvwsPDefPNNylXrhyLFy8mz6Q8fNHoC7xe98rUHj8/P8qVK4emadjZ2d3fXB0dnecEfQtAXwF4fok4JXJ7z7NuRVbu3hVZuVIdIHLokEpPEwAqXFj9xt5bhk9OfvQ6InxFjvR5aLaAgABp1qyZ2dffaryVlJxeMlOeZaeXSa2htcTDw0Nu376d6R6eSPFpxUVEZMPFDRKZGCkiItFJ0bL16lb5bNtnEhYfJpcuXZJy5crJ559/bq7ry51fyq3YW1na1KtXLzl69Oijv7OOjs7fCvoKgEJfAXgOCd0Nxggo+YzdxvbuhaZNwc0NQrN3czMTG6uMA8uUgcuXVSwAgwG2b1cSvw/DlARJoWBfDKLPgctLOWZN+zd55coVKlSoAEB8cjxWBiscbJW1/Zc7v+TSpUvs89yHt7d3Js39irMqcvnuZVXWuMz/vg3jDZRwKoGLgwu+x3xx3ezKJK9J9O3bN8f27Nmzh4oVK1KsWFbjRB0dnecPS1cAdDdAnb+PpDC4ulD54T/rzh+Utf5nn6mAPslZI9qZmTIFnJyUlf/Vq6rzB+U18PrrOT+XkZA/4fJs5enwgM7fZDLRtGlTQkJCGHp8KBfCLgCQL08+HGwd+OvqX7Rb2Y4Z+2awfvx6vLy8KF2lNJ9s+QQATTQu371Mj6o9+Pq1rwGYdWyW2TVPxgmBnwYy0nEkrptcWfHLigd2/gCnT58mICDAsvfU0dH5x6BHA9T5+9CMue/n/yiIqFC+Z84okZ4XX4Q2bVRH7uSklPuGD8/8THg4rF6dffCeokUfXufN9YBAiXfA4+2HNE+wtrZm8eLFuLu7czLkJI2WNqJSoUoc7HMQAP9If/YH7Cd+dTyOZR3p168fVeZU4ULYBWa1mcX3h7/HPb87v57/FVsrWy6EXWB+u/nUKV7HXMfEiRNZvHgxu3btouoD7BrWrFmDm5sbQ4fmEDBJR0fnH40+ANB5+mgp4DcNKn0KFT95Nm1YsgR++01F+UuTqxVR54mJMH26ms3HxSmBn7p1VZ6QEPDxyZzfElLiwNoe8pUCw71/Zg95dvDgwbRs2ZL27dsD8Fvn35h+ZDpNSzcFYOvVrXxY80PObTzH3Ji5LFm1hEUnF/HRSx+RkJKA82RnYowxTGs5jRHbRtC7Vm/+vPonjnaO1PeoT3JyMh999BEHThxg34F9lPQo+cD2uLi4UKBAAcveV0dH5x+HPgDQefqIBlZ26R3h02T3bmjSJH2ZPo2iRdX+/dat97Xt3h55//5Kse+FF2DEiPT06tXV7zffWN75A5wcBsXbQIkHz/rT0DSN0aNHU6hQIQA6/d6JtX5rkXGCX5ifeQn/+xrfM/f7ubT/tj07A3dyPuw8+3rtw2ufF/Y29hzpc4QXXV9k+CuZVzIiIyPp2LEjTk5OXHvrGmFWYXiIBxfCLlDVLfMqwMqVK4mJieHjjz+2/H11dHT+eVhiKfhPPnQvgGfMhe9E4gL+nrrSwuj6+eWcZ8yYdCv+jKRZ+mcngPPOO8rH3xKuLBRJuqsEfizk999/lxEjRmRKC44JFp8QH9l3Y5/YTrCVWUdnSUxcjOCGtB7eWsLjw82R/fBEIhIiBE8kxZQiMUkxsvLMSlnvt15ERPz9/aVSpUoydOhQSU1NNdex7eq2LFH9TCaTBAYGytWrVy1uf25S7sdyMmr7UwoDraPzHwFdCEgfADwXXPtJdYjPktGjxRyWF0TOnFHnjRqJ7N4t0q2bSFQ2Snw9e4qcOGFZHalKYEcu/igSdyPbLL+e/VVmHp2ZKU3TNElKSpKQEKWEOOfYHIlPjldN9UReXviy9Pqjl4iIDBs2TBq1aiR34+9KcmqymDST7Lm+R16a95K5rK6ruwqeyCuLXhE8kUOHD0mxYsVk5szM9WbH6tWrZciQIZa971Nioc9CORFs4TfX0dHJFn0AoA8Ani3Xf01Xuvs7iI5Wf53vV+kTEQkNFdm6Vd3PONNu0SI9Pe0ICBCZO1ekcWORChVEvL0fXndqksimKiLGiAdm+3z759J+ZXtZd2GdlJpeSm7evCmNGjUy+9+LqE4/bWY+ad8ks//+9u3bxd3dXfgM86y/4syKcjdBDa4OBR6S0tNLC57IsL+GiYjIzKUzpXDhwrJx48YHtkvTNImIiJCkpCQJDQ19+Pvq6Og81+gDAH0A8Gy5c0Ak8tzfV5+mifTvr84PHxaZPz9rnoYN1V/5WbNErK0z3wsNFfntN7UVMGSI5LgdkBFjlMi1pffOs+/88URmHZ2VKe148HEZ4D1ARESuX7+e7TM91/YUPJHzoeclPDxcPDw85Iv5X8ikfZNE0zSJSYqRyrMrm5fw8US6r+kuYfFhommaTJ06Vdzd3cXHx0eMqcYHvsauXbukS5cuD35XHR2dfwz6AEAfADwb7p4UuTDt2dTt5ydiaysyaZJI8eLqNyBAxHivA5wzR8TDQ2TePPVX38pK5HH3uk3JagBwekzOcQNE5ETwiSwBfDRNkxYtWsih04fkm/3fmDX3TZrS8b8ZfVNERAKiAuRq+FWhMjJkyBDBE1nos1BcpriYVwbuJyUlRfr37y8upV1k+O/DxSfEJ8s+fxqpqaly7pwapCUlJT3yJ9DR0Xk+sXQAoAsB6eQuDkWhQLVnU7ednfIAGD0agoPhiy9U6N403foBAyAoCNq2VQv+jRvD/v2PXs/tnXD4fcjjDDW+VqF8c6B28drkz5PffC0iGAwG5s6dS5hdGKN3jsZqghUHAg5wJOgIi9ovorhjcQCCY4Ip17cc5bRyNO3bFIB+3v2ISIwgPD48S1137tyhVatW3Lhxgz4/9qHiCxWpVbQWoSOyVzm8ePEiEyZMuPfpdG1/HZ3/GroUsE7ukBoPZz2h+kSwfgadSXS0kuqFdBc+UOp9d+8qud/7CQtT6SkpYGOBi2LESaVp4FIHUmMgT8FHbubXX39N6dKlee+991TzNBMlfyhJSGwIAC+7v4xJM+Fzy4czXc7QsEFDDuw5gF1xO5aeXkrb8m0pYF+AakUyD7KW/LGEPh/0YczgMXh6emJtbc3oHaNpUbYFr5fJrFZoNBrZvHkz77zzziO3X0dH5/lHlwLW+XuxygPOVdXvs8DJCT7/HCIj02V9T5yA/PnB3j77Z1xd1WDhYZ2/ZlL5Em9D0m0Vve8xOn8Rwf5lewpUTxfX+WTLJ7jlc8M4xsicNnO4En4Fn1s+zGgxg4/7fMzYL8fy+l+vU2l2JSY3n0yjUo0ydf4iwnfffcdnH31Gg/814Ouvv8baWkUX/PPqn/hH+mdpR1RUFHv37kXTtEd+Bx0dnX8P+gqAzpPj952SuXUs+/fWGxWVPusH1fF37Qrr16sOu3Zt8PVV6n45DQIs4ehH4N4ePNo/dhFHjhxh/vz5HKp9iJ7VevJVk68AOHzzMFfuXuF61HX23NjDnoA96oGDUDexLlu3bsVlqgvD6g/j+yPfc/PTm3g4KVni6OhoevXqRVBQEKtXr6ZUqVIPbEN8fDzffvstX375JXnyPKOBmo6OzlPH0hUAXQlQ58lxcIc8f7NkbHQ0FCwISUnpe/zNmsGBA1CjhrpOk/D184PKlTNvDTwMEQj4VWn41/ACu0JP1Nw6derg4uJiju6XxislXqGKWxWcJzsTMiwEo8mIo+ZIiekl6PpzV6KTo80R/ZJSkyjkoNrh6+tLp06daNWqFb/++qtFe/h58uShSJEi5hUCHR2d/zb6FoDO4xO6G4I2QumuT9xBPjLOzmrvPmPHt24dTJ2qovdl5IUXYOVKdW4wqBWCnLhwQS35A0RfAGM42Ls+0NDvQcTHx9OsWTOSkpLQXDSzpG9GnOyckHFCMcdilJlRhm7Du9H1na4MPzWcxScXA+C1z4s5J+bgYOvA0qVLad68OePHj2fWrFkP7fyNRiOdO3cmLi6O//3vf/oAQEdHB9C3AHSehAgfFfSmSJO/r87YWKXn36nTg/Olpqq9/VOnoFat9PRJk6BHD8huuTwsDEq6wdrq0PII2DjkSpPPnDlD9erViU6KZuqhqUx8fWKOeaf8NYXJ3Sdz+tRpUhxTKOlUkhrza9C6XGtqFqrJ3rl72bJ7C2693PD9yvehdduMt2Hb+9uwDrSmcePGGB4lnoGOjs4/Et0IUOfpkRQOF6ZCwZf+3s4fYNcu6Nw5/VruRei7ejU9LToabG0hIgJeeknZAKTxxRfZd/7JkWA8BIkCTf/Mlc5/wIABHDlyhOr3Ago52zubO/+k1CSmHJjCOr91zD0xl8DoQADOrD1DYuVEbAraUH5meey87OhapSu1rWrzfd/vSUpKYvHGxbSq3+qh9WuahrZE48b1GzRp0kTv/HV0dDKhrwDoPDpJ4RC0Dsp99Kxbovj9d+jQQXX6ady8CYcPw8svK2+AB60YaCZIugWX50DNSbnWrPPnz1OuXDns7OxIMaVga21LZGIkzvbOXLl7hUqzK1G3eF2OhxwHYE+PPbSs3pLSY0tz2XiZy59cptb3tTBuN+IS4MKkSZPo3bt3th15v4398GzqibuTO6As/QsUKEBQUBAeHh659k46OjrPP/oKgE7uIwJ+34OVbe51/hs3Kte9x0XT4N13M3f+oKz+u3SBjz/OvGJwPwG/wanhkNcj1zr/5SuWM23aNKpUqWLen88zMQ8LfRbi8q0LX+78koqFKyLjhGP9jnH5k8sA2IXb4VjMETtnOzqU70CFbhVwWODAoFcHcfHiRfr06ZPjLH7RqUVci7xmvn733Xc5ffq03vnr6OjkiD4A0LEc0QABq1x0HnnrLfD2tjx/vnzQ/p473tixYG0NKXl5+wAAIABJREFU48apbYCMpPn4N20Ko0ZlLSd0L3wzCGr3g+oTHrv52fH+mfcpVqdY5upGhNKrVi9knPBN828y3UtKTQIgLj6OfKn5uLboGns+3UNjGnPw4EG+//57ChZ8sO6AjBMal2rMpUuXMBqNeHt7U7NmzVx9r+zQRMOUZjSZywRGB2IYb+Dfvkqpo/Os0N0AdSwj7CDYOMKLw3O33Ef9z33fPihcWJ1//TW88Yaa5RcvnjVvfLySBY6PT0/TUtQKRkIgNH8Z3GqCrdPjtz8DQUFBjBw5krBFYbhOc2X9nfUsenMRBewL4JYvGyXCe1QrUg0Zp7S5vby8MBqNvPrqq1SsWFGVGxNk9v1/GDNmzKBr1640btw4V97pYZT+oTRhCWEkfpmY62W7O7rza8dfddsFHZ2nhG4DoGMZgWtVR1msxdOv6/vvoUoVaJXB0C0sTM3q78dgUHr/P/2U9Z6mwWuvwZ496SsEu1pAralQMPdnxyaTiSNHjtCwYUMKfVuIiMQItvXcRoMSDXj7t7fZ2nMrJs2E134vdlzbQePSjZnU7MHbDiKC1QQrznx8hipuVbDKwR3x0KFDeHh4ULJkyVx/rwcRY4xBRHC2d/5b69XR0ckZ3QZAJ3cwJUPIX1Cy49/T+QMMHw4jR6ZfR0UpzX6jMWtekew7fwArK9i7F0xJSq1QNGi4Ktc7fxGhb9++3Lx5k4YNGwLQ8cWOHO97nBZlW5BsSmaH/w4MGIhKimL83vF0rNyRFi88/HsaDAZWvLOCzVc2Yz3BmqNBR7PN5+vry7Vr17K99zRxsnPSO38dnX8o+haAzoNJDIHgTVCsVdZ99qfF/atSBQrkvFUQEAAzZqhVg4xoGixYAL26qJULLRlMxlwXLDKmGrGzsaN79+54eHgQY4zhyt0rzG07F5uvbQgZFkIxx2JmNT/XfK7m8wdhGG9gbOOxjH9tPDeibpg7/nIu5TLlW7duHY6OjgwYMCBX30tHR+ffj74CoJMzESeVdXzdWX9f559GXBwEBmZOi4rKms/PD6ZPz5oeFQWTB8D+zip4T5XRuSbskxH7jvYYuhq4XuA6NjY2zDsxjzoL62DztRpb99nYJ1N+70vexBhjzNfXIrKfte/vtZ/B9QYD8EWjL9jQbQNz2szBxcElUz43Nzdcs9sa0dHR0XkIug2ATvaIwOH3oOpX4FTx76+/d29YuhQSE+GHH5Qlv5UV/PEHNG+uvAFy4tZ2JeFbupua9T/F8MR7j+/l5J2TvPfaexTOW9icfujmIVzzueKa15UC9ulxEgzjDax8ZyXdqnUzX5/qf4qaRXPelgiLD2PWsVmMf228OW3JkiXEx8czaNCgp/BWOjo6/2QstQHQBwA6WUmOVtby9oUfnvdpERwMHv9v777Do6rWPY5/V0IaHQJIh0gTAhgJhHgQpWPBIwdFENBjxYbX7hUbRs9VDgpiFxQLiKAgR0QFOdhQFOktdKSFAFICJCE96/6xh0BMh5lMkvl9nicPM7u+ez2j691rr71WY9i6FVq3hhMnICTEGdlv/fr8Hwmk7Hem6U3cDhmJUPdij4W3bds2PvroI6bVmUZ8YjwZT2d47Fzf7/ye3lN757wpkJ6eztGjR8nOzqZRo0YeO6+IlE/qBChnb9882Pqad2No1Mip5Fu4phi21hnbf+1ayCrgvfN1Y+DPxVCzvdsr//jEeEyMIdtmcyLtBHsy9tCtWzdi74nlyGNHcrYzMYaHv837qqSJMcT+GXtW5+49tTcv930ZgA8++IAxY8bQoEEDVf4ick7UCVBySz8GYSNK/n5+SUVEOJP6nHde4dud6nuQmAjVqzvfz+yPYLPh1xuh0wSImuSxvgp1K9clpkcMWZlZXH3L1Sxuuhg79nQZnUg7wU3/uQmAOyLv4GDSQc6revra3rjiDZrXbI61lkGfDeKjgR9RPah44w9M+8c0utbvyt69e7nxxhtJT09378WJiE9SC4CclnEC/tsNMlM83+lvxw7n+X5h4uKc4XytzTvQj82Gw79D9MXQYBgE1fZozAH+ATxz2TP4+/tz+xW3k/l/mbnWH089ztwtcxnZaSRt32xL/fH1c93x3xt1L1UCq2CM4YvNX3A89Xiu/dMy00jPyr9iH9FxBBt/28iECRMICAigSmH9H0REikl9AMRxalY9T3Sai4yEhQshtIhX8GbNcib1qeRqmFq6FC65BO6/33nN79Rv1VpIOwS/3wE9v4RDh4s+thtMmTKFiIgIIiMjGfTpIB7r9hjRjaPzbPfOineoHlSdwe0GE+AfkM+R8vKL8aNBtQbse2hfruVHjhxh/fr19OjRA2utRsUTkSKpD4CUTOwLsH2yZ3rMr1lT9N2+tc6kPtu2nV4WHQ2Zmc5Y/7Guu+l9X8OKeyG4Hlw2F7JtqVT+E5dO5IjfEWrUqoGJMfyR8AcJKQlsPLQRE5O7Ur6r810M6zCMAP8A1h9cj4lx7voLk/pUKrvu35Vn+a5du/jll18AVPmLiFupD4A42twH2ZlFb3c2Cuq0dyZjTt/hJyU5r/xlZ0PVqs6z/+rb4ZiF83pAaBfPxFmAP/74gxdee4HH73uclue3pG2dtiy7YxnpWelkZWfxVPen8uxzw+wbuPC8Cxn9/Wi+GPIFvcJ65VqfkJJArZDTE/wE+gfmWr99+3a+/PJLHnroISIjIz1zYSLi09QC4OsyEuHXEeAX5DxHLwuqV4fzz4dq1WCdc/dLVipkp0KlKs7dfynKyspi4oCJPHTxQwBsvHcj+07so9qL1Zi4dCLP93o+zz5nDo97zQXXUC2oWs73bJtN7XG12XN8T579cvavUYOG+U1wJCLiJuoD4Ouys+DAImjYv+htS1viCVjSG7rPgSpNSv301lref/99RowYQVBQ3kcjby57k1HzR9E6tDUzrp1BpwadCjyWiTH0Pb8vS/YuIfmJZOZvm89Pu39ibJ+xubbbvHkzzz//PB9//LGa/EXkrBS3D4AeAfiy+G8hoGrZqfyjopyZ/W65BtY+CT+0hnVhcLmr8r/xRpg9u+j+BG6Snp7Otm3byM7Oznf9sA7DeGv5WwRVCsLgVNYFddR7qe9LdG/ancT0RAD2ntjLj7t+zLVNSkoKrVq14pFHHlHlLyIep0cAUnZcHg2tAyGkIYT9E1q0hFZnDEP83HOwYIFHQzjVIvb7779z+PBhxo4dS0hI3jkE1h9cz9hfxvL18K9ZfcAZynfcknH4PZf/f1KP/O0RujbuSp/z+wAwMnIkS29fmrN+x44d9OrVCz8/Py666CIPXJmISG5KAHzV0VXO9L51u3k7EsjKgI0b4K4roMlJMH5Qv5czBsDzZzxfDwuDyy7zWBj3fH1PTgW+cPFCNm/enO92KRkprNq/indXvesM7jPGueu/L+o+to7amms7E2NyTf7zV9ZaNm3aRIsWLViwYEGBd/4mxjBvy7xzuDoRkdzUB8AXZWfBT1fDxR+Weoe6fM27GsZ8Bau8+1tMTEsk7mgcy1Yt4+YVN+eZtvdY6jFqBNWgyStN2Je4r8BpfZPTk2nyShMOPHKApXFLubTZpQWec9++fdx8880sWLAAf3//ArebFTuLfi365epcKCKSH40DIIXr+Y13K/+sVFh6q/Nv/2mwMv/n7KWpWlA10v9MZ9k3y/Kt3Gv9uxav/v4qcQ/FFVj5gzNqYFpWGgF+ATmVf7bNfX3p6elMnz6dhg0bsnDhwkIrf4DB4YNV+YuIWykB8DXH1sMP/bx3/oPb4dcp4B8Mja8B4w+BNT0/9HAxxMbG0rFjR958800SUhIY+8tY0jLTcm3z3R/fFXmcQP9Akp9IzmnOv3Xurfg/l7uCP3nyJKtWrSIzMxNjDFsOb8kzoJCIiCcpAfA1NTtAt5mle05rYenPzhwD74yF8bfDjBmwNAP8ijdUrqdlZWXxwAMPcODAAQBqj6vN6O9Gsy/x9NC8doxl3rCSP4d//YrXiXswDoATJ04watQoQkJCGD9+PAEBzvXXDqnNLRG3uOFKRESKR30AfMle13C0TQZ65vjR0dC/PzzwAOzcCZ1c78Vv3w4xrSDmIzjfmTGPgQOhRg346CPPxFIChw8fpkqVKgQFBZFls5wm/Mw0giqdfvd/97HdpGam0qZOm0KOVDhrLdZaZs2axfXXX69X/UTEI9QHQPKq0gSqhnnu+NddBz17wvjxzgRANht+ugYaV4cP06D5CJg40WkR+OKLUqv8l+xZgokxTFk1Jd9m9kmTJvHRRx9x27zbCPxXINZagv8vmC2Ht+S8FnjTf26i87tF/vdUoOTkZP72t79x8uRJhgwZospfRLxOLQC+IvVP8A+BgGpFb3uuknfDge+gxa1weBnUjgQ/fzh+HGrWhNRUyGdkPU/Zc3wPE36bQEyPGJbtW0bfFn1z1iUkJFCzZk2staRnp5Ocnkxo5VDC3wrnj4Q/SM1MJfuZ7HOqsI8ePUrt2rXZvn07LVu2dMcliYgUSC0Aktve/8C2tzx7jqOrIXkP+AU7vfsB6kQ5lT84Tf7WerzyP5lxkqzs0xMQNa3RlImXT6RGcA36tujL5sObMTGG2NhYBg50Hof4+fkRXCmY0MrOzII//PMHtozawoa7N1Dr37U4kHQgz3neX/0+1V+sXmgsaWlp9OjRg4SEBFX+IlKmKAHwFa3uhHb/65ljJ+92/v3zJ0jcCiHnQet7PHOuYqjyQhV6Te1V4PpWtVvx7dBvCQ8PZ+HChfne3derUo+mNZoSXi+c0MqhdHy7I32m9sm1TWpmap7X+870/fffExgYyPLly6lVq1aB24mIeIMSAF+QsAY2vuT+42alO3f6iwdCRhJc8ADUz11JsmYNPP54/vt76PFT2lNpfHdTwa/r+Rk/xtw8hlWxq3JN8nPZB5fxr8X/yrXta7+/RlTDKBaMWMA7A97Jte6eLveQ9ERSvudIT0/n3XffJSEhIeccIf8XwuBZg8/2skRE3EoJgC8IqgOhZ9+BLRdrnb+9X8Dyu533+S9f5UwqlJ/YWPjgg/zX+fnBrFnuiesMgf6BVPLLf56rrCzn0cBLU18icnZkrnX9W/YnunF0rmXnVTmPelXr0alBJ1rWLroJPy0tjdGjR5ORkcGMGTOoXfv0FMtzh86lQdUGJb0cERGPUALgC0IaQd3u53aMU3frPw+Coyug4RXw/F7o0aPwQXyGD4eDB/Nft2YN/P3v5xZXCb322mu8/PLLtKzfkp9u/inXuie6P5EzWQ/AivgVGGN49fJXi3Vsay2BgYG0bNky5/3+M1ULrMbry14/twsQEXETJQC+YP2zEPvi2e1rrdO576erne+dX3d69fsHwaNPwFNPnX1cF15Yqm8D7EzYSeZFmdx+++28veJtLvvQmVjo1rm3snzf8jzbz9k0h/vm31esY6elpdGtWzeOHz/ObbfdRmBgYJ5tLm5ycaFDCIuIlCa9BugLrC3ZULuZKVApBH6/AxoPhAb9Ie0whNT3XIwetmfPHq4achUb+m3Axji/+c6TO/PI3x4h5qcYXuz9IhlZGVw/+/oSV9Lx8fE0bNiQHTt20KJFC0+ELyJSbHoNUE4zBvZ9DZsmFLxN/HxIPQTHYuG7ns6yjs87Tf1+lXJX/sbAL784n48fh5tu8lzsbtKkSRNmfzg7p/IHiGwYSYOqDdh07yYGXjCQ6eunl/i4qampDBgwgGPHjqnyF5FyRQmArwjtAvV7O1MBf9fH6cF/8EdY+7SzPmE1pB2CGm2h7xJnWUh9MPn8RObMOT3M78GDMG1aqVzC2br//vtZu3YtbdrkHsZ30oBJXNb8spzvyRnJrL5zdbGOmZ2dzaeffprzml/NmjXdGrOIiKcpAfAVwfWg1oWAhQv/5dzV12gPzW9w1oc/ATXaORW+nz8cOgQPP5z/sf7xD6hc2fncurXHXudzl2HDhuWp/PNzMOkgJ9JOFOuY6enp/PzzzyQnJxc5la+ISFmkBMDX+FWCOtFORR9cx6n087NlC0wo5JFBObBjxw4mTpxI165dCQkJyVmenpXO9HXT6f9x/1zbr71rLf9e8m8S0xILPGZKSgq33347mZmZvPHGG1SrVgpDK4uIeIASgIpuxoyCB+IpzCWXlPk7+6IEBQXRtGnTPMtnxc5ixH9GcCj5UK7lxhi+2fYNSen5D+6TmZlJcHAwAwYMoPKpFhARkXJKbwFUdG+8Af/9L8ydW/x9srOdQXrKsc8//5w+ffpQo0YNtxzv5MmTREdHs2TJEt31i0iZprcAxDFqVMkq/9hY8Pcv13f/1lqWL19OQmICWw5vKXLbomzatInKlSuzaNEiVf4iUmEoAZDc2rWD7dtLNm5AGXLs2DG2bdvG2LFjmbFzBhe8eUGB236w+gP8niv8P4Hk5GRGjhxJUlIS9erVy3eb2Rtn8/XWr88pbhGR0qYEQHIzBsrx++zLli3jww8/BGB099H0CuvFgcS8U/kCDG0/NN/X/io9V4nY/bG8+eabBAcHs3jxYqpWLWCuA2DyysnMjJ3plvhFREpL/jOmSMWQnQ2jR8MLLzjN+hXcwYMH6devHx3/1pEjJ48QWjmU73d+z/0L7md/0n4W37I41/YhASFE1I/Ic5yezXsSVCmIQ4cOkZ6enusNgvwsvHGhW69DRKQ0qAWgIsvIgHHjIDXV25F4XFZWFldeeSUHDhygyStNcsb5/2bYN3y28TO6NelWrOMkJSVRZU4VGlRuwLPPPltk5S8iUl7pLQAp9zIzM0nPTscPP4IDg3Oty7bZHD55mHpV6mFiDKO6jOL1K/OfkS8hIYFatWqxZMkSunUrXsIgIlLW6C0A8RmTJk2iSr8qRE2JyrPOz/hRr4rTeW/RjYt4/JL8x0Q4evQol112Genp6XTr1g0TYxj/63iPxi0i4k1qAZByLzMzk4QTCdSsUZMA/wB2H9tN/4/7s3nU5iL3TUxMZN68eQwbNoy0tDSCXNMTL9mzhPB64dQM1hj/IlK+qAVAHF99VW5f6StKdnY2na/oTMD/BlC3dl0C/AMASM1MJTM7s1jHSEtLY8OGDVhrcyp/gG5Nu6nyF5EKTQlARRcVBW++6dlzXHMNvP22R0+RkJKQZ9AePz8/Hr77Yd4f/n6u5W3qtGH7/2wv9HirV69mxIgR1KlThxdeeAFTQZMkEZGC6DXAiq5ePbjnHs+eo1kzaNDAo6eoPa424/qM49FujwIQHx/PDz/8wPDhw0t0nPT0dOLj4+nQoQNPPfWUJ0IVESkXvNICYIwZbIyJNcZkG2M6n7G8uTEmxRizxvX3zhnrIo0x640x240xrxndsp2du++GX3917zFfew0GDnTvMf8i8+lMHvnbIznfExMTOXnyJOAM5ztvy7w8++Q3q98PP/zASy+9RKVKlbjggoJHCRQRqei81QKwARgETMpn3Q5rbd7RWeBtYCSwFPgGuByY77EIK6qff4YePbwdRYn5+zkDGe06tovUA6mEhYXRpk0bAA6fPMzfZ/6djKczqOTn/KRX7V9F5ORI7BjnscGSJUvYv38/1113Hf369fPORYiIlCFeSQCstZuAYj93NcY0AKpba39zfZ8KDEQJQMlt2ODtCM7a8dTjhL0axv8c+x+uuuKqnIq8bpW6ORX9KRfVv4jkJ5Kx1pKdnU21atVyWgzUeCQiUjb7AIQZY1YDJ4CnrLU/A42AuDO2iXMty5cxZiROa0G+88FL+VQjuEaeir4gxhgqB1Rm7NixBAUF8eCDD3o4OhGR8sVjfQCMMYuMMRvy+bumkN32A02ttRcBDwGfGGOqA/ndshVYE1hrJ1trO1trO9etW/fcLqS8S0/3dgQlVmdcHQ4k5Z7A56utX2GeNfTp04ddu3blWvfdH9+RkZWRa9ns2bM5ePAgd911F/fee6+nQxYRKXc8lgBYa/tYa9vn81fg5PTW2jRr7RHX55XADqA1zh1/4zM2bQzEeyr2CiMtDYKCICHB25GUSNVAZ+a96PeiuWXuLc7nxtFMunoSb7/9Ns2aNcu1fZ9pfVi2bxkAGRlOIrB//34OHz5MzZo1CQwMLMXoRUTKhzI1DoAxpq4xxt/1+XygFfCHtXY/kGiMiXb1/r8JKDCREJegIDhwAGrV8nYkhTqQdIAeH/bI+b7rgV3Ur1qfB6Mf5NaIWwGoU7kOwbHB1K9fP88zfDvG0q1pN7KysoiKimL//v3cd999hIeHl+ZliIiUK956DfAfxpg44GLga2PMt65VlwLrjDFrgdnAXdbao651dwPvAdtxWgbUAbA4zjvP2xEUKSElgaVxS/MsH9J+CN2bdQecV/1Wr15NQEBAnu3+/PNPXnnlFfz9/Vm0aBENPDwmgYhIRaC5AKTcOnjwIImJiTRs2JBJkybxwAMPqIe/iPg8zQUgFcq6deu48cYbsdYyf/580jPTmT9/Pt9//z2VK1fmwQcfVOUvIlICSgCkzFlzYA0mJndl3q5dOx577DGMMXz88ccEPRnE9qbbGTlypJeiFBEp3/QIQMqckxknmb1xNjddeFOB2xw+eZjqQdUJ9FcPfxGRM+kRQEW0e7e3IygVlQMq51T+fab2YcOfeUcvrFO5jip/EZFzoASgLJo2DebMcT6npYExzut8zZvDiRNeDa207Tuxj2Opx7wdhohIhVMWhwKWmTOhcWMYNMh5l//zz6F+fajgj2vys2nUJm+HICJSISkBKIu+/jr390GDvBOHiIhUWHoEICIi4oOUAHibMTB1au5lu3c7y32wyV9EREqHHgF427Rp4JrXPkejRvDJJ04SICIi4gFqAfC2ESOgXr3cyypVghtu8E48bnIs9Rjf7/ze22GIiEgBlACIR3yy/hN6T+3t7TBERKQASgDEI+7pcg92jPowiIiUVUoApNQ0HN+QySsnezsMERFBCYCUojsj76RLwy7eDkNERFACIKVoTI8xtKnTBhNjSEpP8nY4IiI+TQmAeMSJtBP8Hvd7nuWVAyrz0cCPqBpY1QtRiYjIKUoAxCMmrZhE9JTofNcVNs2viIiUDiUA4hGPdntUbwGIiJRhSgBERER8kBIAERERH6QEQERExAcpARAREfFBSgBERER8kBIAERERH6QEQERExAcpARAREfFBSgDknGRmZ3o7BBEROQuVvB2AlC2HTx6mTuU6xdp2/rb5XPnJlRrxT0TOWkZGBnFxcaSmpno7lHInODiYxo0bExAQcFb7KwGQHMv3LSfqvahiV+j9WvRj30P7PByViFRkcXFxVKtWjebNm2OM8XY45Ya1liNHjhAXF0dYWNhZHUOPACRHl0ZdSnQ37+/nT8NqDT0YkYhUdKmpqYSGhqryLyFjDKGhoefUcqIEQEREvEqV/9k513JTAiAiIuKDlACIiIj4ICUAIiIiPkgJgIiIlBmn3gZw11/z5s2LPOfevXvp2bMnbdu2JTw8nFdffdXzF1oG6DVAEREpM3bv3o217htbpDgd5SpVqsT48ePp1KkTiYmJREZG0rdvX9q1a+e2OMoitQCIiIhPa9CgAZ06dQKgWrVqtG3bln37nDFO1q5dy6WXXkq7du3w8/PDGMOYMWO8Ga7bqAVARETEZdeuXaxevZquXbuSmprKkCFDmDp1KlFRUTz99NOkpqby7LPPejtMt1ALgIiICJCUlMS1117LxIkTqV69OosWLaJTp05ERUUB0LFjR44ePVphxi1QAiAiIj4vIyODa6+9luHDhzNo0CAANmzYQIcOHXK2WbVqVc6jgopACYAUasqqKZiY3NnujqM7mLh0opciEhFxL2stt912G23btuWhhx7KWR4aGsq6desA2Lp1K3PmzGHo0KHeCtPt1AdACnVdu+toWqNprmVL9i7hwW8f5IHoB7wUlYhUVM2aNXNrE3uzZs2K3GbJkiVMmzaNDh06EBERAcALL7zADTfcwJdffkn79u2pU6cOM2bMIDQ01G2xeZtx5+sWZVHnzp3tihUrvB1GmZacnkxIQAh+Rg1CIlK6Nm3aRNu2bb0dRrmVX/kZY1ZaazsXta/+jy9UfbEq//zin94OQ0RESpEeAQgpT6YQ4Bfg7TBERKQUKQEQgisFezsEEREpZXoEICIi4oOUAIiIiPggJQAiIiI+SAmAiIiID1ICICIi4oOUAIiISJny8MMPM378eAAaNmxIfHw8P/74Iz169ABg5MiRTJ48GXCm701MTGTevHlcffXVAAwbNoxPPvkEoFijCqamphIVFcWFF15IeHh4hZnutygaCVBERLzmryPZRUZGsnLlylKNwVpLcnIyVatWJSMjg0suuYRXX32V6OjoUo3jbGgkQCmRtMw0TIwhISXB26GIiORy6s7eXU61BBTGGEPVqlUBZ1bAjIyMnJaDtWvXcumll9KuXTv8/PwwxlSYFgIlAD4oqFIQ7139HjWDa3o7FBGRXKpVq+bW43311VfF2i4rK4uIiAjq1atH37596dq1K6mpqQwZMoSXX36ZjRs38uSTT/LII4/w7LPPujVGb1EC4KNu63SbW2fcEhFxhwEDBrj1eMVpAQDw9/dnzZo1xMXFsWzZMjZs2MCiRYvo1KkTUVFRAHTs2JGjR49WmP93KgEQEZEyY+vWrW493qmOgcVVs2ZNevTowYIFC9iwYQMdOnTIWbdq1So6derk1vi8SQmAFOnwycMkpyd7OwwR8QHubl4fOXJkkdscOnSIY8eOAZCSksKiRYu44IILCA0NZd26dYCTmMyZM4ehQ4e6NT5vUgIgRar7Ul2u+uQqb4chIj4gJiYmJwlo3bo1W7duZeXKlURGRgIlf0Xw1PLC7N+/n549e9KxY0e6dOlC3759GTBgADfccANJSUm0b9+ekSNHMmPGDEJDQ91+zd6i1wBFRMRr8nuNTYpPrwGKiIhIiSgBEBER8UFKAERERHyQEgAREREfpARARETEBykBEBER8UFKAERERDzo2LFjvPXWWzkwJM9bAAAJ3klEQVTf4+Pjue6667wYkUMJgIiIiAf9NQFo2LAhs2fP9mJEDiUAIiLi03bt2kXbtm254447CA8Pp1+/fqSkpLBjxw4uv/xyIiMj6d69O5s3bwZgx44dREdH06VLF5555pmcqYSTkpLo3bs3nTp1okOHDsydOxeAxx9/nB07dhAREcGjjz7Krl27aN++PQBdu3YlNjY2J5YePXqwcuVKkpOTufXWW+nSpQsXXXRRzrHcylpbof8iIyOtiIiUTRs3bizxPidST9jHFj7mthh27txp/f397erVq6211g4ePNhOmzbN9urVy27dutVaa+3SpUttz549rbXWXnXVVfaTTz6x1lr79ttv2ypVqlhrrc3IyLDHjx+31lp76NAh26JFC5udnW137txpw8PDc53v1PcJEybYZ555xlprbXx8vG3VqpW11trRo0fbadOmWWutTUhIsK1atbJJSUl5Ys+v/IAVthj1o1oARESkXNlzfA/jfh3n1mOGhYUREREBQGRkJLt27eLXX39l8ODBREREcOedd7J//34AfvvtNwYPHgzAsGHDco5hreWJJ56gY8eO9OnTh3379nHw4MFCz3v99dcza9YsAD777LOc4y5cuJCxY8cSERFBjx49SE1NZc+ePW695kpuPZqIiIiHhdcLx45x7zw2QUFBOZ/9/f05ePAgNWvWZM2aNcU+xvTp0zl06BArV64kICCA5s2bk5qaWug+jRo1ypl18NNPP2XSpEmAk0x8/vnntGnT5uwuqBjUAiAiIvIX1atXJywsLOfu3FrL2rVrAYiOjubzzz8HYObMmTn7HD9+nHr16hEQEMAPP/zA7t27AWdWwsTExALPNXToUMaNG8fx48fp0KEDAP379+f111/HuibsW716tduvUQmAiIhIPqZPn86UKVO48MILCQ8Pz+mIN3HiRCZMmEBUVBT79++nRo0aAAwfPpwVK1bQuXNnpk+fzgUXXABAaGgo3bp1o3379jz66KN5znPdddcxc+ZMrr/++pxlTz/9NBkZGXTs2JH27dvz9NNPu/36NB2wiIh4TXmcDvjkyZOEhIRgjGHmzJnMmDHDM730i0HTAUuJrIhfQdS7Ud4OQ0SkXFq5ciURERF07NiRt956i/Hjx3s7pLOiToA+KCMrgwC/AG+HISJSLnXv3j2nP0B5phYAH3Rxk4tZctsSb4chIgJARX8U7SnnWm5KAERExGuCg4M5cuSIkoASstZy5MgRgoODz/oYegQgIiJe07hxY+Li4jh06JC3Qyl3goODady48VnvrwRARES8JiAggLCwMG+H4ZO88gjAGPOSMWazMWadMeY/xpiaZ6wbbYzZbozZYozpf8bySGPMete614wxxhuxi4iIVATe6gPwX6C9tbYjsBUYDWCMaQcMBcKBy4G3jDH+rn3eBkYCrVx/l5d20CIiIhWFVxIAa+1Ca22m6+tS4NRDjGuAmdbaNGvtTmA7EGWMaQBUt9b+5prpaCowsNQDFxERqSDKQh+AW4FPXZ8b4SQEp8S5lmW4Pv91eb6MMSNxWgsA0owxG9wWrRRHHeCwt4PwMSrz0qcyL30q8+JpVpyNPJYAGGMWAfXzWfWktXaua5sngUxg+qnd8tneFrI8X9baycBk1zlWFGdIRHEflXnpU5mXPpV56VOZu5fHEgBrbZ/C1htj/gkMAHrb0y+AxgFNztisMRDvWt44n+UiIiJyFrz1FsDlwP8Cf7fWnjxj1ZfAUGNMkDEmDKez3zJr7X4g0RgT7er9fxPgnZkXREREKgBv9QF4AwgC/ut6m2+ptfYua22sMeYzYCPOo4F7rbVZrn3uBj4EQoD5rr/imOzOwKVYVOalT2Ve+lTmpU9l7kYVfjpgERERyUtzAYiIiPggJQAiIiI+qMIkABpeuPQZYwYbY2KNMdnGmM5nLG9ujEkxxqxx/b1zxjqV+TkoqMxd6/Q79zBjzLPGmH1n/LavPGNdvuUv584Yc7mrXLcbYx73djwVRYVJANDwwt6wARgELM5n3Q5rbYTr764zlqvMz02+Za7feal65Yzf9jdQZPnLOXCV45vAFUA74AZXecs5qjAJgIYXLn3W2k3W2i3F3V5lfu4KKXP9zr0r3/L3ckwVRRSw3Vr7h7U2HZiJU95yjipMAvAXt3L6NcFGwN4z1p0aRrgRJRheWEoszBiz2hjzkzGmu2uZytxz9DsvPaNcjxrfN8bUci0rqPzl3KlsPaQszAVQbN4cXthXFafM87EfaGqtPWKMiQS+MMaEozIvlrMsc/3O3aSw8sd5nPI8Thk+D4zHueFQOXuOytZDylUCoOGFS19RZV7APmlAmuvzSmPMDqA1KvNiOZsyR79ztylu+Rtj3gW+cn0tqPzl3KlsPaTCPALQ8MJlhzGm7qkOUMaY83HK/A+VuUfpd14KXH0qTvkHTqdMKKD8Szu+Cmo50MoYE2aMCcTpbPmll2OqEMpVC0ARSnN4YQGMMf8AXgfqAl8bY9ZYa/sDlwLPGWMygSzgLmvtUdduKvNzUFCZ63deasYZYyJwmqB3AXcCFFH+cg6stZnGmFHAt4A/8L61NtbLYVUIGgpYRETEB1WYRwAiIiJSfEoAREREfJASABERER+kBEBERMQHKQEQERHxQUoARCSHMSbLNcvdBmPMLGNM5bM4xnunJmsxxjzxl3W/uitWETk3eg1QRHIYY5KstVVdn6cDK621E9xxPBEpW9QCICIF+RloCWCMecjVKrDBGPOAa1kVY8zXxpi1ruVDXMt/NMZ0NsaMBUJcLQrTXeuSXP9+aoy58tSJjDEfGmOuNcb4G2NeMsYsd024c2dpX7SIr6hIIwGKiJsYYyrhzL++wDWh0y1AV5yJWX43xvwEnA/EW2uvcu1T48xjWGsfN8aMstZG5HOKmcAQ4BvX8K69cUYsvA04bq3tYowJApYYYxa6ptgVETdSC4CInCnEGLMGWAHsAaYAlwD/sdYmW2uTgDlAd2A90McY829jTHdr7fESnGc+0MtVyV8BLLbWpgD9gJtcMfwOhOKMqy8ibqYWABE5U8pf79hdkwjlYa3d6moduBJ40XWn/lxxTmKtTTXG/Aj0x2kJmHHqdMB91tpvz/YCRKR41AIgIkVZDAw0xlQ2xlTBmQXvZ2NMQ+CktfZj4GWgUz77ZhhjAgo47kycRwvdcSZ6wfXv3af2Mca0dp1TRNxMLQAiUihr7SpjzIecnt72PWvtamNMf+AlY0w2kIHzDP+vJgPrjDGrrLXD/7JuITAV+NJam37q2EBzYJWr5eEQMNCtFyQigF4DFBER8Ul6BCAiIuKDlACIiIj4ICUAIiIiPkgJgIiIiA9SAiAiIuKDlACIiIj4ICUAIiIiPuj/AWbj4QrJa5LMAAAAAElFTkSuQmCC\n",
"text/plain": [
"
\n",
"\n",
"\n",
"In the next chart, we will plot the data and its corresponding confidence ellipses using 2 std and 3 std. "
]
},
{
"cell_type": "code",
"execution_count": 4,
"metadata": {},
"outputs": [
{
"data": {
"image/png": "iVBORw0KGgoAAAANSUhEUgAAAgAAAAHjCAYAAABVQKdLAAAABHNCSVQICAgIfAhkiAAAAAlwSFlzAAALEgAACxIB0t1+/AAAADl0RVh0U29mdHdhcmUAbWF0cGxvdGxpYiB2ZXJzaW9uIDMuMC4zLCBodHRwOi8vbWF0cGxvdGxpYi5vcmcvnQurowAAIABJREFUeJzs3Xd8jdcfwPHPzRSJICQ2sWdra0uMaoxaLdWWouavKC01alWLGlWqrV1FFa1W7U3sPSL2JmJGJILIvrn3/P44iMhNchOJ+X2/Xn1J7nPOeZ6bP/o9zxnfY1BKIYQQQohXi82zfgAhhBBCPH3SARBCCCFeQdIBEEIIIV5B0gEQQgghXkHSARBCCCFeQdIBEEIIIV5B0gEQQgghXkHSARBCCCFeQdIBEEIIIV5Bds/6ATJazpw5laen57N+DCGEEOIxCjBATCgYAAe3J2rt4sWLFChQgCNHjoQopdxTKv/SdwA8PT3x9fV91o8hhBBCJLTlXXj9e8hR5YmaCQgIwNPTk40bN1KnTh3s7e0vWVNPpgCEEEKIp8UYDocHg9kENf5+4uAfGhrKxx9/TGxsLN7e3tjZWf9eLx0AIYQQIqOZ4+DeebDLDM6FQJnAIXuamwsODubnn3/Gzc2NvXv34uDgkOo2pAMghBBCZLSQvXBiNBhsoHhXsE19wH7AZDKRKVMmbG1tUUphMBjS1I50AIQQQoiMcvpXOD8DPLzgjVlP3Jyvry/NmzcnS5YsfPnll2kO/vAKLAIUQgghnrqAvyFfMyjQHOyz6s+eIFiHh4fj7+9P5cqV+e2339LlEWUEQAghhEgvcRH63/CLEBMMzgXBIesTN+vr68uCBQswGAzkyZPnidsDGQEQQggh0kfsHdhQHd49BOWGpEuT69ev59KlS3z22WfUqVMnXdp8QDoAQgghxJMIOwuBG6BkT2joC7aOT9yk0WjEZDJRvHhx3N1TzOmTJtIBEEIIIdLCFA1xkXo734MtfXaZ06XpsWPH4uzszFdffZUu7VkiHQAhhBAiLc5OBRSU7guF26RLk/7+/tjZ2dG/f/9UJfVJC1kEKIQQQqTG0e8g9BCU6q2Dfzpat24du3fvxtHREVtb23Rt+3EyAiCEEEJY4/YRyF4ecnvrbH6G9HuHXrJkCa6urnz++efp1mZKZARACCGESIk5Dg71h+gQ8KgJjk92ct8DSimUUri7u5MzZ84nbs9oNFpdVkYAhBBCiKREXIKDX0HNxVB3Q7o3P3bsWHLmzEmXLl3Spb0zZ85YXVY6AEIIIcTjooN18HerDOW+eaIsfpaEhYVha2tL+/btcXFxSZc2b9y4QdmyZa0uL1MAQgghxKOUgrvHIWizDvxuldL9FuPHj2fBggXkyZOHLFmypEubXbp0wc/Pz+ryBqVUutz4eVWlShXl6+v7rB9DCCHEi+DEGHB0h2LpMyT/OD8/P1xdXSlcuDA2NjZPdJjPA0op4uLiMBgM2NnZYTAYDiqlqqRUT0YAhBBCiEAfMIZD4fbg2TrDbnPo0CHOnTuHra1tugR/gI0bN9K+fftU5w2QNQBCCCFeXUrpYf6gLeCUF7JZP4eeGjNnziRv3rx07tw5XdtVSuHt7U2lSqmfppARACGEEK8mUyysfwNiQqHC6AwJ/iaTCaUUFSpUoEyZMunattlspmHDhly9epUcOXKkur6MAAghhHi1mKLhxkbI1wS8Fqbbnn5Lhg4dSrFixejUqVO6t21jY8OECRPInz+//kApCN5pdX3pAAghhHh1KAXGe3BtNeRtBC6eGXKbwMBAnJ2d6devX7pt83vU9OnTcXFxoW3btvEfGu/CmV+sbkOmAIQQQrwagrbCvk6QyR2qTUvXVL6Pmzp1KmvWrMHNzQ0HB4d0b79Ro0bUrFkz/oPQg2CbWScsspKMAAghhHi53bugh/1zVgeXohl6Kx8fH/Lly8eIESPSbZX/o65evcoPP/zApEmTErZ/7jco0UOfVWAl6QAIIYR4OT1Y4X/rAKg4vcjPuUCG3jIkJARnZ+cMCf4AOXLkoHHjxvHtRwWCMsEbM1LdlnQAhBBCvJwO9oI8DcGzVYbf6scff6RUqVK0bp0xOQSUUowePZpPP/2Ud999N/7CjY0Qc0sfTZxK0gEQQgjxcrmxCTxqQ6mvwClfht7KaDRia2tL48aNyZUrV4beq2DBgmTPnl3/osxw9wQUbpfm9qQDIIQQ4uWhFFxeqOf6XQpn+O2GDRtG4cKF0+00P0v27NlDWFgY7do9EuzvnYdjw8BrUZoPKpIOgBBCiBefMRy2NYY6a6Habxl+u9DQUAwGAwMGDMDJySlD76WUIsG5PaEHIXulVK34t0S2AQohhHhxmWIgeBfYu0CVqWCX+ancdubMmfz777+4urpib2+fIfeIjY1lzpw5vPnmmzRs2FB/aIqFI0MhNvSJ25cRACGEEC+uyKtwYbbe4pdBefwfderUKYxGI/3798+wlf4PhIWFcfbs2fgPQv3AtTS8vSZd2pcRACGEEC+e6+vh0ADIUhTenJXmefDUOnXqFCdPnszw4L9582YcHR0ZPXo0Njb3Q7X/HLh7PN3uISMAQgghXhwxoTqpj/tbOvg/JRs3biQoKIg2bdo8lfutX7+ePHnyULp0aQj3BwxQZWK63kM6AEIIIV4cAfPBxgGKdwN716dyS6UU+fLlI3PmjF9fEBISwq1btxg7dmz8h8G7wRyb7rsapAMghBDi+Xdmol75XvLLp3rbxYsX4+fnx6hRo57K/fbt24efnx9Dhw7VhxaFHoTCbVOumAbSARBCCPH8igkFh+w6+GfQyX2WKKUIDw+nfv36VKtW7anc89SpUzRu3JjGjRvrD8IvQuB6yFUnQ+4niwCFEEI8v3a3gdt+4OEFmfM/tdsuXbqUfv36kSVLFgoUyNjzAwDu3LlD165diYmJ0Vn+Li+CbK9BhTEZdk9DguQCL6EqVaooX1/fZ/0YQgghrGU26XPtS/QAbMA2/Y/TTUp0dDQXL16kVKlSREdHZ3iSH4DAwEBy5cqFwWDQuwti78KRQVDpZ7B1THV7BoPhoFKqSkrlZARACCHE88McBwYbQIEp6qkGf4D9+/czdepUDAbDUwn+AAMHDmTz5s06+F9eBAZbqDo1TcE/NWQNgBBCiOdD7F3YWBMa7IfS/TL+fnFRELIbgrYQfGYD2w/684GXG7UaOcOpn/RhQoaMe082m82Eh4cze/ZsbG1t9TkGoQch51s6s2EGkxEAIYQQz1ZcFFxfBw5Zoe5GsM2UcfdSZgjcANtbwBJ3ODoUUIQV6MF5ly5QeyVUmawPFDr1U8Y9B7B27Vq+/PJLHfyvrYZ75/Scf+aMPcHwAekACCGEeLZib8G1VfoNOJNHxtwj+iacHAsri8PhAZCnAbx/jYvF/2LA33EUefNTBgz9AVxLgnsNqDQBLv2dMc8ChIeH07hxY6ZPn64/iLkFcfcy7H6WyBSAEEKIZ+PmTh1kq06FqpMz5h7h/nB8JFxZAgVaQPUFkKMqGAwopciVyx4vL6/EqX3ts+nkOxngzp07eHl54evrS6Z7fhAcBEU+zZB7JUdGAIQQQjxdxjCIuARulaFEBiX2ibgM+z6DdVUhcwF47yK8ORtyVgODgYCAABo0aICTkxNNmzZNXD/cHxzd0/2xoqKiyJYtG/v27SNTpkxg6wR2zul+H2tIB0AIIcTTdWUpXPoX7Jwga6n0bTvyGhzoAWsrgmNOaHoWXh+ukwndFxYWRqFChZg8eXLSh/pcWgAFP0rfZwM++ugj9uzZg7Ppuh6ZcKsIeeqn+32sIVMAQgghno4LsyBTHijSPv3bjrqh5/gv/glFOkGTUxbXEwQFBdGgQQN8fX0pUaKE5baM4XB9NVT+Nd0ez2QyoZTir7/+IkuWLBB7Wyf6eYZkBEAIIUTGignVq++zvQ5ZS6dv29EhcOhrWF1G36PxCag03mLwP3z4MLly5WLPnj3Y2SXz/ntpAbh7Qab0mwKYNWsWw4cPx9XRiGFvR7DPAvnfS7f200JGAIQQQmSsA92g+Ofpm9PebIQzv8KJMXqovtHRZFMF3717l/79+7Ny5crkE/wYw+HYMKi5NN0eNS4ujo4dOxIVFQUOLlCoFdjYp1v7aSUjAEIIIdKfUnBqgl7wV/2v9A3+N3fC2koQ6AP190K1aUkGf7PZzOzZs3FxccHHx0cvvEvOqXHgUUcvFkwHAQEB1KpVCzsbcPVrA9HBkLdhurT9pGQEQAghRPoyG/Ubro0DmGLA3jV92o0OgcNf60Q+lSZAwQ8hqUV89xmNRs6cOUNUVBQuLilk14u8Bmcnw7t+6fK4ZrMZT09Pli5ZgsHWHl77LuPyHKSBjAAIIYRIP3FR+u3cGAYle6bPPLoyw/mZsKas7kw0OQmFPko2+JtMJvr160d4eDhjx45NOfgDHBkMxT4D50JP/shK8fbbb+Pv70+u870gZD/kqJJih+VpkhEAIYQQT84Uo9/M8zeFd7ak31v/7aN6DYEyQ511etucFWxtbalUqZJ1gR90JsKb26HREUJDQwkICKBixYpJbxNMhlIKg8HAX/PmkL+AJ3iMBeeCqW4no8kIgBBCiCdnvKe3zplNkCln+rTn1xc2e0ORDlB/t1XBXylFq1atOHPmDJ988gmOjlacqBcdAvs/44BdD6pWfwdPT08aNWrETz+l7SyAkSNHMnv2bPLfmq63Jbp4ZuihQmklIwBCCCHSLvQQnP4Zqs+FatOfvD2l4Mpi8PsKcr0DjY9bPW9uNBqxt7dnwIABFCtWzOr73dvcBh+/THy9YDrjxo2jadOm/PLLL1y6dCkNj6/o0b0rtoY4cG2pM/09p56/LokQQojnX1wE3DsP2cpB2YHp0+a9C7C1ERz7Tu8ceGtOqhbNtW7dmp07d1KxYkV9wl4K7t69y/xR73Ll5CYuZf0fJ06coHnz5tjZ2bF7926qVUvdToD9+/fTtm1b3MLWkPXyz3oa5DnY7pcUg1LqWT9DhqpSpYry9fV91o8hhBAvl6vL4dYBKD/yydsyxcDJH+Hsr1C6P5T8CmwdrK4eEhJCtmzZuHPnDjly5LBq3t7Pz48vOr/P2l7BxNVcjVvRug+vnT17lurVq3Pu3DmyZ8+eTCvxlFKYTSaunNuPZ6m3wByTsccaJ8NgMBxUSlVJqZyMAAghhLBewAK4tFBnsUuP4H9jE6x5HW4fhIYHocyAVAV/gKFDh7Jq1Spy5syZYvBXSvH777/TpFF9lvd3wrXqdwmCP8C3335Lnz59rA7+UVFR1K5dm6jrO/AMHqdX+j+j4J8aMgIghBAiZXGRel9/2CmwcQTXJPLoWys6BA72gpBdUHmS3j2QSv7+/jg7O5MjR47kU/veFxkZSffu3Tl48CDbf66Im8NdqLUswQK9Q4cO0ahRI86fP4+zs/Wn9Pn7raBIpWZ6EaRNytMPGUlGAIQQQqSfwwPg8iJ9gM2TBv8rS2HNa+CUW+fuT0PwB1i+fDlbtmyxKvifPXuWN954A7PZjO+iPrhF7YG35iZanf/NN98wePBgq4N/t27d2Lt1OUXuTAJz3DMP/qkhuwCEEEIk7doqyPEGVByn3/yfREwoHPwSQvZBzUXgXiNNzRw5coSIiAi++uorq8r/999/fP7554waNYr/ffgmhs3vQN1N4JAtQTkfHx9OnDjBkiVLrH6WIV3ewqNcA3Bs9lwl+bGGdACEEEIkLey0zoz3pBn9rq2G/V2hwAfQ6DDYWT+8/ribN29y9+7dFMvFxsby9ddfs2LFCtatW0fl14rBuipQ6WfI/nqCsqGhoXTq1InZs2dblTtg4cKFXDh3ikF1zoChCRie/zn/x0kHQAghRGI7W+nc9aX7PVk7sXf1nv6grVB9/hMdCrRnzx6OHDlCt27dUix75coVPvroI3LmzMnBgwfJni0r7GihD+Ip3DZBWaUUXbt2pWXLltSrV8+qZ2lSJoSgCu9DifJp+i7PA1kDIIQQIl74Rf1v2cGQ5Qnn+gM36Ll+G0d9XO8TngiYN29eSpRI+Zm2bdtG1apVef/991m+fLlezX9sBETfhIqJs/vNnTuX06dPM2bMmBTbvnLlCi1aNCeTCqVwgVxp+h7PCxkBEEIIoZlNsOdTqPFvoiHyVDHeg0P94fpaeGMW5LHurTope/bsYd68eUydOpVChZI/qGfevHn07duXv//+G29vb/3hxfk6JW/9vYm2GPr7+9OvXz82bdqU8lHBQL6wv/m+3yfYvPZhmr/P80I6AEII8aozRcOp8XoPvvf2J1vMdnMH7GkPud7Wb/0OWZ/o0YxGIxUrViRLlizJllNKMXz4cObMmcOWLVsoW7bs/efZDn59wHsrOCV8Y4+Li6Ndu3YMGjSI119PvsPz4IyBiQPqUbZSnSf4Rs8PmQIQQohXmdmk9/fbuYAypT34m2Lg0ADY9TFUmQhvznri4H/8+HEaNmyIo6Mj5cqVS7JcTEwM7du3Z82aNezduzc++IedgZ0fQo2/IWuZRPXGjBmDk5MTvXv3TvFZDCdGMaJrNdwrdEqfI46fAzICIIQQr6roYNjSEBrshVIpB8Ek3T4Ke9qBS1F490i6BMgbN25Qrlw5/vnnn2Sz+4WGhtKiRQuyZ8/O1q1byZw5s74QHQJbG0P50ZDbO1G9/fv3M3nyZA4ePIiNTTLvwkrx04SfKO+ZFe+mbSG5si+YF+6bGAyGhgaD4YzBYDhvMBjS6QQKIYR4hZjjIGSvDtR1VqX9wBqzCU6Og83vQKk+UHNxugT/a9eu8d5772EymXB3T7q9CxcuUL16dSpXrsyiRYvig78pGna8DwU/hKKdE9ULDw+nTZs2TJkyhfz58yf/MGd+4dNqtyhX40NwsC418IviheoAGAwGW2AK8C5QBmhtMBgSj+sIIYRIWuQVODtZH73rlCdtbYQHwKa34foqaHAAirRPl0Q4e/bsIV++fOzatSvZE/327NmDl5cXX375JT/99FN8WaVgbydwygvlR1ms26dPH2rUqEHLli2TfhBlZte29Qz94yLubw4id+7cT/K1nksvVAcAqAacV0r5K6VigX+A957xMwkhxIvhznE4MhRcCus9+WkJ2EqB/xxYXxXyN4O6m8HFM10e7+7du4wZM4aoqKhE6X2bjSxHRHg4oDP7NWvWjJkzZ/L5558nbOTYd3or45t/JkrzC7B06VI2btzIxIkTk3+YS/9SzWEZLT/prI/1fQm9aGsA8gFXHvn9KvDG44UMBsNnwGcABQsWfDpPJoQQzyulIC5cZ/TzqJn2dqKDYf9nEO6vU+k+yVbBBI+n+OOPP2jXrh0rVqywWGbF0BM0O+lKjfJjmDx5Mj4+PlSoUCFhIf8/9Za/BnvBzilRG6dPn6Zr166sWrUKV9ckgrrZROjVw3TstYBF/86nfKaXM/jDizcCYKm7mug4Q6XUDKVUFaVUleTmj4QQ4pVwdRn49QX7LJCnftrauLYa1pbXyYEa7E+34A96O965c+eIiopKsowxNpbcLl1YsGABe/bsSRz8g7bA4a+hzmrI5JGoflhYGM2bN2f06NFUq1Yt6Ye5tY/sV39h8OAh2L/EwR9evA7AVaDAI7/nB64/o2cRQojnW9gZffBO/vf01ry0MMXCwa/gQHeovgAqjgXbJzwU6D6z2cyAAQMIDQ1lzJgxSb6V3717lyZNmnD16lV27NiReOHe3dOwq5V+vqylLd6nQ4cO1KpViy5duiTxMEbUjS183PNXLrh/yxtvJBpcfum8aB2AA0Bxg8FQ2GAwOACtAMvjRUII8aoL94d75/VcuG0aDqu5dx58qkPERXj3MOSqnfo2DAa4cMHiJRsbGypWrJj0cDxw+fJlvLy8KFq0KCtWrEicECjyGmxtBOV/gNx1Lbbxww8/EBgYmPy8f+RVDJf+4uv+/SlStGiKX+tl8EKtAVBKxRkMhp7AesAWmK2UOvGMH0sIIZ4vZybqxD5FO6W9jYAF+uject9CiZ5PtsK/WDG9DuERHTp0oE+fPrRq1SrJasePH+fdd9+ld+/e9OnTJ3E+gOgQ2FwPineDoh0ttrFu3TomT57MgQMHLJ/yZ4oB/z8YtTCYkiUb0rJllVR/vRfVC9UBAFBKrQHWPOvnEEKI507UDbDPCvma6fn+tIiLAN8vIXgHvL0B3Co+2TM9FviNRiP29vb07t2b0qUTD9c/sHPnTj744AN++eUXWrdunbiAMQy2vqunN8p8bbENf39/2rdvz6JFi8iXL5/lG5ljISqQNq3b4poth9Vf62Xwok0BCCGESMqJUXDDR2/Lc0xDMLtzDNZVBbMRGh588uBvQefOndmwYQMVKlTA3t5yAqKVK1fSokUL5s2bZzn4m6Jh23vgVlln+rMgMjKS5s2bM2TIEGrWtLDzwRQDfn3Ztm0rvWffxbNIcdzc3J7kq71wDEolWkT/UqlSpYry9fV91o8hhBAZ59x0yNsIMue3uPc9RUrB+d/g6FB9XG6RT9PnuVavhsaNAb2Qz8nJibCwMNzc3JJMv/vHH38wePBgli9fbnm1vtkIO1qCrRNU/wtsEicLUkrRtm1bbGxsmDt3ruVUwkpBwHyiPN7n8tXrlCxZ8om+6vPEYDAcVEqlOJfxwk0BCCGEuM9s0gHQzhmUOW3BP/YO7Psf3DsH9XaCazoFwk8+gQULHk4BjBkzhpIlS9KxY+K5esNwAyj4wekHpk2bxtatWy0HZGXWWf7MRvD6z2LwB/j11185efIku3btShz8lYJdrQkp0I/Wn81lzZpWL1XwTw0ZARBCiBeRUrDZG6pMgayl0tZGyF7Y1RryNYGK49K2UyApRiNERnIrLo7o6Gg8PDyws7NLEJC3BWyjzp91wAxsgLL3yrJ+/XrL8/VK6UWJtw/D2+vBLrPF227dupVWrVqxd+9ePD09E16832FSwXvBrQrHT57itddeS7ev/LywdgRA1gAIIcSLJniP/veteWkL/soMJ3+E7e9BpZ+hyqT0Df4A9vaQNSsrV65kwYIF2Nvbxwf/oUPB0ZFyHuVoU6YNzU41I09YHj4e/3HSi/WOfQfBO6H2yiSD/5UrV2jdujXz5s1LHPwBdrVCBe+mWadR+AdceimDf2rIFIAQQrxIzHFwahxUnQaZ86a+flQQ7PkUTBH6EB/njEmXHhwczLlz5+jQoUPii+3bYy5VEnuTPaF/hGJra8sHoz8gZ46clhs7NQEu/Qv1doBDNotFoqOj+eCDD+jduzf16tVLeNF4D+ycUZV+xpA5L2PHjqVIkSJP9gVfAjICIIQQL4K4CNjfVc9/11oCTrlS38aNjbCuEuSoCu9sTV3wNxhg/HgwmaBcOf1v06ZQqZLF4ufOnWPbtm2W2ypWDOdT/yNr2ay4u7uzdOlSJr03ie5Vu1to6Dc4OxHq+lhM8Qt60V/Pnj0pVKgQX39tYUvg4QFwZTHf/vAb/y78jzJlylheGPiKkTUAQgjxvDOG64V+V5ZAgeapX+xnjtND6P5z4K25kPud1D/Dg4BZujScOpXw2iNxJCgoiFWrVtG5c2fL7ZQty8kCHlQ+vpeatWuybt66JHcE4D8Xjg7RnZUsSWfnmz59OpMmTWLv3r0JMwVGh+iFgjaZUDaOBN64gYuLS7KZB18GsgZACCFeBlFB4FMDlAkKfpD64B9xGTbWhtCD0NAv9cHfYEiYBfDx4P8Yk8lEZGRkktf9v/oK70NHcXjdgfXz1ycd/C//B0cG6mREyQT/LVu28N1337Fs2bLEaYIv/gkBC1i/aTs9v/iCvHnzvvTBP1WUUi/1f5UrV1ZCCPHCiQ1T6soy/bMxIm1tXF6i1GIPpU78qJTZlLY2XF2VatZMKf2en/A/W9uHxW7evKm+/PJLFRcXl7C+2azUxo1KKaWOHj2q8uXLp6ZOnZr8Pa+s0M8dejjZYmfPnlUeHh5q06ZNCS9EBuq6ZrMym0wqJiZGXbx40dpv/MIDfJUV8VFGAIQQ4nlkvAvBu3SoTWLVe5JM0XCgJ/j1gaA2UOjz1I0cmEz6rf/ffyEsDFZYOHNtxQqIi3v4a9asWalZsya2to/tzb90Cby92bN7N97e3owbN47u3S3M9T8Q6MPtbR/w1vlbkL18ksVu375NkyZNGDFiBHXrPnYIUKgf3NhE0M2b1KxVCxsbG8u7Al5xsgZACCGeJ7eP6qx8VaekrX7YGdj5MWQpDm/8Do7ZYf9+qFrV+jaMRsiZEwoVgmPHEl/Plg3OnAEPDyIiIvjwww9ZuHAhLi4uFptbv349bdu2Ze7cubz77rtJ3/fmdtjREq/zweyKBvWd5fhkNBpp1KgRZcuW5Zdffom/EHkVQvZAwQ9RSmEwGLhw4QJFX5HT/R6QTIBCCPEiUUq/9buWgMJpTMXrPxcO9YXXR0Kxz/RbfGpf8tavh4YN9c+Wgj/o0/08PDCZTDg7OzN8+PAkg3/h/xUmfHk4y5Yto0aNGgmuzTg4gzhzHJ9X/ZzGv+Zkjlso7vV82PlB8usUevfujZ2dHePHj094IS4SooNRSuHt7c2MGTNeueCfGtIBEEKI50HQZjj/O3j9AznfSF1dU/T9E/y2wzubIdsTJLh5//2Uy1y7htlsxsvLi//++4+qSYwuzJgxg4B/A/j8l88TBX+AAT4DMJqNfF6sOrOz36L9DViTwiLFKVOmsHXrVnbv3o2d3f0QFh4A52dA+VGYXYphYzAwc+ZMGfZPgXQAhBDiWYq8DuHnIVddcPdKff2IS7DjA3AuDA32g/0TrnKPjk762oULULAgdyMiyGpjw+LFi8mb13IyogkTJjBp0iTO+Z2jWLFiFsvcHngb7pyAzd7kqrOINQU/SPbRNmzYwPfff8/u3bvJmjWr/lApyOSucxsYDAwcMIBKlSrRqlUrq77uq0wWAQohxLMUcUlv0TMYwNYxdXWvr4f1b0ChT8Br4ZMH/+S8+y4UKQJ2dnz88cccPHjQYvBXStFzYE+mT5/Otm3bkgz+gF7vsKUeVJqgtzgm49SpU7Rt25b//vsvPotfeABsbaRPBizQHLPZTL9+/WjWrNkTfNFXiDVbBV7k/2QboBDiuXR1lVInx6Wtrtmk1NHhSi3Jq1TQtrTdKdWWAAAgAElEQVS1EROj1NChSmXKpNRnnym1d69SFSok3uq3aJH+d+5cdfnyZRUdHa0iIyMtP1bHjmqgm5vCHbX+0Prk7x96SKnFuZUK+DfFRw0ODlZFixZVs2fPjv8w9p7eYnjnhFJKqZUrV6pu3bpZ/fVfZli5DVB2AQghxNNkjgNzDBjDICYUspVNXf2YUNjdFuLu6bd+pzypf4a4OH1YzwO2tuDkBOHh8Z9VqwY//wzVq+vUv5Mm8cWSJTRs2JDGjRsn/lpmM1/lzMnO27fptftPPqzyIU72TpbvH3pQv7lXmZrim39MTAze3t54eXkxZswY/WH0TdhcDxoeBBs7TCYTSimCg4PJkycNf4+XjGQCFEKI59G5qXDqJx24Uxv8Q/1gXRVwLaUX+6U2+BsMULGiDv7ly0PB+2cBmEx669/bb+vfbWwgMFAHf+Dc0qVcKVaMiRMn6uCvFDRvrjsMSnE7pyttW7fkQKlSbLp9m/Yb2rP7ym7LzxCyXwf/ajNSDP5KKbp06UKuXLkYNWqU/vDuSX0mQP3dYGNHYGAg1atXx2AwSPBPJekACCHE03D3JNw9DcW6QdnByZc1GuHxkcsLs2BLA6jwA1SeADb2Ca/7+SVM2ftAUJD+3GyGlSvh8GH9+ZEjcPlyfLmYGNiyRf9sNie4tmXLFnbu3JnwAJ1lyyAiAmNcHP+7c4/j506xYcMGsmXLhvpO8U6RxKv5f1/fibANtWl84SaHbQsl/zcARo4cyZkzZ5g7d65OGWwMgwOfQ1wU2DljMpnIkycPS5cuTZyASKRIOgBCCPE03PKFsJNg6wA2KWzAWrcuPnGPKRr2dYFT48F7OxT6yHKdnDmhY8fEn2fLBg4OMHiwPr0vOTly6KkAR0fYvp3TBgObN27ks88+o3Xr1vHl7ucXOMMdPvr4IyLqNWTfLr8kcwEAcHMHbe78x4fXolkTCVsubEn2URYsWMCsWbNYsWIFmZ2c4OJfYOcC72wBOyeUUtSuXZuLFy8muRNBJE86AEIIkZHOTIarK6DIp1CghXV1mjbVw+zhAbChhn7zbbAfspZOuk7BgjB7dsLPTCaIjIRvv4WxY5O/54QJcOuWPvI3OBiKFCHE05PrN25YLB4VFUUpr1JcvnOZZcuW4eSUxHw/cPPCQm6uq0WzS+FsuH9OUJ9NfTh+/LjF8rt27eLLL79k5cqV5M6dG8yxEHoA4sLBYMBoNGIwGFi0aBGFCxdO/nuJJEkHQAghMkJcJCgzeNQEtxTXYyV2fS1seAMKt4Ua/4J9lsRlunTRATtBvevw2mswYwbY2YGbG3zzTdL3sbXV7XTsCL16QY8enFy2jF8WLcLr4kXatm2bqEp4eDiNGzfmk2qfsG/DPhwdk96+uGJbL9j1MR/dgE1R+jPvAt4AlCtXLlF5f39/WrZsydy5c3mtbGk41B9MkVD5l4fbHHv37s2iRYt050CkmXQAhBAiI/j1gStL9YE2mVMxRK3McHSYHvb3WgSlvrI8tw+QNasetn9UZKRewDdihP49pWF/kwlmztRTBb/8AkqR3ds7Poue2fyw6NlbZxm1YRT169enaNGizJ07Nz4b32N6runJvYBFeF2ZygeBsO1+8K+YuyI+nXws5vm/c+cOjRs35ptvvtFnBhhsIVt5sM18/1HMxMTEMGrUKN63JmOhSJZ0AIQQIj3d3Amxt3VyG2uH/B+IuQVbG+u0wA199ehBcn76KfG8f7FiEBIC167p31eutO7e773HhQsX6NSpE7lz59YBdts2PUJw34ajG/imwzdUqVKF3377LdHCu2th19hxaQd15tTB/8QUorZ/SJNrcex8JLlgUHiQxdsbjUZatmxJ/fr16fH557CtGUQE6BGQ+wmS5s2bx5AhQ8iWLVuSHQ9hPfkLCiFEegraBDYOkLNa6uqFHoQdLaHAB1BhTOJV/sm5fRu++ALmz4d581J339hYcHRENWxIwYIF6dSpU/xqfy8vuHABpRRBQUFM/2I6A9sPZPTo0Ql3BNw3ZucYphyYQlNn+D0XNL0O+2MSlinqlvhwHqUU3bt3J1OmTEz4cZQe8Sg/Cpw9H5a5d+8ebdu2JTIyMnXfTyRJRgCEECI9HBqg89q/9l3qg//5mbClIVQcB5XGpy74g97q99df+mcfH1ixIulpA4A37h82tHw5xMZyKzgYr/nzUUrh5fXIeQS2tqjChbHpa8ObNd6kVatWiYL/t1u+pc6cOtyKvMWUA1Nom92Z3z2gsYXg/1mlz9jecXuixxk5ciSHDh3in3/+wXbne3DnmD7Q6P59Tp48SePGjbGxsSFLFgtrIUSaSCZAIYR4EnGRYJcZgrboxX6WFuslWTcKfHvqM+xrLoGspZIu27o1ZM4Ms2Yl0VacDpjWDI1Pnw6urpA7N1F16+KkFBcuXEhwdK7JbGLd+XWUtitNzTo16dOrD3379k3QjMtoFyKMEQCUcCtBk0zR9HO8TKPrcPix4A9YnPefM2cOw4cPZ/+mBbh7VtEL/h450yA0NBQ3NzciIyPJnDlzyt9NSCZAIYR4KrY2gjvHIdfbqQv+4f7gUwPiIu5v8Usm+APUrw/e3pavTZigs/tZ+0I3ciS8/z4xb71FtTJluH37doLgD3A65DRNJjahdu3aDB08NFHwB5jYYCIA/7T8h0qxZ+nneJkG1xIH/5hvYiwG/w0bNjBw4EDWrl2L+40pEOqbIPhHRUVRu3ZtwsLCJPhnABkBEEKItLixETzqgCkqdYEf4Noa2NcRygyGkl8mP1xvDWvr29vDkCHQsyfXcuYkX2wsYVFRuLomPkXw6NGjNGzYkMA3Atn+y3ZqFrK8ILHG7Bp4xV2kt9MNvK8qTsZavvXjHYDDhw9Tv359Nv39Da95tQJH9wTfIygoCA8PD2JjY5PdZigSkxEAIYTIKErBpX8gKjB1wd9sgqPfwv7PwGsxlOr1ZMH/0qXU1TcaoWRJlJsbbb28OH/pksXgv3//fspXL8+gUYNYNGoRx29aTtgDUDpsH184BlL3SuLgb8Dys12+fJkmTZowdepUXssbrY9Efux7dOnSBT8/Pwn+GUhGAIQQwlrmOPDtAeVHg2OOlMsD3LsHWbLoLX67PtEnAdb4B5zSmMTm5k292r9PH52/P1OmZIub8uXjbN3XKX3+DuzZw5HDhylZsiT29vYW8+f/ueJP+nfpz+36tzk84TBLTy/lr2N/carHqYdl6s+rj9FsZFXV97h14Cu8r8E5o75WMXdFQiNDGVZnGB0qdkjU/u3bt/Hy8uLnL16nfstekPPNBNdDQkJwcnLC0dFRtvqlkYwACCFEejJF6xz+eRsnmKdOkasrLP0F1lWG7K9D3Y1pD/4A+/ZB3776jTlTJp3nPxm3Cuei9Ly1sGcPhIQwY8YMjhw5YjH4b9myhQ6tO9Dzh57EFY8j0hjJkJpDEgT/c7fO4ePvQ+nbWwn17cvbjwT/ynkqExoVSsBXARaDf0xMDM2bN6d+/frUf68TOOZMVGb69OnMnz9fgv/ToJR6qf+rXLmyEkKIJxIXpdSqskrF3E593XPzlFqUU6mAf9J271y5lKpZM/53o1Gp3r2VAqXc3JRycdE/P/6fq2t8nchItf+nn9TF0qWTvM3GjRuVu7u72rp168PPgsKDFMNQRpPx4WcMQ33xM8p/DspzJIphqLaL2iqGoXyv+ibZvslkUq1atVJzBr6uTBf+THQ9OjpaBQQEKLPZrMxms5V/HGEJ4KusiI8yAiCEEElRCm5sBttMUG8XOGSzXM5shu7ddVKdh3XNcGQInPgG3t4AhT5OWGfJEli1KuVnaNkSwsKgYkWdq790aZ2yFyA0FMLDLddr3jz+Zycn/P74gzN371os6uPjQ+vWrVm8eDG1a9d++LmHswf7uuzDzsaOvuv70nZJW/plg17ZoM5VCIjT5eYfnw9AoWxJH/E7aODXBF6/TKt+C7HJ1zjR9R07djBmzBgMBoPFJEMi/ckYixBCJCUuHM7/BjnfAoesyZedPh3GjNFD8sYw2NUGjHf1Fr9MHgnLRkXBb7/pg3qaNEl4LThY/+voqHP9T5wIU6boz65f150Ba8yeDVev4legAMFr1tDV3R2GDk1Y5uBB1oeE0K5dO5YuXUqNGjUSXFZKUS1fNc6EnGHC3gmMzgHvZ4Xa1+BaXMKmXB1dORt6lpzOiYf1J0+ejNvNuaz5qTuOOUomusexY8fw9vbmnXfese67iXQhHQAhhHhczC04Ngwq/Qxe/6Zc3sYmfg9+2DnY/h541IbKi8H2kTn6mTPhwgX44Qc9WmBvIeNf+fI6qc/Nm3p/f506OrnPg8+s4empnyl3bmL69iUyOlqfG1ChQnyZW7dYW6UK7d3dWbZsGdWrVwfAMNxA+/Ltaft6W+rNq0e/t/oxYc94pnlAZUeoeQVuxZ8PRKXclTgRdIKwmDCyZUo8QrJiyQJmTh7JslXbyGzh6N7AwEAGDBjAqlWrLK5LEBlHOgBCCPEoUwzYZwOPWvo0utS4vh72tIPXR0Dxbomv+/nprXigD/GZP99CG9f1vw+GwV1c9El9ISEp379wYfD3B3T63DVr1tBv/HjdObGx0Z2PIkUAWL13Lx3d3VmxYgVvvhm/En92s9mM2TmGpaeX6scwG/krN3jYQt2rEP7YxjG/G34Pfy7jXibBtT179rBh5mes+fUT8hYrnehx9+/fT9WqVVm7dm3K302kO9kGKIQQD0RcgR0toME+MKRiiZRScHoCnBoPXgtTPsUvOWaznvdfujT1daOiHm4LDAoKYv/+/TQtVQratIH9+x8WW7lyJV26dGHlypVUqxZ/bsGDeHAn+g5uP7rhZIDFeSBGQasb+t+kmL41YfPI3+zC8Z180bkZX3w3//7Rvgnn9U0mEy1btmTq1KnkyZMn9d9VJEm2AQohhLXMRgjeA84FoO6G5IN/dLROy2sy6d/jomDPpxAwHxrstRz8ldIB8MERvY979IS73Llh61Y9/28NZ2f9b/fu4OTE5cuX6dixIx4eHjRt2lQfFBQQ8LD48uXL6dKlC6tXr04Q/AEyj8pMjh9zkN0pO9lswCcfBJmgZaDl4O9sr++9s+POBMH/5s2bfNPrI77t7s27jRolCv4HDx4kIiKCpUuXSvB/hqQDIIQQEZfh/HQdqB2yJ1/WZNIn7hkMUDYvTHLXHYh6u8D5/ir4DRvig96RI7BzJ9SoAcOHx7djMMCOHXD8uA7iZjNcvAgHDkDjxpDEiv0EDAY9RaAUfPMNCsh79izt27ePX0lvY/NwYeGQKUP4tNOnrF27lipVEr4ghsWEEW2K5nb0bTzHZGJrfjgQDZ2CwJTUn80YwbU+16hRMH7xYGTgAWYPqkYJr//xZoeFFustXryYY8eOpfz9RIaSDoAQ4tUVdhaOjYAsReGtP61Lq+vsrAPurX3wnQkqd4MaC/SJgA94esK0afrnkSOhbVvo2hXOnYsvs3OnPpa3bFkd7Fev1vPznp6W1wY8ysZG7zjo0UO/4Y8eTbirK7WLFSOmVCnq1KkTX7Z6dVCKxYsX8+vQXynSswiVKlXipyY5mDnz84fF6szRdQrZgU+eGBaFw1chkNIk8aKTi9gWsA0Ao9FIj96DcMlZmGHDhiUq6+/vz8mTJxk9enSiHQfi6ZNFgEKIV5M5DjLlguzlU1/3wh9weADUmA35miS+PmoUzJ0L3brBf//Ff96uXfzPjwbAmzf1vL+tbfzUQnKUgv799ahB6dLE9emDy+DB/LZiBc758+syBgOcOQMlSrBw4UJ69erFxg0bebOKXvDXbksos3Kshy66eKPijYgOPcT6vDD2NswMdwQsnOkLRA2JwtHWkXOh5yg5uSRjvcdSWN1hzfT3uXa7HjPmr7W4l//w4cOEhoZSpkwZC62Kp01GAIQQr57gXbCrld7bn/896+uZ48C3F5wcA97bLAd/gD//tP5o3h499DRBbKx1wb95c3By0lsDb97E3K0bXhUqcPnyZUqXfmSl/aRJUKAA//zzD7169UK1Vby1+q2Hlz0iFIP+vADArsu7aJAtO5vzweBbBqbchRhT4uBfq1At1HeKTHaZMBgMuDq64l3Ym6/f7M2CBUdY61uARYsWYf/Y9sawsDDWrl1LixYt6NKli3V/F5HhZARACPHqMBshPEAn9qlSLHV1Y27Bzo/Axl7vEkhprUBygoOhdm04cQKmToW//7a+7oPdAYsXc9fFBVeDgRUrVuDh8ViyoZ49+fvvv+nXrx8+Pj6UKRv/1h0dF41ZmXGyc2LO4TnM9+nEgtzQ6Sasjki649KqbKsEv+d2yY3Pe79y458KTJsRwe7dey2eLnj9+nV2796tdwOI54aMAAghXh0he+HUj3qVv1Mu6+vdOQbrq4FbZai9Om3Bf9o0Pc8P4OEBp07pufzff4c7d6xvZ+ZMvWvg/ffpUKkSu7dvTxz8gfnz59O/f398fHwoV64cNgabhyv1i04sivNoZ3qs6cGKTZ1YkAc+vAGrIyzfsmulrmxst5HuVbvHf6gU3LvAxgPXqfNNMKtXryFv3rwJ6plMJubMmUOJEiX4/vvvrf+O4qmQDoAQ4uV37zwE/KO36FWbkbq6V5bCprrw2nCo+CPYWJEcSKn4hD8TJuh8/X/9pU/yA1i0CJo2hapV4X//S76tzPcXF771lk4D3LkzQWFhREVE8Le/PzUqVkxU5c8//2TAgAH4+PhQtmzZh5+HxYRhGG7gXM9zFMtejKiz05jqAQ2vwfYoy7evnKcyv/n9xoQ9ExJeCPfn7qY2fPJJa2b8uTjBfR6IiorixIkTGB/8LcRzRToAQohXg+l+hLP2oBllhmPD4WAvqLMWCre1/l716sUf09u3L5w8qVf9d++uF/y1awcrV+otf8n5+GNYsED/vHs3ZMkCwK+//srSlStxUkofN/yIP/74gyFDhrBp0ybK/leWpguaopTi7K2zuDq68uf7fzLr0CyaqPOMyGFDnatwyPJaPwAOBh5kRasVrG5zf/QiLhIuLeTcDTOlugfw++8zqVWrVqJ6c+bMwWg0Mm7cOBwdHa36s4mnS9YACCFeXoE+ELgOKv0EWVIx528Mh73tISpQH+bjlDt19125Mv5kwLAwWLtW7/Fv104P/7u7w+XLSdevU0cnAxo5EvLl050HIDg4mPDwcEY2aIDNpk2Jqs2aNYthw4axefNmSpQowZmeZ8ieKTsb/TdSf359OlXsxLLTS+ntdJuuWaHGFTNX4hI1A0Be57xcj7iOg40D1fI9kjAoLpzwy1tp0H4A338/kvfeS7yIUilFYGAgMTHJ9CzEMycjAEKIl4/ZBDGh4F4dilnIyZ+ccH/Y8Jae539nS8rBf98+vb8/JgY6ddJb85yc4jP5deig3+TXrdPTAteuJR/8QQf/3Ll1ToAePeB+kN20aROLFy/G5ty5hNsLgRkzZjB8+PCHwR+gRI4SuDu7U39+fZzsnPjj0GxGuNymkTPUvEqSwT+3c26+f+d71HcKJ3snouOiIeoGHOjBnSg7avTcRZcu/7O4on/58uUcOXKEQYMGkTt3KjtO4qmSDoAQ4uVzdSkc/RbsnMG1uPX1bmyGDdWhWFeo9jvYWjF0XacODBum8/D/8Ufi60uW6GAdGakTAlmjTRt9KJC9Pbz9NqFTprB5zBharV5Nvz594PRpeCST3vTp0xk1ahSbN2+meHH9fcftGsfRG0cxDDfglskNZY5lWcEslHWAt69BSDI7Dj1cPDgadBSAOwPvUMg1PzjmIMatNu+935w6deowaNCgRPVen/Y6K0+t5GU/Y+ZlIYcBCSFeHpFXIfIa5KgGKk5v2bOGUnB2MpwYBdX/htx1dSKfkiV1tr7HnToFpROfbpeIyaT36+/eDT//DL6+cO9e8if7eXvDsmUQEaHLenpy6OhRVlWqxNCKFfWIg4ODzh7o6sqUKVMYN24cmzdvpsj9k/5AH+vraOtIjCmGMtk8GZs5ALOCj29A9CP/28/lnIugiKCHv09qOIlGJRpROFthncwn8jrsaEHc29v48ONWODk5MX/+fGxsEr4/Hjp0iO8XfU+/bv2oXqB6yn8bkWHkMCAhxKsn7AzcOqAX+lkb/E0xsK8LXPgd6u/RwR9g4EA9d/84sxnKlIGrV/VbvcGgV/k/8O23Ou0v6OAPUKuWHgW4fNly8K9QQf9bqRJs3AitW0OuXNzNmZPpv/9OhQoVGDptGnz3HcyerTssrq5MmjSJ8ePHs3Xr1ofBXynF1bCrgE7m82vdEUxzCeC2CT4ITBj8gQTBH8DBzoGiE4uy7dI23aHKnBfl9R/de/QkMjKSOXPmJAr+AE5OTnR8s6ME/xeILAIUQrz4rq+DiItQvDvkfsf6elFBsKM5OOWBervB3uWRNq9brmNjkzDL3/bt+kAe0HP833+vA7+Dg07vu2gRxN2fbH8801+uXDqX/+HDULgw+PnBrFl6LcH58xhjYwkLC9Mdit9/xzjsW+z/WQhduzJ58mR+/vlnrrS4wi2HW3jiCcCqs6to9k8z7g68y7++k6hy5ht2xEDv4IR5/W2xxdbWllhTLHbYEUcc7k7uVMpdCfWd0n+b7e9BvZ0MHfMbR44cYfPmzTg82N1wX1BQEJMnT2bEiBGUKlXK+r+9eOZkBEAI8eJSCqZOhLvOkMPCUH1y7hyDDW9A7nrg9V/C4P9ASql5ldLz9Q/299vb689sbWHyZB38kxMUpEcQPv9c7xL4/Xfo3JmIe/foX7w4Lr6+fN2vH4ahQwlZ+S8OjMB88gTTpk1j/PjxbN68GZOriX3X9j1ssmnJplz56gp3bh2hyeWxLI+AXsGJD/UZVmcYPav21F/z/nl/IVEhLD+1WOc+cMoF9Xczaco0/vvvP1avXo2LS+K/UebMmSlZsqTF3P/i+SZrAIQQz150tH5LthBgknXuNxjcDd69/9ZsrWtrYG8HqPwLeH5iucyZM1CqlB7yTy645cgBoaH6Z5NJjxBERED+/Cln+HNwiN8u6OICR49C4cKYTCbmzZ7Np6NGYRMUpBcYAqFRoSyet4gR3bqSe2Axdo44jqNdwoWKb/z+BrlMoUzJfIHxtxUTLTyCq70rYcYw8mbJSxb7LJwNPYu630VQg0IxHRrAXPsqOJ11pX///uzYsQNPT88EbURHR9O7d29+/PFHi+l/xbNj7RoAmQIQQjx75cvD2bPWH6ATHawT+xT+FBa01av9raEUnJkIp8ZCreXg/lbSZUuUgAsXdPBXCrZsgbp146//9ZdOzHPrFuTNq9/mba3IEgh6YeGBA/HBf9o0KFcOc5EidGjXjh8aNKDDZ5/pjoXZ/LDasgXLGPH996x3zcKb6jzHbh6jSl79//lDgYcYtGkQjqEH+D2Pol8IzL9n+fZhxjBsDbZcv3cdRxtHFIpzXX1xODkabJ05U6Q3nfqWxWO9Bxs3bkwU/AEcHR2pX78+We4nJxIvHpkCEEI8e2fOWB/8Aa6tgKsrwM7J+uBvNsKBz+HCTD3fn1zwBx34H6yqv3ED3nlHf/bllzoot22rT9wDvV7g33/1AT8pBcTXXtPtjRunf793D7p1Q9WogY1SdOjQgVwffaQPDMqeXY8wAHPnzmXo0KFs2rSJMnfCCBujHgZ/AN/rvmQJ8mFxXmgXlHTwf8CkTHqXgDkG9a2Zq1F3UG5VwMaeiIAI3Ne5s3jxYl577bVEdbt3787p06dp0aKFDP2/wGQEQAjx4rixUXcUinZOXb3YO/okP4Md1N8F9qkcss6TR9931izo0gV++gm++UYn+6lVS3cIDh/WQ/8pebB//949aNbs4bRHhw4d6NGjB3UfjDLkzPmwyt9//83AgQPZtGkTJReU5Nta3zL87eEJmr3uO4hf3M3UvwaHrUjAFzE4gkx2mQi9qxMfdTgeQM0i9fjG6SzNmjVj5syZeHl5Wazbpk2bBFsOxYtJRgCEEC8GpcAmE9hmSl29exd0Zr+sZaD2CuuCf0yM5RGJzp315/b2MGIE9O8PgYGwa5cO/o9OATw4xOdREyfqfydN0lv9li8nLi4OpRRDhgyhUqVKiar8+++/9O3bFx8fH0qXLs3hroeZ4TeDFv+00Nv9lBmTX18+dryF1xXrgj/ApH2TsIkOxufKAbzOXMFg58TYN8bSsGFDRo0aRbNmzRLV+f7771myZAleXl6S3/8lIB0AIcTz78xkODcNPLz0iX7WurkdfGpAyS/1gj8bKwc9M2WCr75KMP+ewN69erHf//4H58/Hf24yxS9kjIxMWKdoUT19EBYGX3wBq1YBMGjQIP766y9KlCiBnV3C51u8eDG9evVi/fr1lC1blin7p7A1YCs3wm+w9MxSdvhvZOUfWfE/O48aVyAgidS+DzjZOQHQ761+tCrVmCif2nRe+glFC3hjG2NLgwYN6Nq1K50sLKhUSvFGwzf4YP8Hyd9EvDBkCkAI8fyKiwQUFPwAbBxSLJ6A/59wqD9U/wvy1Etd3dBQfRCPra3lkYD7h/OwZInuCDzaUXg0KdADxYvrRYTZsoGzMyiF0WjEGBnJ4MGDcXZOvI5h2bJl9OjRg3Xr1vH6668TFhPGuVvnMJqNFM1elEymGHL5duSOGV4/G54owY8lV766wgzf39ixbwiF6v1ITMODzCu2jkaFG1F/Qn2qeFdhwIABieotXLiQw4cP8/W3XzPgbuLr4sUk2wCFEM+v4yPBPiuU/ML6OsoMR4bA5YVQexVkTSZlb0yM3up38qQ+wKdWLb26v0ABvQivTx+dEvjBQrfFi+H2bf3mnxwXFz0CYDbrpEA1a8LmzQmKTJs2jcDAQEaMGJGo+qpVq+jcuTNr1qyhcuXKgE7t2+fNPvzU4CfyjTSwNh9si9IJfsyAvY09RrPR4uNkdcxKDqccXOh1AeIiOL32HZzfmkP+HCUxmUy0aNECV1dX5s6dmyjLn8lkIqXbBX4AACAASURBVCYmhtDQUPLnz5/89xbPBdkGKIR4cd05puf7ywwEg5Vb6wDiImDPpxB9E+rvg0w5ky9vZwcBAXpOH3SO/9u3dQcgKgrmz9cdgL17dbKf3r31yvwHihbVWwUfFx6uOwFOTrp+8eJ65X9MDHH58nHjxg0+69yZuHPnElVdu3YtnTp1YtWqVQ+DP0DMkBgcRzlSI2s2dheAFeb8fBl89eH1pDoAXgW92Hl5JzGxd+HwQCj3HaX99oFfaea+P5etE7cSGxvL7NmzEwX/Y8eO0b9/f9atW0dmS2saxAtNOgBCiOfPLV9wdEvdSX6R12F7MzDlgfobwN4p5TqPD/EHB8f/XLDg/9k777Coji4Ov5cmiCB2sYu9FzDGFiu2qDFqYo9dY/k0GnuJqLHHEnvvvcTeRbGgUcTeEEQERFCRXhZ2d74/xgVWUMGYRM19n2ef3b135t7Zm8iZOXPO74Crq9Tvr5EiZbB2bThwQMYJxMbKsr3BwcbXLVVKpjZGR0PTpvJYjRrg4cG5EydYv3496xo2xPSHH4zuf/z4cbp168b+/fup6mQcEGhhZsGllrNwejSbrqGwJSoQrwFelFpSSv58bSymiik6Yaxe6B/hz77v95LfNh/E3wQTMyn1i4w/uH37Nq6urqkkfjUaDeXLl2dtWhUOVT4L1CBAFRWVjwff9fDkIBTrAQW+SX+/sBtw/Eso2AZaHISLHhm/d3BwsuiPq6vcDmjYEGbMkOcNUe9//infu3SRGQDm5km5+gA0ayZ1AcqVkwF/r9C7u+N56RL169dnzZo10LWrkfF3dXWlS5cu7Nmzh23h2zCf8loxo8c7qOwzjVmiEoUqjgZIMv4GUhp/KzMrCtoUJCTSn6JXu+OYq4RMn3xVJGn+/Pns3bs3TYnfyMhInJyciI+Px97ePsOPUuXTQJ0AqKio/PvodXLv3q482KajzG5KnhyGU85Q5TcoN1Ya1a++SrvtkiVvztW3sYF69WRQn04n0/iEgAkT5PkqVSB//mQvwapV8j0gQKoBGjhyRHoPYmKMRIEePXrErFmzEEKkcrXvPLSTjh07smvXLmrVqsXMRjN5NvwZ/hH+KJMUpizPztOznfnyYSRj7pxkhvuMdz6WOG0cG1v8jkaAfYP9YGGXdG7z5s3MnTuXY8eOkTOn8TZJZGQktra2nDt3DiurdHhRVD5Z1AmAiorKv88tF3i4BrI7gk2x9PfzWgSXe8v8/sLfv7v9wIFw547xMV9fqcpnbS2Nd48e0KSJPLdmjTT6Dx7AvHnw5Enqa06fnvzZ1FQG/nl5JeX8CyE4ePAgDg4ObN++PZVy3rlz5/j+++8ZPHswX72auGQyy0Tu33JTZH5hdhYrSO+sUN1fy7WEN6QlvsLWIlnj4FjHA9Tx/oXAgTfJaZ+cOnnkyBGGDRvGkSNHKFSokFF/IQTNmjXDx8cHOzs7VD5v1AmAiorKv0fcU0iIgNJDpa5/etHr4MoQ8F4Czu6Q88v09RMCvvhCfj58WEb8nz8PI0fKYkSWljBoEAQGws6dUvgHZF2ALVvSvuaYMbIkMMjUQRMTGSxYQsYvxMTEsHv3bmJf1wUALly4QNu2bTmx7wTju40HIM9veQiODsZCga15IbcmgLLeYQRoQeHNsrvdK3Ynb5a8AHi0mk2TrS3pl1iF/DkrIISgw64OHD91nB9++IG9e/dSrly55HEEXKDinIro9XpOnjxJ8eLF0/c8VT5p1AmAiorKv4f3Ugg6IgP+TNOZ558YDWdbQ8QdaHwBshRNXz+NBlIGtB08CMuXQ4sW8rtOJ/f3HR1lJb+OHeVxg7pf9TeUG65XT245hIfD8OFyQjF7NpQuzcaNGwFYu3Ztqlz/S5cu0bp1azZu3EijRo2Sjj+PeU7XbS04kd8EE6BVSCbK5a8FkFSxLy3W3VxHn6p9EBMScIq5wsshD1jYYkXS+e0nttOpfSe2bNlCjRrGdRAUFF4eesmBAwdUt/9/CHUCoKKi8s8TdATC70CFSVCkQ/r7xT6Bk1/JWvX1jxjta7+Te/eMSwYvWSJX7nnyyO+lSslIfUOw36FDULSonBiA3BowULiwfLezkwI/Qsi6AGZmUOuVsRYCb29vYtKIOfDw8KBly5asW7eOJobthlfs+noeO7IF80CfmfGa4mxsuxP3APc0V/8xY5Ov7Vy0PgMyv6ToXHvGahzIZlcCSzMpm/zgwQPy7s/LiuUrcHY2FkWKioqihFUJ/I770bp163c+RpXPB3UCoKKi8s+TGAnaqGSBnfQQdl1G+hduD1+sTIpmTzeVK6et6peQIMWADIF8Go1040PyO0Biihz7x49laeC5c9O81dq1a3nw4AGTJ08mj2GC8YqrV6/SokULVq9eTfPmzY07ht+i2p2fuGXtRIcfnvIgzIdW26Qmf1qr/1yzcgEw23k2j8L9+fXPJTyLDSWlwJu/vz+NGzdm+vTptGnTJtU1du7cydKlS1PJEKt8/qj/xVVUVP457kyDrOWlEc8ITw7Cnz2h2hIo1C5jfR8+lII8+fIZH/f2hv374eefZeW9+/eTzxmkfdMS+TFw6pTsl9Iz8ApLS8tUefUAN27coHnz5ixbtoyWLVsanww5TeLZtuSvu5lC6zvDpbTLCmcyzYRGp6GJQxOO+R7jmxItKHNnBDGRcCB7efZ12UUjB7mlEBISgrOzM8OGDaN79+5G10lMTMTb25uePXvyuSvCqqSNKgWsoqLy96ONkcp+UQ/AKi9YZHt3HwNeC+DuDKizB3K+YR/+bZiYyH36lFK8L15ArlzJ32/dAltb6do3eCVS/m3Mlk2K+iQmyn558shyvr6+0oMQEwPW1mz/+Wcsw8P5ZvNmoyEokxQaZG7A3bl3sWhhwaV5l5IC9oQQ3PYYT6nHS2n8KIwzcen/aWJsJMo0WypZgL+JHdvb7cC5mHTxh4eHU69ePVq3bk187Xi+K/sdjvmSlQWvXLnC1DlTGTh1YNKEQeXzIL1SwOoWgIqKyt/PtVEQsEvq8qfX+Ot1cGUw+CwH5wvvZ/xBruZf0+HHxgZSlrutUAF27ICyZaXhf31hFBYmDb+lpdQBcHGR2wAmJtCmjfQEWFlRctMmivv5yXTDFOyut5s7c+8wb948/Av4s+32NgC8XzxgxAIT7O5Pw9EnbeNvZWqFmWLsrG1WvBlNizUG1/oUMINiDm3wGfwwyfjHxsbSokUL6tWrx8SJE9l4cyP3XtwD5ITj3LlzODk5UaBrAZpvbp7qnir/DVQPgIqKyt9H+G2wsgdTK/lK755/YhS4dwR9AtTeCRZZP/zYnj5NvS3Qo4dxpgDIvf7gYFn5r3RpOHYMnJ2NfsupU6c4f+YMv0yYABcuQN26SZMILy8vGjRowKxZswgqEoSdpR1ty7bFzsKGhcss6Jg7D188eMFjrY7MZpmJ1cbimNcRz2BPo2EUsi2Ef6Q/e9vvxePmIqbdO4l+XAwPIgIplLVQUsBfQkICrVq1wt7entWrV6cSHXrx4gX9+/dny5YtmJtnMI5C5ZMgvR4AdQKgoqLy93FrsszRt2+c/j5xT8Hta8juBNUWZzzYLz1ER0svgKGUb44cxmp+KcmVK1n9b8gQuHZNZg+k+NsZFhaGn58fVapUAaTL3+d/PijhCnXr1mXKlCl0794dZZLC8hbL6VOpK8rFriTGBZP7kjt5spXCK9QrXUMXv+iIc/uGi7nakjV7BZxWOiVp++t0Ojp27IhWq2XHjh2pAvsOHz6Ms7Ozavg/c9QtABUVlX+Pxzvg5TWo8EvGjH/EfTheEwq2hS+Wfzjj7+2dvGJ/8AD27pWfDcF+KY2/pVxJY5DINRh/T08Z9X/2rCwTDNy7d4+2bdtiZ2eXZPwBnB2ceRn8koYNG2LdwJrOXTsDICYKRh/uR9TRmqCYUc07lHA9JGgT0vUzhtgBiZFY1T+A23NfnFY60bdqX3ltIejXrx9hYWFs3bo1lfHX6/Xs27eP0DdNdFT+c6gTABUVlQ+PqRWYZDDJ6Lk7uNaDChOh/LiMpQi+i7x5pVt+xgyZ779unXTn50yjXHDDhlIt8MULWfkPYOFCqFpVegyEgDlz0Ol0lCpVismTJ6eS913faD2dvunEgEED8HLwSkrhiw+7w6My9ix/fJ2vH0dw48V9mjg0ISwu7I1DL5uzLM2KNQOgU4XOoNcihKBLxS70qtyLqQ2nIoRgxIgR3Llzhz179pDJoGXwisOHD/Ps2TOWL19O3rx53/85qnxWqFsAKioqH47bU8G2VMZT9QL2wOV+UGMj5Gvy7vZvvVaALMaj1ydPIgYPlkY/Ksq4bffu8vjbKFMGOnWS1f+KFgW9nvCICBo2bIi7uzuWBo/BK54/f069evXo1KkT48aNSzounp0n+GgdXEJhny4PITEhmJuYk6hPfP2OqdhtrzD8ueCRFjpV6MSWW1uS3P4AU6dOZfv27bi5uZE9e/ZU/efOnYuzszMVKlR4571UPn3ULQAVFZV/Dl086LVQuAPkzWBK2YPFcGUQ1D/6140/SEU+kEF+Bjp2lMbf3Nw48C8t4z90qHz/4w+52r97F8aPl0WBBgwg7uhR7Ozs2L9/fyrjHxYWRuPGjfn222+NjD9+W0h0a0n3EBDF+zCq1igUlHca/6s/nKJ0ztL8+lLgp5XHgiKDKGBTIKnN4sWLWbt2LcePH09l/M+fP8/58+cZNmyYavxVUqEKAamoqPx1bk2CLMWgeO/09xF6uDFWrv6dz6df0/9d2Noap/HFx0PBgrLIz6JFMuc/R47U/bp1g/XrYeZMOHMmOU2wfXuYMgVKlkTv6UmdbdvYc/06BQsWNOoeGRlJ06ZNqV+/PlOmTOFS4CVWeq5gWdEChN+ZQz2/GO4kAFdXvnHopoopOqEjW6ZshGnCSDjdgLhwuG8w/sOCsLexT2q/adMmZsyYwblz59J07cfFZUBUQOU/x0c3AVAUxQXoA7yKvGGsEOLwq3NjgF6ADhgshDj2rwxSReVTY8MG+PrrtA3fXyHmsRT4KT8BTC3f3d6ALgEu9YRoX1nNzzKNvfgPRfHisoxv1ary++vPQFHkhOHWLSnoY1DwM6TPnT4NgYGE5shB9osXORUVha2trdElYmJi+Prrr3F0dGTOnDkoisLTCD9ahu1GsXCg/MMYQnTJ7c0wQ4s21VB1QjaqahJGn28388OpMRTN78DtTgeI0kQZGf/9+/czYsQIXF1dKVKkiNF1vLy8cHNzo1+/fhl/Xir/GT7WLYB5QojKr14G418W6ACUA5oCSxRFMf03B6mi8snQrVtqMZwPgf9OCDkFZplBSeefk8RIcGsu1QEbnHy78V+2TO69vw8vX0LNmmAwglevymp/AAMGJLcTApyc5Pm1a8HLyzh+4NkzaNCA/v37c/bs2VTGPy4ujm+++YbixYuzaNEiGRCoCaX10yV849AAU+fztKwoPSNZ09AzaFlSSgJ3rdgVU8WUwrYF6WQDw/Z3pkC24rg9diOLRRYj43/69Gl69+7NgQMHKFu2bKprWlpaki1bBtQWVf6TfHQegLfwDbBNCKEBHimK4gN8AVz8d4elovIJkNFg32nToFkzSJHaZkTwSTDLAmWGZ+y6sUHg1gxy1QbHBWDyjjl81qwyXz8twsPlij1/fuPjQkjjHRcHFy/KV5cusuxvy5ZSA8DKSlYDNHD9uiz7W7QolCxpdLnnz59jaWnJpk2bUun7JyQk0K5dO57qn3Jw+UEpuhPpDWe+hgLfQOWZCBRWXVsFQERCBIDR6v/AgwMAnH7kyvQcOg6Z2jI9sTjXhroDsPHGRqN7Xr58mfbt27Njxw6cnIzjvJ4/f87MmTOZNWsWhQ0VC1VU3sDH6gEYpCjKTUVR1iiKYpjG5gcCUrQJfHUsFYqi9FUU5YqiKFeeG3J4VVRU0s+cOTLv/U3otZCO6HUjIu7CiZpQuCM4LXqz8S9USGrsgwzeW7o07XadOkGB5GA4YmNl4J+JiZwAHDgA/fvLc5s2QefOMqf//Hlp7AEmTpTv3bvLsr8rV6ZKP1y5ciXbtm1LZfy1Wi0dO3ZEp+i4W/suv1/+nciAQ3CyjpwYVZlNnwP9MJks/8we73I81U9wspcGXAECo4K4Gg8ne17E+3/e5LbOTW7r3Pxc8+ek9nfu3KFVq1asWbOGevXqpbqejY0N1apVS6X+p6KSFv/K/yWKopxUFOV2Gq9vgKVAMaAy8BSYY+iWxqXSXNYIIVYIIZyEEE65Uhb8UFFRSR+hodA7jYA+n5XwcC3kawq566T/es/OgWt9qDgFyo1+e45/9uzSGL+LPXvkKn/7dqnjb20tI/xtbSFzZmn8d+wAgyCO4ZpNmyZfw7D/v3IlzJsnC/ssWwbIoD5vb2/GjBlD79eehU6no1u3bsTGxtLBpQOYwq3LozF1/x5qbIDifdlzb0/Syj9flnw03tSYMbXHANClnNzWuPL0CibA+QJQNWte5vV7ivl0W/oe6Jvq5/r6+tK0aVPmzp1LixYtjM4lJibSs2dPYmJiaN8+g5UWVf6zfNQ6AIqiFAEOCiHKvwoARAgx/dW5Y4CLEOKtWwCqDoCKygdArwOhg7gnYJIJMud7dx8D/rvAYwDU3Az2zh9uTPb2cn++cWNp9HfsgNy55bF3MWaM3ArYuFFOdkxMYOdOcHeH+fMBODJgAOcyZ2bab78ZddXr9fTt2xdfX18OHTqElaUl3JqE8F1HhxfWeMTE4TvEF2WSgoKSJAIEYKKY4JTPictPLgNQ2Ay+rzaCpvZlaVChOwDVVlbjatBVzE3NiR8fD8DTp0+pXbs2w4cPp7/Bq/Eahw4dolmzZurqX+XT1QFQFMU+xddvgduvPu8HOiiKkklRlKJACeDyPz0+FZX/JPfngtd8maqXEeN//3fw/AkaHM+Y8TdI975tgRIYKFP8jh6V5XlBbgO8jrk5NH+t4t20abBggYwjOHRIHmvXDubNQ6PRcPr0aZotXcq0tm2Nugkh+Omnn7h37x779+/HysIELnYl2Hst9rcfs+PJXarmrYoySeF45+NGxn/Tt5vQC32S8TcFduQzZ8Pl2TT8owfNNkm1v21tt2FmYoZGpwEgNDQUZ2dnevfunabxHzBgAFevXuXrr79Wjb9KhvgYgwBnKYpSGene9wP6AQgh7iiKsgO4C2iBgUKIdPgJVVRU3htNKOg0UHIQZCTpRujh+ih4chAau4N1BgPSChSQK/HXtwqKFJGu/jt3pFDPoEHyuEGQJzo6ucCPgcREOHxYThImT4b69eV1R40ynmBkyQIODvj/8Qe7du2inl6fSuJ3zNgxuLu74+rqShazODjVDCzzkKPFTW40iWe062jOPz7PyJojabzZuAZClz3S7W+mmHKpQX/OUJBNEQHsa9SF9rvbc/ThUUafHM2MRjPQTJDGPyoqiubNm9O8eXNGjx5t/IiFQFEUevXqRbly5TL2fFVU+AgnAEKIrm85NxWY+g8OR0Xl08fXF4oVy3gmAEDAbqnyV2pw+vvoNPBnd4gNkDn+mVJL06aJIXofZJT+kCGp2zx+DL/+Cv7+Mor/2TOoXFlW7DOQ0vhnywZhYfJ6L15A377yupUrw4gRxsO+d48tBw7QpXhxFi9enOrWU6dOZebqmXSf3x07JQiOt4TCHQh2GIj9DDucHZw54XsCAEd7xzf+TL3QcdVrG5ODXhCuhyE1fqK/U38ehT+iYp6KPI95Ti7rXPi98KPoF0XpXr87M2fOTDUZmTx5MsWLF6dz587veLAqKmmj+otUVD53smSB1q0z1uflVXh2For3TZ/xL1lSRtQnhMPppqBPgPon0m/8Qa7cUwbopYUQ0pBXrAgeHvLY9evw2uqYnj0hUyZp/C0sZGaBIQiwVSupA/CaIFBstmxce/iQhITUlfnmz5/PunXruOZ+jWV12sDJejwp3BsqTSWXdR5+rf9rkvEHaL87dSCeGfBH/kzYmUCfwBesarsLgCeRTxjtOppGDo3o/EdnNt/aTEJCAj/+8CNkhhXLVhgZfyEEOp2O3r1707Jly7c/LxWVt6BOAFRUPndy55YR8xkhIRw0L9PffsgQaPoFnKgDdhWg1g4ws8rYPR88kIqFKQkKkl4BvV4G7CmKzBKIiJAaAAavQcpVP8CaNaDRvPotCTJW4MYN+b1hQ+jTJ6mpEIKFCxei1+uZO3duqkp6K1euZP78+bi6ulJZXCCTRx9eOK6gwN6xFJxXkJDoEEbWGskvX/2S6if99MVPAFgqct/ysD4/YXpoX649dQrX4XS30/x+6XcASmQvgZgoGOQ0iC5dupDJPBMJ1xIwNzcuiTxm3hgGDR1E/vz5U4kSvS+xibHEJqYRP6HyWfPRbQGoqKj8iwTsgdgnUGpQxvp1rgt7a4KrKWz4/f1K+ZYokfqYvb3c63/0CH74AVavhl69ks9XrWq8tWFuLvf83d2hcGFp+OvUkVsHFSumeVshBPHx8aTMiDLsr2/atIlJkybhdvokuYOmwouz4OzO+Se3AAiMDKTskrJo9VpiEmOoU6gO5/zPJV1n/uX57Px2M6U8O1M3EFY99eVs97N8te4rviv7HW3LtmXd9XWsaLGCyssrc7f/Xeq0rkNoSChxd+JSGf+4uDhmhs3EpalLxp/vW8g1OxdmJmZEjI74oNdV+bhRJwAqKirSiAot5KgGtmUy1jfEDdzbQ9Ex0CDv+xn/N6EocPu2nBx06JBs/Nu0kRODa9eM25YoIav3DRsGly5BSIgsD/wGUaMFCxbQsGFDRrwWD2Ay2YSR2Ucya8wsbp13J7/fAM76nabRD6Hs8jmJxxOPpLYRmgjK5yzP7Re3k4y/Q1YHfCN8aZOrAN/t6UwhKztqFqvFYe/DHPCSyn+5zGXcwrrW6wDoXbU3AwcOJFNkJuhAqkqDV69eZcyYMYhjHz51O2ZszAe/psrHjzoBUFFRAd91EOUFlWdkrN/j7XDlf1BrG+RtAHU/8LiyZoXISKnRX7Om9ASUKyeNf0oMwX5378rvTk5QpoyM/A8LSyXva6Bw4cKpSuiGRIcw3n48y8cvp9r/cuLg1wWr/E1p0P0welMzdt/dzaOXj5La963alxVXVxhdwzfCl1HZYIDNM1xDoYZDE8xNzBEImhZvypw/51B3S/LD0v+iZ+TIkXh4eHDvwj0j175nkCfEgWNVR3bu3Pk+T1FFJU0+aiGgD4EqBKTyn2XNGrliftu/cW0sJLyETLlk4J75G3T30+LeXPCaB3UPQba03esZwlCAp18/mDVLRu5bplFh0NZWTgpSUqGC3Ov38pJZAqNHSwXAa9fk1sGtW0bPYf369VhbW9OuXTujyyiTFAqFFcJ/pT83Dywjf/AQ/PJ15LDiwBGfo1wIvMDWtlt5GPqQ8W7jGVljJLMuzjK6RiYFtMKE2lmsiTDLSvPyP1DYrjAdynfANpMtsYmxhMeHU2VZFUrlLMWlwEuM1Y9l9+7duLm5pZqQKKMU7HbYEeIVkkqOWEUlLT5ZISAVFZUPRNOmcs/8bQTuB+/lYJop/cZf6MFzKPiulml+72v8hQCtVu7Pg9Tnr1hRyvL26wcFC8qVPcgVvQGD8a9fX7bz8ZEGvmFDWLdOKgOamsKxY1IO+ObNVJMgJycnKlWqlGpIk4pNImZzDLd3jKVC2ASy19vDTbu6TDozmdWt5LPsuLsj10OuAyQZ/x+r/ph0jfUFstLSWs+Z6ChO97vFtPPT6HewH1lnZCVRl8iAQwPIPzc/ISNCONvjLFOtprJlyxZOnDiRyvg/evQIMVMQ4hXCIs9FXAq89H7PWkUlDdQJgIrK50q+fDIdLi2iHkLwKSjSASpOTv81dQlwoTOEXQXn82Bd6P3H9913MmivSBEZ1f/8OZw7J421s7Ms5xsWJicyBi/e7Nnyd4E07MuXy2wAkJOEkSOlMiDI9D+DQuArTp48ybhx4yhXrhwlXgs6vH79OkuGL+LiMmfKabdAw1Po8jbG1dcVrdASkxDDsC+H0aNSD64+vQpAzsyylPGyq8uomsmULAqElRmHa2IWAOquS3bzD/1yKOam5qxrvQ4xUU5IlixZwpIlS3B1dSXPa2PV6XT88MMPBAUFYWFhwZwLc5JUBFVUPgTqFoCKyn+R5xcg8h4U6/Xutga0sXCuHZiYyz3/jKb5vU5srHzlzJn6nCGQcMoUmDAh+biZmfQaGMiSRU4UataUk4S3/D0TQhAVFYW/vz/ly5c3Oufl5UXTRnU5O9uBgtmBr/YSoNFQaL6c4JTNVZZn0c94EfcCgEq5K3Htx2s4rXBCCMG1kGtMzwHHYk1xi9MlGXgDQ48NZf6f842Or1+/nvHjx3PmzBkcHByM2t++fZuSJUtibm6eSgBIReVdqFsAKioqqQlxg3u/Qa6aGTP+CeFwuglkygl1dv914w+yYl9axh+gaFH5ntL4g7HxBynos2ePNP4hIW+8lZeXF61atcLGxoby5csbpfydvHqSDt9+xeXpmTkbfpGReiewzI29jT1Lmi9hVqNZONo78iLuBcqroqTVC1THZLIJV4OvUiv+Gm3syzAmFNzidEz4agIWUyy49/weFwMuEh4fzoWACyROSC6fvHPnTsaMGcOJEydSGX+AhQsXcu3aNdX4q/ytqFkAKir/FfQ6sC0Nphk03nEh0vjn/goc54PyN60b/vgD2raFCxdktD9I0R9TU7k9ULIktGgBc+cm9ylQANq3h/XrpeBRGuh0OkqWLMmcOXNQFAWdXofZFDOe/vwUJUZhfF9nDgyFXFWmUSBzDRrlKkPTTU1pUqwJV4KusOX2FnpU6gGQVNzn4IODADRxaEJAyDGuPL8HwJpWa6hbpC4eTzywNLOk5pqabG6zmctPLmPy6rkdPHiQQYMGcfz4cUqXLm001rt372JjY8Py5cs/2GNVUXkTqgdAReW/QOABuDIQrPJCzurpHXokFQAAIABJREFU7xfzGE7WgYLfguPvH8b4168vI/Pj42H7dpnWd/Gi9AhUrQo//SRjA+zspHv/+XPZ78ED+Pbb5OtYWcm+OXPKvP80iI6OxsnJidjYWEq+SgU0NTHler/rWGotWfxzNVwHZ6ZAs/1Qbgx1i9Yjl3Uujj08xrw/57Hl9hb6Ve3Hjjs7KJ2jNL989QvPhz8nKDqITXmgmkUCmYt2ZFHbPZgoJthZ2uGQzYEjXY5QNFtRxERBpwqdEBMFCy4t4MjxI7Tu2Jotu7akGYR45swZPDw8Uh1XUfk7UD0AKiqfM3otxIdAvqaQ88uM9Y24K3X9ywzPWDGgd9GjB3TrBqdPw7ZtMtCvZs3U7cLD5buFhUzxA1kACORkoFs3WRnw7FmpGKgocovAVFYt1Gg0ZMmShcOHD2NtbW106RJZinJwSmkG1o8lcysPsCubdM6wUn8a9RSAPff3EKON4X7ofSafnYxZfBAKsN20IgfvnyZqTDQXAy6iF3ruPLvDpDOTuP6jzBI4+OAgdQrVwTaTLUNXDCX7/uzo2umo6lTVaDyPHz/m0aNHaZb7VVH5u1A9ACoqnzPBJ+D2ZBm4Z5nr3e0NhHqAawOoNPXDGn9IXv0HBkLt2nK1v3nzm9snJEgXv6LA1q3S2JcoIbcKAgOhbFmpF1CiRJLxF0Lg7OzM/fv3sbe3N75c1FO8lhclf84oSgdGoKQw/gYUFLRCxhs8i31mdK584DocM8GBoJsUy16cHXd24LzJGYAdd3cQHB2c1Lbl1pYceHAADw8Pch3Mxbat2xBrBdmssiW1idRE4uvny/379zP2HFVU/iLqBEBF5XMk/hkEu0K+ZlBtacb6hpwGt6/hi5VQ9I3Vud9MrVqyBDEkv7+OwXUPsmjPmTNptzO49rt1S47w37Ej+XzbtvK4paX0CgBRrVsjqlRh//79lPb0hIcPk5rrQm/wclsJHkdm53mztSxovQFlkmJktKM0UQgEWcyyYIpp0vFONmBnAm2CtFzRQNGsRfF56cNpv9OMqTWGQlkLcbTLUYKHJ19LTBSU15enZcuWzF86H2dnZ6Of9/z5c7K2y8ovvr/w448/oqLyT6JuAaiofI7EPoGXVyBvw4zt2wfug0t9oPYOyFPv/e4dECDz+h8+hOLFkxX+UnLunCzPW6CA/K4oshywoapf3rxQqZIM+Bs7FqZNk8fLlk17uyAFo83MqNesGd/Z2UGXLjB/PgwZggjYQ6xrJ9ZdceCn3z3peagnL2JfMKrmKHJmzsmYk2M4738eO0s7AKK10WSxyEJ0QjQAVW1zU6dqd/qfmYVugg7TKXJysPXW1iRvwUrPlSiKgn+EP6tareLu3bs0a9aMqXOm0vl2Z1ZFr+JUt1MA6PV6tFotvzv/zuAeH9jLoqKSDtQJgIrK50TYdQg6AuXGQPYqGevrux6uj4b6RyC7Y8bvbdh/9/dPPvZ6Xr5WK93/PXpIpb4//oAXMrfeaAIQHCxX/TodjB8PTZrIoMA3VPQDiI+PR6PRMGfTpuSSvkLwMNSbXFeGo7+9nKF/FGPhlj+xtLQkn00+rj29xgnfE1hbWDPD3bgOgpWZFcWyFmOwcoOZYTD8yTNc6zcBZmE6xZRB1QaxyGMRJXOUxDfcl/0d9tN4U2Mq5amE90tvRpUZRePGjZk9ezZdunRhwdIF5MmSLPbTpk0bJkyYwODBqvFX+ZcQQnzWL0dHR6Gi8p9Arxci/oUQQccy3vfefCH2FBQi/F7a50GIn356+zVe1RQUrq5vbtOkiWxTo4YQZ88m99m7V4j9+4VQFCGyZBGib9/kc4cOpX0trVaef/FCCCHEqlWrxNixY43bJESJncsQl383F/WqlxKhoaFJp4rMLyJKLigpcEEMOzpMXAy4KL7d9q2ovLSy6Lizo8gyCYELIibolLD51VLggrj77K5YfGmxwAWhSdSIkgtLilvBt8T++/vFKs9VQgghNBqNUIYowj6/vVi5cmWqYcfFxQm9Xi8CAgKEXq9/+zNVUXkPgCsiHfZR9QCoqHwOPL8IDxZAra1g3zj9/YSAWxPh8TZwPgfWhdNud/YslCr19mu5u8v9/zp10r6PiYmM2ge4f18W7TFQpAhUrixT+6Ki5LGSJaUeQO3aad/P1BTq10efOTP+fn707NkTnU6XfD76EZz9hkKU54fFMZxyO22ktV/IthClc5XmWewz2pVtR43VNZLONSveFNeC5nR5mkjNvUPRYUImk0wMPz6cvR32ctz3OJmmSi/DqJOjKJurLB5BHvSq2osnT54gNggcuzqyTL+MTomdyGyeOenaY8eOpUqVKnTt+h7xFSoqHxBVClhF5VMnIQzMbCEu8M0GPC2EHjyHwPPzUP8YWKYtpPNOgoKkPn9iIhw4AM2bQ926cP68jPAHGQzYtCl4eyf3q15dVu8zpPv99hv06SOr/RmoXBlu3HirxK+npyfTp09n165dyQeDT8GFTnjENqbRsL18Pa0FW3pvSTodmxhLbGIsOTPnRJmk4GTvxJWn8u/E9tr96HR+ORYKxKW4bV7rvATHBHO933WuBF3hzvM7jKg5Anub5CyDkJAQ6tatS69evfh5+M+YTjYlZmwMmc0zk5CQgEajASBz5syYmiYHGKqofEhUKWAVlf8C4bde6fObZsz46xPh4g8QdgMaur2/8b96FfLnl5+XLoWWLWVA3+XLcsWv1crvxYpJ4z9okGx7/DhcuiQL+ZQrJ48NHy4nEynx9JQTizdw8+ZNHB0d2blzpzwgBHgtggsdcWcALYcfZ+jiYRQvVtyoX8utLck1OxcddnUASDL+APlC3fj1y/5Gxh8gOCYYBYXKyysz5OgQ5v05j8DIwKTzoaGhODs707FjR0aMGIGJYoKYKJJW/xs2bGD69OnY2Nioxl/lo0D1AKiofIoIvQz4y14VdBpZzje9aOPg/PeAHmrvBLPM7+xihF4vjbvReF65+P395cq/c2dZ7W/bNinRW7q0PF6/vvQE1K4NzZpJb8Hdu7Ky35Ej8pxeLycOFhZvHcbLAQNof/s2h06exMLCQj6HKwPhxSWWvmzGgB9n43HGg0pVKmFmYpZKV3/48eHMuTgHE0wQ6PGu2YLqfx4kVJ/cplWpVuz32o+pYkpu69z8Wv9XSuYsyc/HfuZSn+TSvOHh4TRs2BBnZ2emT59udC+dTkdgYCCFChUiMTFRjlVF5W9E9QCoqHzOxPjDnanQri08e5n+fgkR4NYUzG3hq71pG39FSVbce51ffkkS2zHCx0eu6jUa6N1buv6rV5cTgxcvpPHPlEmmCC5eLGMFIiPl1kBK4w/y+pkyJccCpIG7uztZly7lxMSJ0qDGBUvhIs1LruRYyIRhaygzoAxOTk5Y/GpBu53tiNLI60VqIqm7ri577+2Vt0OPAKbeO0P0q/WQpaklAPs67ANgXJ1xPIt5RuvSraldqLaR8Y+KiqJ58+bUqFWDXyb9kmqicfnyZcaMGYOiKKrxV/moUCcAKiqfEto4eLhGuvvr7Ibdf8CTJ+nrG/8MXOtD1vJQc6NUB0yLS5ekWl9ajB6dtrjPihXQuDE8eyZL/CYkyHGlnCxoNNJL8OKFPN6xIxR+tW1hMP4gK/sBHD2a5hD0ej2LFy8myN8fGjaE0Ctw7Auwb8yd7JNo0boD036fxr0s9/AO9SZ0ZCgbWm/AdoYt/hH+xGvjOfv4LA/DH2IOPCyZjRFVe7I2LAqNAO//eROviwdAmaQQMyaGSfUnoRM6Tj46aTSWmJgYWrRoQfny5VmcfTHWM5Ilh4UQeHp6UqNGDTa/TelQReVfQp0AqKh8Sug1EO0L4lW0uxDg9E5Pn/QYnKgD+b4Gp0VvFwf64gvIkiXtc5kzJ5fqXbcORo2Sn2fPlmPJlk26/DNnllkBr/PgAWzYIPP7t26FnTuTgwANODrKa333Xaru58+fJywsjC1btlCwYEF4tBncmoHjfHytu9KkaTPmzp1Ln459GFN7DCUXlSS7VXaszK2Y3nA6hecX5rsd3+Fc1JkalpDFMhtf+EYz++qapHt4vfDCvacce7dK3bCeLo16nUJ1OP7wOBHxEfiF+xEbG0vLli1xcHBg2bJl+Az2wWugV9J1nj59yuTJk9HpdGpZX5WPEnUCoKLyKZAYCZf7g6klVPoVTDKQwRtxXxr/Ej9CpSmpVfnel6goY9GfgACp1GfwAgQHy3sZ7mcnFfaYNw9+/z05sv/evbSvnyULHDpkdMjNzQ0fHx9Z2vjaSLg5ARqe4qlZDRo1qE+bBhXp2LEjJpNNmH5+OmKivIfpZFNsLGwAOOt/lvN+JxiTXSFBE0aw1jjIsMXWFhz1Psr5HudZ3Wo1EaMjAOhTtQ+dKnRi4OGBFP2tKN988w358+dn1apVmJiYUCx7MUrmlBUHjxw5Qt68edm3b58a8Kfy0aJOAFRUPnaEALMskLcRmGQg2A/gpad0+1dwgdJD/9o4vv1W7tVv3gw5ckC/ftKQN20KY8bAiRPG7R8/lmM3ZAmYmMhJwK+/gkH9rmfPZKlgrda4f+/eSd6GGzdu4Onpyfjx46lepSScaSF/W1MPQnX5cHZ2pl3RfCzYeARFUejv1J/AoYFExEfw5SpZBfGM3xlsTeBo2fLoMaFVkCDm1RzkTDfjWgR/PvmTgYcHYmpiim0mmZbYtVJXGhRtwNImS2E73Iq+xbp161IZeI1Gw/bt24mMjPxrzzsNPvegbZV/FnUCoKLyMaONgxO1QRsNhdpmbPUecgZON4NqS6BYj78+lrg4aaSzZ4eXL6UbP08eKek7Ywb06iXPx8XJ9tleVbwLfJUqZ2oq3f2GIkAgSwLXqgXTp4PZa16N+fOlRwEIqF6dR4cOSW/GsepgUxLqHyUqwYLmzZvTpGkTnBYOTfIqLPl6CQXmFWDI0SFceiID9vbe20m0HuKzlGJCPRe0E7SYvPoT+DJOBlL6DPKhTqE6HOtyLKmkb0o0Gg3t2rUDC7hz4k4q4799+3bi4uJYt24ddgaPxwfEZLIJP+x5Q3yGikoGUZUAVVQ+VhIjZbT+l+vke0YIOiLz/GttkwWB3sWyZdKAm78hMBCMg/KEkJr+Bjp2hGrVoEyZ5Mp+YWHJ52fMkF6DHj2MAwPv3ZMeACurNG8ZEBDA2bNn6dyxI8I5J3FHv8DScR5K8V7Ex8fTunVrKlWqRGKDRNrvbs/35b+n0LxC6F7FSMxqNItjPscgPphD+U2oGWhC68u7gd2MP/0LICP+O/3RCYBLQZc453+OuRfn8nPNn43GkpCQwPfff4+1lTUJ1xMwT+NZPXjwgBo1avwtxh/g7oC7RvUEVFT+Cun2ACiKUlhRlEavPlspimLz9w1LReU/jl4r9+3jn4FtiYz1DTwAF7tB3QPpM/5CQP/+ySv1dxEQIIV+oqKS3fZ//gkFC8r9/zp1oEIFafS1Wpg6Fbp2lSp/ISGy/apVsiJgpkxvNP4gV9wx0dEwvCQ8/ZWGflHEFGqPVqulQ4cO5MqVi0WLFzGy9kgAjvoc5XDnw7h85QJAux3fkl8bTLAO2oZYodFrqZq3KgDLvl7GxK8mggJxWum1qJSnEuPqjMPzqafROBITE+nYsSMA27ZtS2X8t2/fzs2bN5kwYQKFChVK33N8D8rkKkN2q+zvbqiikg7SNQFQFKUPsAtY/upQAWDv3zUoFZX/NGE3QDGFxn9mXKEvYA9c7g11D0LOL9PXx7CtcObM29sZKFRI5vjnzp3stv/5Z2nkIyKkul+pUjJl0MwMxo2D69flRCNfPtl++nRwc3vjLSIiIpgyYQJFv2tJ37KnIOAPlKaXuTBKkNksMz179iQhIYENGzbQ/3B/Cs4rSMXcFVl3fR3lc5dn2IlhAPQo0YhRr3Yi/DQx/Fr/V24/uw2AiYkJk85O4s6AO5TNWRYTxYQVniuokrcKW9omywaPPzme7zt+j0ajYceOHVhYWKBMUqi9OrlGgZmZWZoeARWVj5n0bgEMBL4ALgEIIbwVRXlP7VAVFZU3IvQyst1pYcakfQH8d8KV/0Hdw5DTCe7cSdpDf/d9MxBcJoQ09PfuydW+Vpss8WtqKqP/Dbr8vXrJYMFq1Yyv8fDhW29hZmZGTmstJu3vg1l1aHQWzKwYcXwE51ecxyzEjDw/5qHggoKEDA8hVhvLttvbuNH/Bp5BnhS3MKN33nxMvLKWZzGZAA3tyrSje+XujD89HoC+B/oyutZoSiwsgZliRuvSrbny9Aq5rZP/tGm1WqYOncqXOb/k9JHTaPQaai6vCYB7oDsbNmzA3Nw8yTugovIpkd4JgEYIkWDIZVUUxQxQw1FVVD4kj7dDvuZQd3/G+/pthavDZFGfbJWkhn7p0u/uV6EC3L795glA9+5QooQM6CtaFMaOlSv6du1knn7WrNLIz5ol2+t0UKWKvGZionT1790LNjbpGo9Wq2XUqFGM61aB/iVWQaXlUKwPsdo4IqOD2bpsK5Gekfjf8CdYG8yTSCmCtKDpAkbUHEGXP7pQLGsRfGPDcVfCCUghJmiqmFJqUSk6VejExYCLPAp/ROlcpdELPQkigbG1x+KYzzGpvU6n47vO30Es/FnrTxptaYR7gNQHqFegHm6BblSrVo3o6Oh3P2cVlY+Q9E4AziiKMhawUhTFGRgAHPj7hqWi8h9DCIi8DzlrgHkGw2sebYLrI6HBCbArL49VrZq+vj4+0KLFm8+vXy9X9dmzS4Gg69dlbv7Jk8kxA2PHJk8ARo6Un0NCkrMBvv1WSghHRYGfH/zxxxtvZ6oIHHN4YeO9C+odhhzSc9B9b3d2btpJ1stZGbV6FHZ2dngFepEjcw7c/NyYc2EOB70PUsMSWttBHYev2epziPpF6nPa7zTFshXj0pNLNC3elMn1JlMse7Gke3bf2x0LEwsKZi2YdEyv19OrVy9CQ0JpM7kNy79djqliyppraxh+Yjienp6Msh1FmTJlUv2GmyE3qZinYvqev4rKv0i6igEpimIC9AIaAwpwDFglPoGkVLUYkMpHz63JUOh7yJqOFfvrPFwLN8dDg5OQNbUxeie1aslVehqGDCFgxAiYM0eu9ocOhQEDZJ2AmjVlVH9EROr8fYCSJaXqX8o/Ebt2SXngIUPSHMrYEYP5vtgFKpfMATU3g2VyuuC+ffvo378/Z86coUQJGRRZelFpCtgWILN5Zk54H6BSZlsux0TiZFcIj/BkgSILUwsSdAlMazAN3zBf+lfrj4liQuGshWmwoQHeod68HPUSC1Op06/X6+nbty/e3t4cPnwYa2tro3GGRIcgogUBAQFUe21rwz/Cn8LzC6P7RYfJ29QWVVT+RtJbDCi9HoBvgA1CiJV/bVgqKipJCCED8LI7gtV7pHb5rITbk6HhKbAtlf5+8fEyUC9HDqnLn1KwxiDKoyhyfHPmSPGf+Hhp9Lt2le8AoaHJ/bJkkYGBrq4ySNCw+k9Ju3ZvHtNzd5pk3UqxSj2h+jRZ3vgV586do03nNszZMIeIzBHcf36f0rlKc6XvFWISYsg7Jy+rv+hChO8mbmqs8Aj3x1wxxym/ExcDL2JhIicAo2uPxuF3B4KjgznofRCAoGFBaHSaJOPvE+rD2GFjCXoYxNGjR1MZfx8fH4YMGcLBgwfJmzdvqp9RKGuhJPVBFZWPHiHEO1/AWuAxsBH4GjBLT7+P4eXo6ChUVD5KLvcX4qnr+/V9sESIPYWEiPTOeN9mzYSAtM+BEOXKCRETI0RcnDw2eLAQ2bPLcyCEj48QDRokf3/9JYTsGxZmfO2xY4WYOVOIChWSj+n1YuH4tmLTEFshAg+mGs6NGzdE7ty5RfmfywvPJ54CF0TOmTmFEELUW1tPVJuOOHOqlwiKDBK4IGacmyGK/V5MPHr5SOCCsJ5qLRZeWigGHhoocCHFbfUiPC5cPI95bnSsQMMCwrSgqYiMjBQBEQFGY0lISBB6vV7cu3cvnQ9aReXfAbgi0mEf0+WjEkL0AIoDO4FOwENFUVb9LTMSFZXPHW2MjPYv/TPkqv3u9q/jtRDuzoRGp8GmeMb7Hz5s7Jr390/+vnQp7NsH1tayUt/27bBgAUycCJayRC4lS8q9fIBJk5Ir+u3enXwdS8tk7X8DW7fKLQND8aLEaHDvyNcOd6k34Ajk/9qo+aNHj2jevDlTZk3hts1tDvsc5niX4/j95EdYXBhnHrsRpocZV1Yz/Phwln69lNGuo3kY9pBp56fRoVwHbDPZ8r8j/2Nag2l0qdCF8Phw9ELP7nu7abSxEblm5wLkQmjo0KHYR9oTeisUy8yWFJxXkNBY6eWIiIjAycmJ+Ph4SqcnuFJF5VMgPbMEwwswB1oCfwDPM9L333qpHgCVj47LA4Tw2/5+fe/OEWKfgxDRfh9uPCDEH38IMWuW8Up+8mT53qtX8rEsWeR7ixZCODnJz5kzy+tcvCjE7NlC6HRCaDRvv2f4PXFsciHxU/uyQiTGpjodEhIiihUvJmbOnSmEECLfnHwCF8SCPxcIIYSYs6mCmLIQMfjwYJFndh5RcG5B4RfmJ0xdTAUuCJNJJqLo/KICF0TBuQXlz3RB3Ay+KZ5EPhG4IHR6nRBCrvyHDRsmHB0dRdjrXgshko49e/bsvR6viso/Den0AKTX8DcF1iG3AdYDzflEtgHUCYDKR0NMoBCal0Ikxgih12e8/50ZQuwrLkS0/4cfmxDS7e/mJt30NWokG30LC/n+zTdCfPmlSOXy79ZN9l+4UIgCBYSoXl28cYtBCCEe7xS6HTlE7K3Fwts79RZGZGSkcHR0FFYNrUS2GdmEEELcCrklZp6bKUT8CyFinghtfLjQxIaIPff2CFwQq6+uFltubhG4II77HBe4YPTSv/a8V19dnXR85MiRonLlyuLu47ti261tRu20Wq2oWrWqCAwM/EuPVkXln+RDTwC2Aa2BTOlp/zG91AmAykfDrSlC+G56z76/CnGglJxEfGi0WiEGDRJi2jT5PaVxHzxYvp8/L8SZM0KULSvEmjVyMgBC2NkJ4ecnxJMnQri+imeIjRUiMjL1fXSJQnj+LB4uyy/q1XJMZZSFECI+Pl40atRI9O3bN+n84/DHIuesnAIXxOJN5YTnmd5J7VMa+WFHhwnLKZYCF4TXcy9hMdlC4IKYfnZ6qvuExoaKPXf3iHHjxomKFSuKFy9eiJWeK43iBPz8/IROpxNxhlgIFZVPhA86AfiUX+oEQOVf5+V1+XqfVb9eL8RNFyEOlBEiNujDjuvsWSEmTBDi+vVkg29jI933S5YIUaKEEAEBQuzcKc/lyCHEqFGy76ZN8li7dkIkJgrh4iK/W1kJcexY6nst/FWIXxSRsK+OEFkQfr6+qZrodDpRsUFFQWmEVquVQ/Q7K3BBTNtaXXw1Uxr6MSfHCFwQB70OCtvptqL6iuoi7295RaIuUdhMsxEO8x3E9pvbBS6IEw9PCI02eTsiPC48yfXv4uIiypUr90bX/nfffScuXbr0Fx+yiso/T3onAG/VAVAU5bwQoraiKFEYK/8pMnxAZLBE2T+PqgOg8q/jvxsUEyj4bcb6CSFlgQP3yTz/90kVNODoCI8eyTK+BlaulBr+USnk8nLkME7vA5n7r9FIzYDNm6FAARkYmDWrPJ+QkFxFcMAA+N//jHUFnp2HM22Jf16R6stDODN1GnaviQ8JIRg8eDDXb1xn1vpZ1Cha49UJPUFRT8kX9wDHtQ24q7XEKZ8T35X9jiHHjPUEqtlXw+OpB53Ld2bz7c1Uy1eNyfUm07RE06Q2yiSFHx1/xOScCaf2n8LNzY08eYyfq5eXF7lz58bOzg4lI+WXVVQ+EtKrA/DWLAAhRO1X7zZCCNsUL5tPwfirqPyrPD0BjzZDobbvZ/yvj4YnB2Se/18x/iAj+z085OfoaHBwgObNpWzv7NnyeNmyMko/JVZWMHcurF4tBX9++AFatZJ5/yDFfSwsktsvWZJs/IWA+/PhfFtiqy7DcsAJTp50TTL+14OvJ3WbMGkCh10PE9cujtW3VuMd6k2iLpHTe7/k55UFuClysLrbNXRCR53CdZKM/9jaYwHIYZUDW0tbdn23i7lN5wLgEeRBsy3NCIkOSbqPdoIW+xv2LFm9hANHD6Qy/gA7d+7k3LlzqvFX+exJrxLgRiFE13cd+xhRPQAq/xoR9yAhHHLVyFg/IeDacAg5LeV9M+VIu110dLIhfh2NRqbihYXJlfr338OaNVKTPyBAivXMmiWle0uXhvv34eBBY1ngsmXh7l35efBgWd53/nxZ6a9NGykglCmTLA2s08l6AZUqyfaJUXCpN0T5QJ1dNG7Tj5kzZ1KlShUAHoc/psjvRdD9omPApAEsX7CcKRun8Ou1X8lmlY1M8cE804GtCYTpIeHVn6lMSiY0QmP0U80UM6zNrbEyt+Lp8KcIIXBxc2FS/Ul4vfCiVM5SuPu7U3ttbWZbz2b58uW4ubmRP39+o+t4e3sTExND5cqVM/SfS0XlYyO9HoB07aMDV1/7bgbcTU/ff/ulxgCo/OME7BPi2pj366vXC+ExWIgj1WTGwJuIi5N77uHhb24zfnxy3AEI4e+f3LdRI2EU7Gd4nTghxN69Mp3PcGzTpuS+DRvKLIHXyZdPiE6d5OfwuzJm4c9eIir8uUhMTBSRaQQF+of7C75H2NvbC/6H6LanmxBCiNiEWKH3GCTCHm4XOWbmEL4vfcWlwEtGAX+tt7YW089NF7ln50461mNvD4ELQqvTprpXtRXVRPmu5YWDg4Pw90/OolhxZYXoua+nEEKIffv2iXXr1r35eaqofCKQzhiAt0oBK4oyBjAUATLohSpAArDi/ecnKiqfIUKALg7y1Ae7Cu/RXw9XBsHLa3Llb5H1zW0tLeXe/Zs8AABTphh/37dPVvZr2FCK8eTMCdu2QZEiUtjHxka6/J2dZfnePn1g2jTpaXB0BF9fWQQLAgaCAAAgAElEQVTIwKJF0Lu3HMsTWZUP/53gMQAqz4BivZg2dixFixalT58+qYbnc80H25O2HDxxkDzF85DVMiv95ikci4XHWuhbNYHQuFBabW3F7ee3k/rpf9HzMOwhWSyyEBobym8Xf8Pnfz7ks8mHq68r7gHufFX4K6N7WV+xJvBMIBfPXqRgweSiPxamFkSFRLFt2zY6dOjw5mepovI5kp5ZAjA9Pe0+xpfqAVD5x3hyWAj3ru/XV68T4s/eQhyvJURCxIcdlxByJT9unHy/dEmIYsXkqh2EqFdPCGdnIQpKwRzx8qUQUVHyc6VKxh6CBw+Mr3n7tvysSxDiylAh9hYVItRTaLVaERoaKjQaTVJEf0quXbsmcuXKJVwNqYOvPBXuZwaIoTu/FaNPjE6Vy38j6Iaw/81edP2jq8AFMfH0xKT0PwP9D/Y3EvkRQohZs2aJYsWKGa38U3L//n2xevXq93ywKiofH3zoNEAgG/AF8JXhld6+/+ZLnQCo/O3otEJE+kgjlpBG/vu70OuF+LOPECe+EiIh6sOPz8CWLfKffIMGQixdamzYixaV7+7uQrRtK9snJspjXbtK/f9Fi5LrA6QkNkiI43WEON1ciPhQIYQQ+/fvF717907dVghx5fYVkS9fPrFz587kg2e+FaGBJ4UQQkRrolMZ/9df/fb3S3VdvV4vbgbfNBL+mT59uihevLgICAhI1T4wMFCMGzcuTT0CFZVPmfROANJVC0BRlN7AWWQZ4Emv3l0+tDdCReWT5OUVuOUiK+iZ22SsrxDg+RNE3Ia6h8D8LS799F5v6lRZvW/ECJmW9/338vjLl9CsGYweLV35KbcPihWT73fvSk1/RQEzM1k3YONGeX7gwOR6AAaenYOj1SBvI6h7AP7P3nnH53T9cfz9ZEiCJITESKyatRWl1GitWm0VNTusqp8aNapaJVSU0qrau6pUa5WgtfcWxIoZEkmIRPZ6kjz3+/vjyJNEEh5EaXvfr9d9Pfeee+45517jrO/387VzITg4mPbt2zNnzhwAxu0eh2G8sqgPDQ2lTqM6dOzfkS22W+j9SyMQYX/hDhRa1BxNNPJ/k/kb2BjUTuWBXgfY+d5OAFzzuWZ59Wpzq1F9XnWSxyRjMBjw8vJi6dKl7NmzBw8Pjyz5nZ2dqVatmm7tr/PfxZJRAnAWsAdO37uuBPxmybPP+tBXAHSeGqlJIsF/qfPHFfk5NUrkz9oixgcY8z1qmaBm7DNmiIwdK2ZZXhCpXTvzzL9nT2W8Z2+fnhYUJJLD7N2MKVXknJfI2iIiwX+akwMCAqRhw4ZiMqUvwd9NuCuHbx6W6OhoqVWrlowbN05ERDZf2iRBG2rI0N/bSIUfK8i84/NERCQmKUYWnVgk0w5Ok9d+ek3yTswreCIbLm6QvF55xXaCbbZNCo8Pl1uxt0REZMKECVKxYkUJCckqnhQVFSXvvvuurvCn86+F3FwBAJJEJAnAYDDYichF4BECkOvo/AtJvKX89EXUjPlROTcRgjfDa1sfbPCXHZqWfbrBoNpTuDAMGQL166tof5cuQatW0KED/PyzyvPZZ/DLL7BypTIMBGUc+OqrytXv0qWs5YtAAQP81RRC/oI3TkBxJbTj7+9PyZIl2bt3L1ZW6r+WU7dO4WDjgK1mi3NNZ87ZnmNPqV2sXlOP8s7FcW9/ina1h5GipTDnxBxSTal47fei76a+jNg+guCYYBJSE2hVthUejh4UyVeE8oXKs/DkwixNK5S3EEXzF2X8+PGsXLmShWsXUrRo0fuaLzg5OdG/f3/s71/N0NH5r2HJKAFYDxRALfvvAzYAWyx59lkf+gqATq6TkiDiN10Z7j0uF6aKbKwgknD70Z/duVPN1E051F+lSvps3sdH/VpbZ57537wpUqmSyIcfquvERJFdu5Tm/6lTKi07l7jgv0R+yi9y8kul7X+PlJQUadCggYSGhkqcMU5OhpwUEVER/A79KG+/87ZUbVJVfINPy8lgHxk1y17WnVosFX6sIHgiTZY2ETyR5suaZ9Lj776mu3nf32Gig4THhwueSK15tURE7ftvv7bdfP7VV19J5cqV5fbt24IncizomIiIxCfHy0DvgdKsWTMJDg5+9G+uo/MPgtxwA8wwSEiTMfM0GAy7AWfgr9wejOjo/DPQwJSk3PYMli6iZeDyHHW02Pd4Cn9Nm8Ibb4C1terOM7J2rZL8dXKC27eVUM+XXyq7ABcXJe4TEqJWEC5eVEeRImpv/7XX1ApC7dpZy9VSwHcM3FgBb3hDkabmW1fOn6eUgwMHDhzAYDDw3aHvGLF9BDJO0MZqtHuvHVcCrnDjjSu4Hn6LKhcCmNthFe+s7Urd4nUB2NB1A98f/p7IpEgCogMwjDfwQY0PWHluJS+7v8zd+LtULFyRQnmVKNK4JuMAuBF1gxbLW4DAwLiB7N26l927d+Pm5oaMS3+HW9G3mO0zm/M/nqdYsWKP/s11dP6NWDJKAFyyOWwtefZZH/oKgE6ukZoocvTjJ3PTu7pEZH0JkdiswXCyACoCX3YEBIhs2aLOGzYUGT063Wq/SBH1O39+5lk/pNsI1KihVhCMRvV744ZKX7Qo3bUvjVh/kb/qKSv/xKyBc/pVrSp70+wM7mPq1KmCGzJ/8/9EROTyjT8FTyQqMUrwRIpNKyYGT4NUmV1FrMZbiYhISEyI9FzbU5otayYT9kyQNefXCJ7IoC2D5EDAAfnxyI/mvX4RNfN/s8+bUqxcMfEPyv67tmvXTg/so/OfgdxcAQBOAiWASJQQUAHglsFguAP0ExGfXB6X6Og8f1jZQdFmkKDBse1KMOdRuPErnBkDzXbDlCVKmjdNQCc71q5Vs3GDARYtgj590u+VLAmnT6fbHpQvr6z2CxSAAQPA0xPeew9SUsDPT/0uWADe3srSv1QpsLJK1/EPDFS/X32lVgjSCFyjhH0qfw6VhqoVD4MBVq/mVsOGiAjzz5zBYDCgiYamadhYq/9WVq1axYwZM3B+H6qHLwPTd5Qv9QYyTgiJCSGPVR5ikmIQhPNh5zFgMHsLlHIuRUB0ALuu70IQRrwygjUX1lDepTyD6g0yN09EGDVqFAEnArjV4RbhhFOGMub7sbGx5M2blyVLllC4cOFH+/PS0fm3Y8koAZgHtMpw3RL4HqgPHLWkjGd16CsAOk+MponsfUsk9rq6XrxYJIcZb44ErlMW85Fn1bWvr8iCBZY9++efYhbwyUiDBmq2f+eOup+Skr7X/+GH6e10chJJTs7sAZDG0KEqzK+IyNmzIkuWiNjYiJw4pFY7NrwgEn4sc70zZ4qEhMjixYtl5syZ5uSi04oKnsgnmz+Rld4rpVwpRwnd1sfsIaFpmtyMVv74eb3yZvHtb7yksbz+0+uZ0n44/IOIiFoB2DwoUzM0TZPhw4dLrVq1JDw8PNtPN3jwYFm5cqVl31lH518CuSkElF1haWnccw18Xg99AKDzRKQZukWcejxXPxFlOLfGVeTuicdvx7FjqoMXEUlNFbG1Vf989+9XadevK0O+VatE5s1L7+hbtEjv8NPSAgLSy71wQT2Tkd6tRNZVEDnQNdvtjsTERDl+/Lj5en/Afvl8++cSkxQj+67vk2OnjolzITvJ8wEi/j+bv9vgLYPNHXusMVbye+U3XztNchI8kaWnlsrAzQPlvbVK7e/UrVMiIjLsr2ESkZAeG0HTNBk6dKjUrl1b7t5V4kNh8WEy5M8hIiISExMjd+/elcTERF3oR+c/h6UDAEstmCIMBsMog8FQ6t7xGRBpMBisgRz8kXR0/gUc6AThR6Fgzcdz9Qs7BId7QuP14FLbsmeqVoWAgMxpdeuqJX5Q0fvSlvYbNYJx45Se/4oV0LUrLF2qlvcdHGD7dvVMfLyKHXD2rDIGTOPFF6FLF3UuAteWQBsfqP4ZNFgJtlmjfl+4cIFly5aZr6/cvcKGSxtwtHOk8czGfPFRG1Z/acS2fD4MP7/PxkvejNk1hg0XN9ChYgdGNRyF4zeOxKXEkcegtiBikmMY9PIglpxawqw2s7h89zKFHApRzU3FVPiu1XcUdCh4r5lCuTbl+HPnn2zfvh2Xe+9z5e4VZhydAcCKFSuYP38+9vb2utCPjk5OWDJKAAoDM4FT946ZgCuQByhnSRnP6tBXAHQeC2OkErtJDH38mX+Er8hat0xCORZRpoyamWdH4cJKu3/MGHUdEKDc9tLw81OzfEdHdaTN+q9fTz+vUiVrucnRIge6iWyqKhJ1PtuqNU2TrVu3ZnvPL8xPCo5BerYuLV5eXqIlRQieiPt37mI/0V7ar2gveSfmlf0B+82zfhGRiIQIWe67PFMEvwMBB2Tzpc2CJxIaFypJKUny5U4l2atpmgwcOFBwRxhFlnbExcXJ2bNnzXl1dP6LkJsrACISLiKDgEYiUktEBolImIgki8jVpzIy0dF5lpweDcEbwN7t8Wb+MVdgT2uo/aNZKOeBhIVBcrI637ZNzfLvR9OUO9+8eSrS3549aoZfqxYYjWrVoFIlqFJFzfZjYyEhAVJT1QrBtWvq/Nw52L07/b3unoA/X1Kz/VbHwLlytk2Miopi+fLlGI3GLPduRtyk/D4rOjd0YfTo0QzfrSIR/vT2T6SaUvG+4k1CagKNljaiVpFafPnqlxjGG6i/qD6X715GE43qc6tz7s45Xl36Km1/bYuME9zyuRGeEI7Xfi92XtuJ1ctW+Pj4EHU+CpksWdrh4+PDTz/9hMFg0Gf+OjoPwdJYAA0MBsMF4MK96xoGg2HOU22Zjs6zIPE2JIVD7Rng0eHh+bMjIQh2t4RqnlCqi2XPuLkp3X5QFv316qnzDh1g61Z1vncv9O+vzk0m5bf/1Vdqa6BOHdXJb9qkOvi0+b6Dg7p/+jS88EK6dsCJEzBhPFycDnvaQM1v4OV5YOOQbfM2b96Mg4MDy5cvx87OLtM9CdqE/5KPOR1mQ5tRR9kfuJ/pR6fTqGQj3B3dSZVU6rnXo1XZVgCUcynHgZsH6Fy5M8GxwQREBXA06Chn75zlYvhFZJyYffgLTilI59WdQYOVk1dSMbUiW7duxdk5s3JiYmIimzZtonHjxkybNs2yb66j8x/HUhuA6UAr4C6AiPiiIgLq6Py7CPgVgtaDdZ7Hm/knhcOullB+AJTrl30eERVgRyRz2qJF6vzoUSXRC5CYmL4yUL++6rgrVYLNm1XasGHQubPq9AHat4eoKLW3P29e+jv4ZPDU3bULJnwGrxyCgFXQ6iiU7JzjK4kIW7duJSwsDICAqHv2CaYkSIlh2pLd7DyVl4jjEdjY2LDk1BIA9gfup/IctZpwNPgoW69tpWaRmqz2W83egL2svrCa+JR4vmryFY1+akT/2v3pVLlTprrdHd2Z2nwqbIKLfhc5vu84Tk5Z7RLu3LnDrl270rYsdXR0LMGSfQLuufoBpzKk+Vry7LM+dBsAHYuIv6ms9J9k3zg5WuTPOiKnPheJjxdxds4+fG5iopqfR2ewsNc0kfHjlYV/RoxGtWef9swPyi1OQkJEmjRJ39dv0kSkYkV1Hh6u3AM9PdXxyy8ioaHpZQ5qLjLXRuTkZyKm5Ae+0p49e+TGjRuZ0vBEjgcfFzn/rfz2Qz2hIMII5NO/PjXv77dZ0SbHUL5V51SVIVuGiM14G+nyexfBEzGmGEVE5LtD32WSAjaZTNKrVy+pVa+WxMRkDbWclJQkM2bMkNT7v5uOzn8YctkL4KbBYGgAiMFgyGMwGEYAfk9jQKKj80yIOgfhRx5v1g+Qmgh73wKXOlBjkhLYSUlJF9rJiL296rYzzmRTUpQ1f5s2EB4Ogwer/XorKzh/Xgn4HD6swvLeuaOW+2fNUs8WLqy2B9KC94wfr7YR4uNVmZ07qy0GzQRnPKHpOXjTG2pNASvbB76Wn58fQUFBmdKk35/UyWvPxmtl6fLlUegB5IfpR6aTzzYfnk08Wf72ctqWbwvAO5XeYcU7K8zPv1v5XWYcm0EDjwYMe2UYAHZedmii8W6Vd/mlg1r9MJlM9O7dG39/f/bt2IejY9ZQyyaTidjYWLQMwZFStdQHvpOOjo7CIBYsmRkMhsLADKA5SglwGzBERO4+3eY9OXXq1JETJ04862boPK/EXYewg1Cm5+OXoaXC/o5gkxde+QWsrB+/LINBdfhphnyOjkpxMDISmjSB6dPV3v+ePbBmjbIR6NEDrl5VWwci0Lw57Nypzu/cUVr/0dfh2AdgsIEGv4DDg/XwL126RGBgIC0yqh3KvaiHAb9z8WYCjTqMpMLAChwyHGJN5zVMOzSNa5HXqFm0Jtv9t2cqr6prVXpU68HoXaMBqFGkBr6hvsg4YeXZlTQp1QR3J3dzfpPJRK9evQgKCsLb25t8+fJlKm+j30be6vcW4RvCKVSokDm9/6b+LPBZQLH8xSiUtxBnB5x9zD8IHZ1/LgaDwUdE6jwsn6XBgMJR43wdnX8XooGW/ATPC5wYBJoRXlnzZJ1/WnkAoaGwf7/a6z9zBkaPhsaNlSeAv78yAnR1VVLBK1ZA3rzpz+7YkV6emxuc+xl21IcKg5SkrwVtjIiI4Pbt25kTj38MJd9ly5389Hl3CP09+3PV7Srrqq7j7UpvU9WtKh95f8R2/+04WDuw8M2FzDsxjwM3D3A+7Dyjd43mWN9jONg6UDR/UVynumIYb0DGCctOL6NxqcaUKViG1NRUPvjgA0JDQ9m0aRN58+bN0r7qRavToXEH8ufPnyl9gc8Cvnz1S3q/1Bvbh6xu6Oj813ngCoDBYBj7gGdFRL7O/SblLvoKgE62xF2Hy7Oh1tTHX/YH8Pserv8ELQ5kK5qTIyaT6rwPHABbWxXhLzUVjh9X92fMgKFD0zt1NzflKliwICQlKePAmjWVdT/AiBEwdao6F4ENG6BtCzg9CoK9ocEKcHv1oc2KjIzkt99+o3///mY3utvBuyharAkk3CQiKS+FKhWhRvsa+Jb2Ja9tXvLa5iU8IZxzA85RdW5Vc1nOds68X+N9Nl/ZzMe1P2Zkw5GZ6krT/b8z4g5u09yY+cZMtlzaQp71eUg2JrN27VocHLJ6JXz88ccMHjyYypWzuiueu3OO0gVKkz9P/iz3dHT+K1i6AvAwG4D4bA6APsCoJ2qhjs6zxL6ICmn7JJ3/zT/g4nfQZNOjdf6g9vZ9fVVnbW8PcXFQvXr6/cGDVYeetrfdrZvq/CMjVecPqvOvUUOde3ikP5uQAMM7wJZakBIFbXwt6vwBjEYjCQkJ5uugmCB2b2qGFnWWJJuivPn2O4zoNYLTS08T83kM0Z9HE54Qzo73dtD6l9YUz1/c/GxB+4LULV6XNZ3X8NmOz7gVewunb5yYuG8iADJO2NJ9C27T3Nj+3naGbBrCn1//CcD69euzdP5pk5UPPviAsmXLZtv+qm5V9c5fR8dSLLEUvPcPzxEYA1wHpgBulj77LA/dC0AnEwm3RXa1Stf4vx+TybJywo+LrCmcvb5/VJQKxGMJiYkqcM/UqSJt2qi0iAiRixfTLfw7dFC/5cqJLF2arvbn6ytiMEim4D6mZJH+hUV+cxG58ZtlbRCRlJQUmTRpksTHx6sEzSRyapRIktLZN5lM0qlTJ+nSpYuYMnyjY0HHBE8kJinGbOVfb0G9TFb/Rb4tIngihwMPi/V4a9l7I3OI474b+srha4clf8X80r17d0lJyf7PZsCAAbIlLQSyjo5OjpBbXgAGg8HFYDBMBM6gbAZeEpFRInLn6Q1LdHSeAlqqUvarORmssjF/6dFDCeU8jPgA2PcW1FuUvb7/4cMqdO/Nm2o2/iBiYuCnn9QMfssWlebikq4EWLUqrF+vzq2sIH9+dU9ErRiIwPXr98q6BNsaQslkeOFXKPXuw9/lHiKCvb09NjY2YDKCwQpj/goM2/45ANYNrfEP8mfZsmVYWVnx2fbPWHNhDS8vehmA+T7zAVjy5hKOhhw1l/tG2TcITQilvnt9XlnyCqljU2lcKrOEyNTGUxnWcxhdG3Xl559/Vm3IgNFoxGQyMXr0aJo1a2bxO+no6DyEB40OgKnANdRyf35LRhTP26GvAOiIiEhKgsjm6tlGtzMTEyMSFPTgcoxRSi/fb3p6Wlxc9nlB5KOPsr+XnCzSvbuK8OfvL+YQvqDC8qZr+aXP8O/3dU+biWuayKVZImsKqd9H1DL47rvv5Nq1a/fqSFLvZ4yUhScWCp5I9xHdBVfEYYyDiIgERAWYZ/dvLH9Dqs6uKngiKakpYvA0CJ5Ingl5xO+On6SaUmXg5oESGhsqLy98Wc6GqnDIC30WyqAtg4SRyEsvvSSDBg3KtLKQkXHjxsmsWbMe6Z10dP7LkEsrAMOB4qil/xCDwRBz74g1GAwxT3NgoqOTaxjvKonb17c/eK/e0RHc3XO+r6XAgc7g1gQqDlFpvr5qVg6qq47J8M9C02D+/KzlhIUp5b6VK1WeNFnbjz5SvytWwKpV6fmnTYMhQ9KjAS5dqrT/ra1htpeKOeC/DFochAoDH9muoVixYjg55uP86WkU/s6dm/VWEpAQTb9N/ZhcdDLeP3lDD3B1cQUgxZTCS8VeAmBjt42cCzvH2QFnab2yNSf7nwQgWUvmxTkvYm1lzcgGI4lMiuRs6FlijbEA7PTfyd07d3lh4wu0bNmSGTNmYGWV+b+jpKQkwsPDGTVqFB+lfRsdHZ1c44FugCJiqVCQjs7ziWiwuzU0WgP5Sj5BOQInPlF+9LV/SO9kq1dP7/S/+AImT1Z569VTg4OkpKxlubkpy3+At95S+v2g/PjTfP/t7eHVV6FMGRg+XNW3erXK17s3BAbC0R/h9Kdw+23o4q1EfUwmtVVgwSBg1apVODk50bVrV4Zt6sOIPDeJS4rgljGRCvlKQCB4TvfE1MPEwOYDmdVWCQ9NPTSVk7dOkvpVKgHRShY4VUtl9/XdlHAqwehXR5PPNh8tyrYgICqA0jNKU7tobRJTE2mwpAEyTvi23rc0b96cIvWLMMV+Ct8YvsnUtjG7xpByMgXrCGsmTZqE721fas6vaY4RoKOj8+RYJAT0T0Z3A/wPE+0HjuXVIMA6G0W+R8FvGlxffs/dL6siHaBm8yaT6txv31bW+sWLq069cOF0ZcA9e5TW/61bys//jz+U33///ukrAklJamDxxx9qYJAvn7pfogT06gzNQ8ApHGZrsPVqurugwQAtW6YHEHoAx48fx9kmmvKJy7Ha/jN3RtzBNZ+a5fv7+9OwYUNmzJ1BF98u2FnZ0aJsC1wcXAiMDqRo/qKsOr+KCU0mMHZvZm/hdyu/S1HHosx4YwYmzcT6i+vpVLkT0UnRLPBZQMdiHanVoBYjPh3BubLn+P3878g4wTDewLG+x6hSsAp1p9RlULtB9HupH9bW1kQmRvLDkR8Y/9r4J/lT1NH5T2CpG+Az36N/2oduA/Af5mAPkbsnn7ycgDUi6z1UvIBHpWtXyWSlP2+e2qNP29tfvVr9Fiwo8vrrItu2qXxDhohMmSIyeLDIW2+lPx+0SWQmIqtai9ghcuhQ5vrCwnK2SbjH8ePHxctrokjiHRFTqsjt3ZnuR0ZGSsVKFaX5J80lMCpQmi1rZt7zd5zkKHgidxPuysDNAwVPJDg6WGrNqyVvrnxT8ERC40Kzr1hE/Pz8xMPDQ2iLHAw8KMmpyXIyRP0Zjd4xWkLjQuXAgQMyZMiQh35aHR2d7MFCGwB9BUDn30fYQTXzt3d78rLuHoc9beG1v8DlpQfnXbFCCfgcO5b13pgxSqt/zRol+JPR0r1IEbUCAFCyJAQEqJm8iwu8/76S/02OhpOfwoW1UGcBVHtXrQiMHq22CR6B8PBwbpxcS508G6HpZnP6Or91pKak0qVDF3AFWkMp51LmZf4eVXuw4twKCjsU5odWPzDr+CwO9z0MpIv6ABzpc4S67nWxMliRqqVic8/j4syZM7zxxhtMnjyZqIpRdKrcieKO6boB8fHxbNu2jQ4dHjMMs46ODpB7QkA6Ov88wg5A7JUH5+neXQXeeRBJYUrj/+UFD+/8QS3316qVfm0wKDsAgNmzVecP0LAhdOyoznv1UqGBb9+GypUhTfxGBO7eVZ3/rW2wpRpY2cH/YiCyqCp7wYJH6vxDQ0MZOaAjBRP2U6dlf2j8R6b7K86sYOTQkRTIX4C6vesCcG3wNe4MVx6/f1xS+U1iYvTO0RwJPkLaBELGCaaxJvwG+lF/cX18QlT4YduvbTGMN3D4yGGzsd/777/PkL+GcDDwoLnuyQcm03BWQ44dO8a/fVKio/O8oA8AdP49hGxVEf0qjwLXhg/O26MHfPhhzve1VDjYFcq8ByXetqz+116DefNg7Fhlpf/++5AWqCYyUu3v9+unfP5//12lL12qrPx37oSLF9XAJM2ALzES+hhgdw+otxh+MkDIXRUUKAM7/XdmmoHnROFChejwZmusjapDf/O3jpwJPWO+/8rNV4i7HkdU2yhmt52NjBNijDFcjbzK+9Xfp1DeQhSwL0BkUiQ3Y28C8LPvzxwNOkr5meWxnmDNi7Nf5FjfY9R1VwOI0OGhDCs+jLfefIuFCxfSuXNnQA0YOldR57GxsVz94yrv1H2Hb775xixBrKOj85SxZJ/gn3zoNgD/IYK3iNw5mDtlnfpcZGdzkfNnRXbtsvy5tP39jHoC48aJ9OmTOU8aXl7p9gC2tiJFi6rzyohMR6QfIsvmqrwgcuqUOl+3TqR3bxERiTPGyYaLG3JskslkkrmfN5aofYNERORG5A3BEyk3o5zs9N8pIiJTFk4RK2crCQwMlOWnl0tCcoJomiYT904UPJUNQ6EphcRhooP8ceEP8fjeQ1776TXpubanLPRRegGBUYESnZRZZ2H79u1SuHBh2bZtm3y4/kPp/UfvLO1LSEiQH3/8MUcdAB0dnUcDC20AnnkH/bQPfQDwHyB0r8iV+aUp6JwAACAASURBVLlXXuA6kfUlRRLDRPr3F7G3f/yyjMb0Dv7MGSUABCKTJqXnSUwU6dxZpdsh8nMzZeg3qJFItWrZl7tiRbp08AP46ch3khDjL/t2bJSU2GCZdnCaJCQnyA+Hf1BVpyTKiRMnpIBLASk5oqRomianbqlBxssLXjYb/+32320+b7K0ieCJrPdbL9uubjMPEO7H29tbXF1dZd++fSIisshnkSw5ucR8PykpSXr16iWRkZEiIjJp3yRxm+r20HfS0dF5MM/1AADoDJwHNKDOffdGA1eBS0CrDOm1gbP37v3IPRfGhx36AOA/QKy/GgTkBtGXRNa4ioQdtSy/pj1Yec9kUlr+GVcR0gYEJpPIvn0ir7yiroO2iPxWXGRfNxFjhPIISEp6otf5dDCyc0VXERFJMaUInsiRm0dE0zRZemqp8Cni7u4uXvO9Mun3nww5KVGJUTJp3yTBE+mwqoP5nu0EW3P580/MFzyRt1e9nane33//Xdzc3OTo0ey/o6ZpommaeHt7i3bv+525fUZmHp35RO+ro6Pz/A8AXgQqAnsyDgCAyoAvYAeUQckQW9+7dwx4BTAAfwKtLalLHwD8i4k6L3L8k9wrLzlWZFOVR1tNKFdOpECBzGlGo8hnn6V39M7OIoMGicyeLbJzZ3oAn8hIkR07RNq8IrKvk8iGF9Q2Rhog4ukpEv0A+eKcuLJAJOywnPH1lTt37mS6hSey/PRyiYqOEoogjfo0koTkBLkZfVMMngaznO/1yOuSkJwgL856UVy/dZWyM8qaBwGZqrp7RcLjw83Xy5Ytk2LFiomvr2+2TdM0Tdq1a5cuP/wvZdXZVbLL/xG2j3R0connegBgrjzrAGA0MDrD9dZ7nX4x4GKG9G7AfEvq0AcA/2JSEkRC9+deeUf6ihx6/9G09ENDRUJC1HnaEn+tWuqfVvHiIvnzK1/9mTNF7OxEChUSKVxY3U8xiizuJPK7i4jvV+p97gdEVq2yvD3JMSKaJic2fys/TBysivBE1l1YJzv9d8qo7aNkwp4JwlikRZsW0qFbB7l295p8sP4Dc+f+yaZPzOc159WUrVe2Cp7Ia0tfk61Xt0pkYqS5uqjEqEzVz5s3Tzw8PMTPzy/b5hmNRhEROXfunHnmLyJS/NvigicSnxxv+bs+51SfW10GbRn0rJuh8x/E0gHA8+YF4A7czHAddC/N/d75/ek6/0WSwmFXKxXRz8I494BS6TMYlHvd/QRvgts7oM7MR9PSNxggJESp/FWvrmR769dXVv0dOyrd/5MnYdAg+OQTVXeVKjD8TfCuAVfXwKWuUH2CildwPyLQpYvl7TnQBSJOULZBP15r3weAb5p9Q6XClWj2czPm+8xn7J6xtLvZju3ntxPRLIKyM8uyzHcZprEm+r7Ul7NhZ3m74tvMaDWDgMgAWpZrSZNSTZjTdg4ty7akgH0BAG5E3aDAlAJpg3KmT5/O5MmT2bNnD5XSohneR9euXTl48CBVqlTJZO0fkhACwCdbPrH8XZ9zfD/25cfWPz7rZujo5Iwlo4THOYAdwLlsjrcy5NlD5hWA2UDPDNeLgY5AXWBHhvRGgPcD6v4IOAGcKFmy5NMYYOk8K7R7luIRpx/v+fbt1RJ9RhLviKwr9nh2BCNGpC/1x8er31u3RCIi1Pnt2yKOjsqQEESG9BE50kfVd32lyKKFkkkp8IcflM3Axo2Wt0EziVyeK5KaJMGBV6VTp06Sel/kwKjEKPOs/ttZ30rJMiWl7cK2gifS8ueWUnRqUcET+WLHFzJx70QRkUzL/Xgi/b37Z6k6OTVZNE2TsWPHSvny5SUwMDDbJkZEREhKSoqEh4dnmvlnJDAqUBwnOVr+3jo6OtnCs14BEJHmIlI1m2PDAx4LAkpkuPYAQu6le2STnlPdC0SkjojUcXV1fZLX0Hme0FJVvPvE21CwxuOVsXGj0uNPQwSOfwyle4Bb45yfy4mpU+HIEXU+YgTUqaP8+V1cVNmOjmBnp7T9W9lDtV/A2gHa+oF7J/A5CZcvp5c3dKgK9JOcrGIIFCiglANzQjTAoESLUuMo6l6GTz/9FGtr60zZqs2thoONAwTAN+O+4a/Nf3E9+Tp1itVhm/829vfaD8CkA5OYeWwm3x36jh7VeqCN1UjVVP1brmwxz/bTsDZYM2jQIDZu3MiBAwcoUaJEpvu7r++myU9NGD9+PGvWrKFQoUI5+vlbGawo61LWgo+uo6OTK1gySnhaB1lXAKqQ2QjQn3QjwONAfdKNANtYUoduA/AvIfWeNXxcQO6W6/+zyKaqIqmJj/bcqVMiu3crvf6LF0U++EDN5OfOVTYEKSkq39ChIh6IfIXI14iURrnvubmJREXdswW4l3fkSFVeGomJavUgJ5uE5GiRLbVEUhLEZDJJp06dcpyBi4is3LdSyI/UGF4jU3qNuTUk1hgre67vEd9bvpm8AfYHKBsL+4n2gieZZu/JycnSrVs3ady4sURFZbYFSGPtsbXSdFZTSU5OznHmr6Ojk7vwrFcAHoTBYOhgMBiCUAZ+mw0Gw1YAETkP/A5cAP4CBoqI6d5jA4BFKDfAa6hBgM5/hQOdlcrfk4T0vZ+kO3ByGDRYDtb2j/bst98qNcFRo6BSJVi2TMn53rqlwvHa2EBKHLxvC18ZwLYJrK4KMS5K3vePP1TUP5H0uACaBhln7vb2KiLg/TNmUzKE7gFbJ2iyEWwcCIwJ5NUur+Lunr1pTExMDN07dsftDTd8HX1Zc2GN+d6YxmOovaA2lQpXosb8GmhjNea0mYO7ozuzj82m2c/NMKYaVcS+e21JSEjg7bffJjY2lr/++gtnZ+ds673jc4eO0hFbW1td4U9H5zlDDwak83yTEquWzFPjwNb50Qz0HsaxAarjrz3d8meCglRIXpNJdfRFiijDvthYtVQfFQWzZkKrwhAzG1wawLhLULgsfP+9kgguV+7J2h1/E86OU/LABgNjx47lisMVViWvQsapkX3GztZkMtG+fXsKFi3IypIr0cZp5vsiwo5rO1h/aT1Tmk+h1S+tONTnEAUmFyDaGM35/52noH1BYowxVCxcEQDD5waKehflxXIvcuClAySPS87SxNu3bxMQEEC9evWe7F11dHQeGUuDAdk8LIOOzjPlvBc4VoSyvXK33KjzcHMttLto+TPr1inL/m3bVOd/5446KlSAvHlVnp6toPh2OGsNpcdDky/UzB6efPASfgRu/Ap1ZkD9Jebknj174ubmxq8FfuVM6BlqzKuBjEsf2I8YMQJjspGmHzeleFRxQuNDSTGlUMK5BNYTrBGEpqWa4mjnyKE+h7h69yrRxmhGNRxFOZdy5LHOQzHHYoDq2F/Y8AJNmzZlmOcwFp1alG1TL168iI+Pjz4A0NF5jtFXAHSeT1ITITUWbAsodz9DLu9W7W4DxVpCpaHZ34+OVgZ4yclga6vSrlxRkfsmTFBL9f/7nwr8c/s2xIXBivegWghsATYDFy5BxYpq1m9nB82bqwh+trYqIJClpCZAciTkKQCxV80GkJs3b+bw4cMM+3IYqVoqbvnc0ETjYvhFKrtWBmDZsmV4eXmxaOMimvyWOYjQV42/IjwhnLsJd1nrt5ZSBUpxbfA1c2ChUQ1HMbn5ZHP+jUc2MqznMN5//32++uqrbJf0Q0JC2L59Ox988IHl76ejo5OrWLoC8EyNAP+OQzcC/IdyfYXIqVFPp+xbO0Q2lBNJNeacJyVFpGnTzGkmkzLaO3dOZNMmkWvXRHp2FmmHyBxEppQSaV9f5Rs8WCQmRhkBiqjgQJGRSjUQHiw2lBZQKDRUXV9bKnL26yzZYmJi5OLFi1L+x/LiMNEhy/0TJ06Iq6urnD9/3px2MuRkJiO/5NRkqTG3huCJVPixgoiIjNw2UpwmOcm1iHSlvrNnzwqOSL8x/STVlCqBUdkbG964cUNmzZqV87vp6Og8dfgnKAH+HYc+APiHYUpREr8i6T7/uc2+jkoq92E4OSn53jRAZNgw1UH7XxJ5A5EFtiIbm6e3OS1f27bpGgEZSUrKXGZO1KolcmGhSMi2LIOFmzdvSrt27czR865FXJPGSxvL+TuqDbv8dwkjkVKlSsmaNWvMz6WaUsV2gq3gifRa30s0TZO1F9bmGMwnjYMHD4qbm5v88ssvIiLy45EfszwTEhIiw4YN0y39dXSeAywdADxvSoA6/3Wiz8P5b9R5bi/7A6TEwO3tULLTw/O+/jq8/HL69aVL4DkGWlnB5orwVgX4OgV+KwLOlVXeXr3gxg2oXRu8vJSVf0bs7NTWwejRcPx4Dm2MBZ8TULgy5C2RxXbA3d2diRMnYmWlvk9gdCA+IT5UmVMFgGqu1ai0pxIhpUOIKhNFjDEGgN8v/E6KlgJAmYJlGLp1KDOOzAAgLjnOXL5JM5nPN2/ezFtvvcWyZcvo0aMHAIPqDcpkYwBQsGBBGjRooFv66+j8g9AHADrPByJwZ5/a326wPHfLDsmgGXVzPRR5DfIUfPhzf/yhOvX4eOjWGVb2hV+KQKsiUP0n+NEaSjeCuXNV/mHDoHdvOH9e2Qm4uORc9sqVSjAoO472U25+rg3AOV1SV9M02rRpQ3BwMDVqpAshvbf+PZJSk8yd8pTxUyhRsATdBnejr3dfvPZ5sfXqVrqv7Q5APfd6WFlZMfvYbPYF7sPexh47aztzeTZf2/Cz788sW7aMPn368OvaXwktGpptU6Ojo2nbti0iQseOHR/+TXV0dJ4b9AGAzvNBShRc+hFMxtwtNyoK3N2VIR6oQUaxN9T5uXOwe7dy3zOZsj6rafBCEQhYAPXWgPMlsPkUnCdCkw/Bzw/274f8+dUApmtXaNQIatWCjz+G8HA1ex80KN0TII2AAHjvvfRrEbgyX2kHvPITFH09U3YRwcrKiilTpph9/Y8FHyMkNoSAoQHcGHqDTZc38dtvv/H76t/ZXnM7NYqpQcK3h77ljRVv8GKhF6nqWpWjwUcp7Vwak5jo+GJHmpRqwunbp+m2thsAQZ8GcWvrLcaOHcvu3btJLJLIhxs+zPJ5TCYTzs7OjBs3DgcHFcdgh/8OsxGhjo7O843uBaDz7AneBEVbgnWeh+d9Uo70AtdG8EIv5bpnba0C+RQqpER8IiKU9X/LF6ChEaokwt4ocOoIdtWgTBn44AOoVw+OHlUugGvWqEBAJpPq9IsUUR2+wQCenjB+vFpFSHMVvB/R1HbHhW+hzHvgUCxLlpEjR9KkSRPatWtnTjOMNzCgzgDmnphLAbsCRAVGwTI4uvco84LncfLWSQKiAhhQdwCjGo5ind86em/sDcDFgReZfXw2U1tMpeCUgjjZOWEwGLgdc5sRCSPYvHkzW7duzSLtm0ZqaioNGjTA29ubIkWKmNOjkqJY77eeXrVy2W1TR0fHYnQvAN0I8J+BZhI5NkAkIeTvqe/cJJED3ZWVPygJ3wsXRKwQafmCyFkvkc01RH5zF9kxRCQxVGTpUvXsqFFiDvzTvbtI69YiN26o69Wr1W/XriLVq1ventREkS01RYzZS+mKiAzcNFB2ndwlcXFxEmuMzXL/wp0LMm//PPEo7SFF31dBfdacWyM7/XcKnkiDRQ3MVv+7r++WVFOqaJomeCKhcaESHh8uEQkREhEXIa07tpb69etLeHh4ju2JiIgQEZGgoCDL31NHR+dvA90LQB8APPcEbRaJD/576zRGivxZR2R5GZFPEDn8ochIRJbZinyDyOEBIre25+yBMGCA0ujPSFiY+vX3F4mOtqwdphRVj4hIfM4d6bp168SmsY14X/KWi2EXBU8kJCZEYpJi0osymaRNmzYyZMgQMZlMgidiPd7a3On7hfnJJ1s+ETyRpBQVU+HbA9+avQZEROLj46Vt27bSunVrORVwKovufxqapkmjRo3k4sWLlr2njo7O346lAwB9C0Dn2XFxBhRp+viR/R4XLVV5AiRHgSlRSQy7NYZNe6FzZ7WMX7s2/PILvPqqeubcOahaNffakBQGJ4dD/aVgZZ1tFhEhMTGRsLAwinsUx4CBJFMSjt840vyF5gysO5Bt17ZR+Ghh9u7dy44dOzBYG7D92pZNXTeRN09eem3oRUB0AMs7LKdn9Z7msvN8nYf57ebTq1YvwsPDefPNNylXrhyLFy8mz6Q8fNHoC7xe98rUHj8/P8qVK4emadjZ2d3fXB0dnecEfQtAXwF4fok4JXJ7z7NuRVbu3hVZuVIdIHLokEpPEwAqXFj9xt5bhk9OfvQ6InxFjvR5aLaAgABp1qyZ2dffaryVlJxeMlOeZaeXSa2htcTDw0Nu376d6R6eSPFpxUVEZMPFDRKZGCkiItFJ0bL16lb5bNtnEhYfJpcuXZJy5crJ559/bq7ry51fyq3YW1na1KtXLzl69Oijv7OOjs7fCvoKgEJfAXgOCd0Nxggo+YzdxvbuhaZNwc0NQrN3czMTG6uMA8uUgcuXVSwAgwG2b1cSvw/DlARJoWBfDKLPgctLOWZN+zd55coVKlSoAEB8cjxWBiscbJW1/Zc7v+TSpUvs89yHt7d3Js39irMqcvnuZVXWuMz/vg3jDZRwKoGLgwu+x3xx3ezKJK9J9O3bN8f27Nmzh4oVK1KsWFbjRB0dnecPS1cAdDdAnb+PpDC4ulD54T/rzh+Utf5nn6mAPslZI9qZmTIFnJyUlf/Vq6rzB+U18PrrOT+XkZA/4fJs5enwgM7fZDLRtGlTQkJCGHp8KBfCLgCQL08+HGwd+OvqX7Rb2Y4Z+2awfvx6vLy8KF2lNJ9s+QQATTQu371Mj6o9+Pq1rwGYdWyW2TVPxgmBnwYy0nEkrptcWfHLigd2/gCnT58mICDAsvfU0dH5x6BHA9T5+9CMue/n/yiIqFC+Z84okZ4XX4Q2bVRH7uSklPuGD8/8THg4rF6dffCeokUfXufN9YBAiXfA4+2HNE+wtrZm8eLFuLu7czLkJI2WNqJSoUoc7HMQAP9If/YH7Cd+dTyOZR3p168fVeZU4ULYBWa1mcX3h7/HPb87v57/FVsrWy6EXWB+u/nUKV7HXMfEiRNZvHgxu3btouoD7BrWrFmDm5sbQ4fmEDBJR0fnH40+ANB5+mgp4DcNKn0KFT95Nm1YsgR++01F+UuTqxVR54mJMH26ms3HxSmBn7p1VZ6QEPDxyZzfElLiwNoe8pUCw71/Zg95dvDgwbRs2ZL27dsD8Fvn35h+ZDpNSzcFYOvVrXxY80PObTzH3Ji5LFm1hEUnF/HRSx+RkJKA82RnYowxTGs5jRHbRtC7Vm/+vPonjnaO1PeoT3JyMh999BEHThxg34F9lPQo+cD2uLi4UKBAAcveV0dH5x+HPgDQefqIBlZ26R3h02T3bmjSJH2ZPo2iRdX+/dat97Xt3h55//5Kse+FF2DEiPT06tXV7zffWN75A5wcBsXbQIkHz/rT0DSN0aNHU6hQIQA6/d6JtX5rkXGCX5ifeQn/+xrfM/f7ubT/tj07A3dyPuw8+3rtw2ufF/Y29hzpc4QXXV9k+CuZVzIiIyPp2LEjTk5OXHvrGmFWYXiIBxfCLlDVLfMqwMqVK4mJieHjjz+2/H11dHT+eVhiKfhPPnQvgGfMhe9E4gL+nrrSwuj6+eWcZ8yYdCv+jKRZ+mcngPPOO8rH3xKuLBRJuqsEfizk999/lxEjRmRKC44JFp8QH9l3Y5/YTrCVWUdnSUxcjOCGtB7eWsLjw82R/fBEIhIiBE8kxZQiMUkxsvLMSlnvt15ERPz9/aVSpUoydOhQSU1NNdex7eq2LFH9TCaTBAYGytWrVy1uf25S7sdyMmr7UwoDraPzHwFdCEgfADwXXPtJdYjPktGjxRyWF0TOnFHnjRqJ7N4t0q2bSFQ2Snw9e4qcOGFZHalKYEcu/igSdyPbLL+e/VVmHp2ZKU3TNElKSpKQEKWEOOfYHIlPjldN9UReXviy9Pqjl4iIDBs2TBq1aiR34+9KcmqymDST7Lm+R16a95K5rK6ruwqeyCuLXhE8kUOHD0mxYsVk5szM9WbH6tWrZciQIZa971Nioc9CORFs4TfX0dHJFn0AoA8Ani3Xf01Xuvs7iI5Wf53vV+kTEQkNFdm6Vd3PONNu0SI9Pe0ICBCZO1ekcWORChVEvL0fXndqksimKiLGiAdm+3z759J+ZXtZd2GdlJpeSm7evCmNGjUy+9+LqE4/bWY+ad8ks//+9u3bxd3dXfgM86y/4syKcjdBDa4OBR6S0tNLC57IsL+GiYjIzKUzpXDhwrJx48YHtkvTNImIiJCkpCQJDQ19+Pvq6Og81+gDAH0A8Gy5c0Ak8tzfV5+mifTvr84PHxaZPz9rnoYN1V/5WbNErK0z3wsNFfntN7UVMGSI5LgdkBFjlMi1pffOs+/88URmHZ2VKe148HEZ4D1ARESuX7+e7TM91/YUPJHzoeclPDxcPDw85Iv5X8ikfZNE0zSJSYqRyrMrm5fw8US6r+kuYfFhommaTJ06Vdzd3cXHx0eMqcYHvsauXbukS5cuD35XHR2dfwz6AEAfADwb7p4UuTDt2dTt5ydiaysyaZJI8eLqNyBAxHivA5wzR8TDQ2TePPVX38pK5HH3uk3JagBwekzOcQNE5ETwiSwBfDRNkxYtWsih04fkm/3fmDX3TZrS8b8ZfVNERAKiAuRq+FWhMjJkyBDBE1nos1BcpriYVwbuJyUlRfr37y8upV1k+O/DxSfEJ8s+fxqpqaly7pwapCUlJT3yJ9DR0Xk+sXQAoAsB6eQuDkWhQLVnU7ednfIAGD0agoPhiy9U6N403foBAyAoCNq2VQv+jRvD/v2PXs/tnXD4fcjjDDW+VqF8c6B28drkz5PffC0iGAwG5s6dS5hdGKN3jsZqghUHAg5wJOgIi9ovorhjcQCCY4Ip17cc5bRyNO3bFIB+3v2ISIwgPD48S1137tyhVatW3Lhxgz4/9qHiCxWpVbQWoSOyVzm8ePEiEyZMuPfpdG1/HZ3/GroUsE7ukBoPZz2h+kSwfgadSXS0kuqFdBc+UOp9d+8qud/7CQtT6SkpYGOBi2LESaVp4FIHUmMgT8FHbubXX39N6dKlee+991TzNBMlfyhJSGwIAC+7v4xJM+Fzy4czXc7QsEFDDuw5gF1xO5aeXkrb8m0pYF+AakUyD7KW/LGEPh/0YczgMXh6emJtbc3oHaNpUbYFr5fJrFZoNBrZvHkz77zzziO3X0dH5/lHlwLW+XuxygPOVdXvs8DJCT7/HCIj02V9T5yA/PnB3j77Z1xd1WDhYZ2/ZlL5Em9D0m0Vve8xOn8Rwf5lewpUTxfX+WTLJ7jlc8M4xsicNnO4En4Fn1s+zGgxg4/7fMzYL8fy+l+vU2l2JSY3n0yjUo0ydf4iwnfffcdnH31Gg/814Ouvv8baWkUX/PPqn/hH+mdpR1RUFHv37kXTtEd+Bx0dnX8P+gqAzpPj952SuXUs+/fWGxWVPusH1fF37Qrr16sOu3Zt8PVV6n45DQIs4ehH4N4ePNo/dhFHjhxh/vz5HKp9iJ7VevJVk68AOHzzMFfuXuF61HX23NjDnoA96oGDUDexLlu3bsVlqgvD6g/j+yPfc/PTm3g4KVni6OhoevXqRVBQEKtXr6ZUqVIPbEN8fDzffvstX375JXnyPKOBmo6OzlPH0hUAXQlQ58lxcIc8f7NkbHQ0FCwISUnpe/zNmsGBA1CjhrpOk/D184PKlTNvDTwMEQj4VWn41/ACu0JP1Nw6derg4uJiju6XxislXqGKWxWcJzsTMiwEo8mIo+ZIiekl6PpzV6KTo80R/ZJSkyjkoNrh6+tLp06daNWqFb/++qtFe/h58uShSJEi5hUCHR2d/zb6FoDO4xO6G4I2QumuT9xBPjLOzmrvPmPHt24dTJ2qovdl5IUXYOVKdW4wqBWCnLhwQS35A0RfAGM42Ls+0NDvQcTHx9OsWTOSkpLQXDSzpG9GnOyckHFCMcdilJlRhm7Du9H1na4MPzWcxScXA+C1z4s5J+bgYOvA0qVLad68OePHj2fWrFkP7fyNRiOdO3cmLi6O//3vf/oAQEdHB9C3AHSehAgfFfSmSJO/r87YWKXn36nTg/Olpqq9/VOnoFat9PRJk6BHD8huuTwsDEq6wdrq0PII2DjkSpPPnDlD9erViU6KZuqhqUx8fWKOeaf8NYXJ3Sdz+tRpUhxTKOlUkhrza9C6XGtqFqrJ3rl72bJ7C2693PD9yvehdduMt2Hb+9uwDrSmcePGGB4lnoGOjs4/Et0IUOfpkRQOF6ZCwZf+3s4fYNcu6Nw5/VruRei7ejU9LToabG0hIgJeeknZAKTxxRfZd/7JkWA8BIkCTf/Mlc5/wIABHDlyhOr3Ago52zubO/+k1CSmHJjCOr91zD0xl8DoQADOrD1DYuVEbAraUH5meey87OhapSu1rWrzfd/vSUpKYvHGxbSq3+qh9WuahrZE48b1GzRp0kTv/HV0dDKhrwDoPDpJ4RC0Dsp99Kxbovj9d+jQQXX6ady8CYcPw8svK2+AB60YaCZIugWX50DNSbnWrPPnz1OuXDns7OxIMaVga21LZGIkzvbOXLl7hUqzK1G3eF2OhxwHYE+PPbSs3pLSY0tz2XiZy59cptb3tTBuN+IS4MKkSZPo3bt3th15v4398GzqibuTO6As/QsUKEBQUBAeHh659k46OjrPP/oKgE7uIwJ+34OVbe51/hs3Kte9x0XT4N13M3f+oKz+u3SBjz/OvGJwPwG/wanhkNcj1zr/5SuWM23aNKpUqWLen88zMQ8LfRbi8q0LX+78koqFKyLjhGP9jnH5k8sA2IXb4VjMETtnOzqU70CFbhVwWODAoFcHcfHiRfr06ZPjLH7RqUVci7xmvn733Xc5ffq03vnr6OjkiD4A0LEc0QABq1x0HnnrLfD2tjx/vnzQ/p473tixYG0NKXl5+wAAIABJREFU48apbYCMpPn4N20Ko0ZlLSd0L3wzCGr3g+oTHrv52fH+mfcpVqdY5upGhNKrVi9knPBN828y3UtKTQIgLj6OfKn5uLboGns+3UNjGnPw4EG+//57ChZ8sO6AjBMal2rMpUuXMBqNeHt7U7NmzVx9r+zQRMOUZjSZywRGB2IYb+Dfvkqpo/Os0N0AdSwj7CDYOMKLw3O33Ef9z33fPihcWJ1//TW88Yaa5RcvnjVvfLySBY6PT0/TUtQKRkIgNH8Z3GqCrdPjtz8DQUFBjBw5krBFYbhOc2X9nfUsenMRBewL4JYvGyXCe1QrUg0Zp7S5vby8MBqNvPrqq1SsWFGVGxNk9v1/GDNmzKBr1640btw4V97pYZT+oTRhCWEkfpmY62W7O7rza8dfddsFHZ2nhG4DoGMZgWtVR1msxdOv6/vvoUoVaJXB0C0sTM3q78dgUHr/P/2U9Z6mwWuvwZ496SsEu1pAralQMPdnxyaTiSNHjtCwYUMKfVuIiMQItvXcRoMSDXj7t7fZ2nMrJs2E134vdlzbQePSjZnU7MHbDiKC1QQrznx8hipuVbDKwR3x0KFDeHh4ULJkyVx/rwcRY4xBRHC2d/5b69XR0ckZ3QZAJ3cwJUPIX1Cy49/T+QMMHw4jR6ZfR0UpzX6jMWtekew7fwArK9i7F0xJSq1QNGi4Ktc7fxGhb9++3Lx5k4YNGwLQ8cWOHO97nBZlW5BsSmaH/w4MGIhKimL83vF0rNyRFi88/HsaDAZWvLOCzVc2Yz3BmqNBR7PN5+vry7Vr17K99zRxsnPSO38dnX8o+haAzoNJDIHgTVCsVdZ99qfF/atSBQrkvFUQEAAzZqhVg4xoGixYAL26qJULLRlMxlwXLDKmGrGzsaN79+54eHgQY4zhyt0rzG07F5uvbQgZFkIxx2JmNT/XfK7m8wdhGG9gbOOxjH9tPDeibpg7/nIu5TLlW7duHY6OjgwYMCBX30tHR+ffj74CoJMzESeVdXzdWX9f559GXBwEBmZOi4rKms/PD6ZPz5oeFQWTB8D+zip4T5XRuSbskxH7jvYYuhq4XuA6NjY2zDsxjzoL62DztRpb99nYJ1N+70vexBhjzNfXIrKfte/vtZ/B9QYD8EWjL9jQbQNz2szBxcElUz43Nzdcs9sa0dHR0XkIug2ATvaIwOH3oOpX4FTx76+/d29YuhQSE+GHH5Qlv5UV/PEHNG+uvAFy4tZ2JeFbupua9T/F8MR7j+/l5J2TvPfaexTOW9icfujmIVzzueKa15UC9ulxEgzjDax8ZyXdqnUzX5/qf4qaRXPelgiLD2PWsVmMf228OW3JkiXEx8czaNCgp/BWOjo6/2QstQHQBwA6WUmOVtby9oUfnvdpERwMHv9v777Do6rWPY5/V0IaHQJIh0gTAhgJhHgQpWPBIwdFENBjxYbX7hUbRs9VDgpiFxQLiKAgR0QFOdhQFOktdKSFAFICJCE96/6xh0BMh5lMkvl9nicPM7u+ez2j691rr71WY9i6FVq3hhMnICTEGdlv/fr8Hwmk7Hem6U3cDhmJUPdij4W3bds2PvroI6bVmUZ8YjwZT2d47Fzf7/ye3lN757wpkJ6eztGjR8nOzqZRo0YeO6+IlE/qBChnb9882Pqad2No1Mip5Fu4phi21hnbf+1ayCrgvfN1Y+DPxVCzvdsr//jEeEyMIdtmcyLtBHsy9tCtWzdi74nlyGNHcrYzMYaHv837qqSJMcT+GXtW5+49tTcv930ZgA8++IAxY8bQoEEDVf4ick7UCVBySz8GYSNK/n5+SUVEOJP6nHde4dud6nuQmAjVqzvfz+yPYLPh1xuh0wSImuSxvgp1K9clpkcMWZlZXH3L1Sxuuhg79nQZnUg7wU3/uQmAOyLv4GDSQc6revra3rjiDZrXbI61lkGfDeKjgR9RPah44w9M+8c0utbvyt69e7nxxhtJT09378WJiE9SC4CclnEC/tsNMlM83+lvxw7n+X5h4uKc4XytzTvQj82Gw79D9MXQYBgE1fZozAH+ATxz2TP4+/tz+xW3k/l/mbnWH089ztwtcxnZaSRt32xL/fH1c93x3xt1L1UCq2CM4YvNX3A89Xiu/dMy00jPyr9iH9FxBBt/28iECRMICAigSmH9H0REikl9AMRxalY9T3Sai4yEhQshtIhX8GbNcib1qeRqmFq6FC65BO6/33nN79Rv1VpIOwS/3wE9v4RDh4s+thtMmTKFiIgIIiMjGfTpIB7r9hjRjaPzbPfOineoHlSdwe0GE+AfkM+R8vKL8aNBtQbse2hfruVHjhxh/fr19OjRA2utRsUTkSKpD4CUTOwLsH2yZ3rMr1lT9N2+tc6kPtu2nV4WHQ2Zmc5Y/7Guu+l9X8OKeyG4Hlw2F7JtqVT+E5dO5IjfEWrUqoGJMfyR8AcJKQlsPLQRE5O7Ur6r810M6zCMAP8A1h9cj4lx7voLk/pUKrvu35Vn+a5du/jll18AVPmLiFupD4A42twH2ZlFb3c2Cuq0dyZjTt/hJyU5r/xlZ0PVqs6z/+rb4ZiF83pAaBfPxFmAP/74gxdee4HH73uclue3pG2dtiy7YxnpWelkZWfxVPen8uxzw+wbuPC8Cxn9/Wi+GPIFvcJ65VqfkJJArZDTE/wE+gfmWr99+3a+/PJLHnroISIjIz1zYSLi09QC4OsyEuHXEeAX5DxHLwuqV4fzz4dq1WCdc/dLVipkp0KlKs7dfynKyspi4oCJPHTxQwBsvHcj+07so9qL1Zi4dCLP93o+zz5nDo97zQXXUC2oWs73bJtN7XG12XN8T579cvavUYOG+U1wJCLiJuoD4Ouys+DAImjYv+htS1viCVjSG7rPgSpNSv301lref/99RowYQVBQ3kcjby57k1HzR9E6tDUzrp1BpwadCjyWiTH0Pb8vS/YuIfmJZOZvm89Pu39ibJ+xubbbvHkzzz//PB9//LGa/EXkrBS3D4AeAfiy+G8hoGrZqfyjopyZ/W65BtY+CT+0hnVhcLmr8r/xRpg9u+j+BG6Snp7Otm3byM7Oznf9sA7DeGv5WwRVCsLgVNYFddR7qe9LdG/ancT0RAD2ntjLj7t+zLVNSkoKrVq14pFHHlHlLyIep0cAUnZcHg2tAyGkIYT9E1q0hFZnDEP83HOwYIFHQzjVIvb7779z+PBhxo4dS0hI3jkE1h9cz9hfxvL18K9ZfcAZynfcknH4PZf/f1KP/O0RujbuSp/z+wAwMnIkS29fmrN+x44d9OrVCz8/Py666CIPXJmISG5KAHzV0VXO9L51u3k7EsjKgI0b4K4roMlJMH5Qv5czBsDzZzxfDwuDyy7zWBj3fH1PTgW+cPFCNm/enO92KRkprNq/indXvesM7jPGueu/L+o+to7amms7E2NyTf7zV9ZaNm3aRIsWLViwYEGBd/4mxjBvy7xzuDoRkdzUB8AXZWfBT1fDxR+Weoe6fM27GsZ8Bau8+1tMTEsk7mgcy1Yt4+YVN+eZtvdY6jFqBNWgyStN2Je4r8BpfZPTk2nyShMOPHKApXFLubTZpQWec9++fdx8880sWLAAf3//ArebFTuLfi365epcKCKSH40DIIXr+Y13K/+sVFh6q/Nv/2mwMv/n7KWpWlA10v9MZ9k3y/Kt3Gv9uxav/v4qcQ/FFVj5gzNqYFpWGgF+ATmVf7bNfX3p6elMnz6dhg0bsnDhwkIrf4DB4YNV+YuIWykB8DXH1sMP/bx3/oPb4dcp4B8Mja8B4w+BNT0/9HAxxMbG0rFjR958800SUhIY+8tY0jLTcm3z3R/fFXmcQP9Akp9IzmnOv3Xurfg/l7uCP3nyJKtWrSIzMxNjDFsOb8kzoJCIiCcpAfA1NTtAt5mle05rYenPzhwD74yF8bfDjBmwNAP8ijdUrqdlZWXxwAMPcODAAQBqj6vN6O9Gsy/x9NC8doxl3rCSP4d//YrXiXswDoATJ04watQoQkJCGD9+PAEBzvXXDqnNLRG3uOFKRESKR30AfMle13C0TQZ65vjR0dC/PzzwAOzcCZ1c78Vv3w4xrSDmIzjfmTGPgQOhRg346CPPxFIChw8fpkqVKgQFBZFls5wm/Mw0giqdfvd/97HdpGam0qZOm0KOVDhrLdZaZs2axfXXX69X/UTEI9QHQPKq0gSqhnnu+NddBz17wvjxzgRANht+ugYaV4cP06D5CJg40WkR+OKLUqv8l+xZgokxTFk1Jd9m9kmTJvHRRx9x27zbCPxXINZagv8vmC2Ht+S8FnjTf26i87tF/vdUoOTkZP72t79x8uRJhgwZospfRLxOLQC+IvVP8A+BgGpFb3uuknfDge+gxa1weBnUjgQ/fzh+HGrWhNRUyGdkPU/Zc3wPE36bQEyPGJbtW0bfFn1z1iUkJFCzZk2staRnp5Ocnkxo5VDC3wrnj4Q/SM1MJfuZ7HOqsI8ePUrt2rXZvn07LVu2dMcliYgUSC0Aktve/8C2tzx7jqOrIXkP+AU7vfsB6kQ5lT84Tf7WerzyP5lxkqzs0xMQNa3RlImXT6RGcA36tujL5sObMTGG2NhYBg50Hof4+fkRXCmY0MrOzII//PMHtozawoa7N1Dr37U4kHQgz3neX/0+1V+sXmgsaWlp9OjRg4SEBFX+IlKmKAHwFa3uhHb/65ljJ+92/v3zJ0jcCiHnQet7PHOuYqjyQhV6Te1V4PpWtVvx7dBvCQ8PZ+HChfne3derUo+mNZoSXi+c0MqhdHy7I32m9sm1TWpmap7X+870/fffExgYyPLly6lVq1aB24mIeIMSAF+QsAY2vuT+42alO3f6iwdCRhJc8ADUz11JsmYNPP54/vt76PFT2lNpfHdTwa/r+Rk/xtw8hlWxq3JN8nPZB5fxr8X/yrXta7+/RlTDKBaMWMA7A97Jte6eLveQ9ERSvudIT0/n3XffJSEhIeccIf8XwuBZg8/2skRE3EoJgC8IqgOhZ9+BLRdrnb+9X8Dyu533+S9f5UwqlJ/YWPjgg/zX+fnBrFnuiesMgf6BVPLLf56rrCzn0cBLU18icnZkrnX9W/YnunF0rmXnVTmPelXr0alBJ1rWLroJPy0tjdGjR5ORkcGMGTOoXfv0FMtzh86lQdUGJb0cERGPUALgC0IaQd3u53aMU3frPw+Coyug4RXw/F7o0aPwQXyGD4eDB/Nft2YN/P3v5xZXCb322mu8/PLLtKzfkp9u/inXuie6P5EzWQ/AivgVGGN49fJXi3Vsay2BgYG0bNky5/3+M1ULrMbry14/twsQEXETJQC+YP2zEPvi2e1rrdO576erne+dX3d69fsHwaNPwFNPnX1cF15Yqm8D7EzYSeZFmdx+++28veJtLvvQmVjo1rm3snzf8jzbz9k0h/vm31esY6elpdGtWzeOHz/ObbfdRmBgYJ5tLm5ycaFDCIuIlCa9BugLrC3ZULuZKVApBH6/AxoPhAb9Ie0whNT3XIwetmfPHq4achUb+m3Axji/+c6TO/PI3x4h5qcYXuz9IhlZGVw/+/oSV9Lx8fE0bNiQHTt20KJFC0+ELyJSbHoNUE4zBvZ9DZsmFLxN/HxIPQTHYuG7ns6yjs87Tf1+lXJX/sbAL784n48fh5tu8lzsbtKkSRNmfzg7p/IHiGwYSYOqDdh07yYGXjCQ6eunl/i4qampDBgwgGPHjqnyF5FyRQmArwjtAvV7O1MBf9fH6cF/8EdY+7SzPmE1pB2CGm2h7xJnWUh9MPn8RObMOT3M78GDMG1aqVzC2br//vtZu3YtbdrkHsZ30oBJXNb8spzvyRnJrL5zdbGOmZ2dzaeffprzml/NmjXdGrOIiKcpAfAVwfWg1oWAhQv/5dzV12gPzW9w1oc/ATXaORW+nz8cOgQPP5z/sf7xD6hc2fncurXHXudzl2HDhuWp/PNzMOkgJ9JOFOuY6enp/PzzzyQnJxc5la+ISFmkBMDX+FWCOtFORR9cx6n087NlC0wo5JFBObBjxw4mTpxI165dCQkJyVmenpXO9HXT6f9x/1zbr71rLf9e8m8S0xILPGZKSgq33347mZmZvPHGG1SrVgpDK4uIeIASgIpuxoyCB+IpzCWXlPk7+6IEBQXRtGnTPMtnxc5ixH9GcCj5UK7lxhi+2fYNSen5D+6TmZlJcHAwAwYMoPKpFhARkXJKbwFUdG+8Af/9L8ydW/x9srOdQXrKsc8//5w+ffpQo0YNtxzv5MmTREdHs2TJEt31i0iZprcAxDFqVMkq/9hY8Pcv13f/1lqWL19OQmICWw5vKXLbomzatInKlSuzaNEiVf4iUmEoAZDc2rWD7dtLNm5AGXLs2DG2bdvG2LFjmbFzBhe8eUGB236w+gP8niv8P4Hk5GRGjhxJUlIS9erVy3eb2Rtn8/XWr88pbhGR0qYEQHIzBsrx++zLli3jww8/BGB099H0CuvFgcS8U/kCDG0/NN/X/io9V4nY/bG8+eabBAcHs3jxYqpWLWCuA2DyysnMjJ3plvhFREpL/jOmSMWQnQ2jR8MLLzjN+hXcwYMH6devHx3/1pEjJ48QWjmU73d+z/0L7md/0n4W37I41/YhASFE1I/Ic5yezXsSVCmIQ4cOkZ6enusNgvwsvHGhW69DRKQ0qAWgIsvIgHHjIDXV25F4XFZWFldeeSUHDhygyStNcsb5/2bYN3y28TO6NelWrOMkJSVRZU4VGlRuwLPPPltk5S8iUl7pLQAp9zIzM0nPTscPP4IDg3Oty7bZHD55mHpV6mFiDKO6jOL1K/OfkS8hIYFatWqxZMkSunUrXsIgIlLW6C0A8RmTJk2iSr8qRE2JyrPOz/hRr4rTeW/RjYt4/JL8x0Q4evQol112Genp6XTr1g0TYxj/63iPxi0i4k1qAZByLzMzk4QTCdSsUZMA/wB2H9tN/4/7s3nU5iL3TUxMZN68eQwbNoy0tDSCXNMTL9mzhPB64dQM1hj/IlK+qAVAHF99VW5f6StKdnY2na/oTMD/BlC3dl0C/AMASM1MJTM7s1jHSEtLY8OGDVhrcyp/gG5Nu6nyF5EKTQlARRcVBW++6dlzXHMNvP22R0+RkJKQZ9AePz8/Hr77Yd4f/n6u5W3qtGH7/2wv9HirV69mxIgR1KlThxdeeAFTQZMkEZGC6DXAiq5ePbjnHs+eo1kzaNDAo6eoPa424/qM49FujwIQHx/PDz/8wPDhw0t0nPT0dOLj4+nQoQNPPfWUJ0IVESkXvNICYIwZbIyJNcZkG2M6n7G8uTEmxRizxvX3zhnrIo0x640x240xrxndsp2du++GX3917zFfew0GDnTvMf8i8+lMHvnbIznfExMTOXnyJOAM5ztvy7w8++Q3q98PP/zASy+9RKVKlbjggoJHCRQRqei81QKwARgETMpn3Q5rbd7RWeBtYCSwFPgGuByY77EIK6qff4YePbwdRYn5+zkDGe06tovUA6mEhYXRpk0bAA6fPMzfZ/6djKczqOTn/KRX7V9F5ORI7BjnscGSJUvYv38/1113Hf369fPORYiIlCFeSQCstZuAYj93NcY0AKpba39zfZ8KDEQJQMlt2ODtCM7a8dTjhL0axv8c+x+uuuKqnIq8bpW6ORX9KRfVv4jkJ5Kx1pKdnU21atVyWgzUeCQiUjb7AIQZY1YDJ4CnrLU/A42AuDO2iXMty5cxZiROa0G+88FL+VQjuEaeir4gxhgqB1Rm7NixBAUF8eCDD3o4OhGR8sVjfQCMMYuMMRvy+bumkN32A02ttRcBDwGfGGOqA/ndshVYE1hrJ1trO1trO9etW/fcLqS8S0/3dgQlVmdcHQ4k5Z7A56utX2GeNfTp04ddu3blWvfdH9+RkZWRa9ns2bM5ePAgd911F/fee6+nQxYRKXc8lgBYa/tYa9vn81fg5PTW2jRr7RHX55XADqA1zh1/4zM2bQzEeyr2CiMtDYKCICHB25GUSNVAZ+a96PeiuWXuLc7nxtFMunoSb7/9Ns2aNcu1fZ9pfVi2bxkAGRlOIrB//34OHz5MzZo1CQwMLMXoRUTKhzI1DoAxpq4xxt/1+XygFfCHtXY/kGiMiXb1/r8JKDCREJegIDhwAGrV8nYkhTqQdIAeH/bI+b7rgV3Ur1qfB6Mf5NaIWwGoU7kOwbHB1K9fP88zfDvG0q1pN7KysoiKimL//v3cd999hIeHl+ZliIiUK956DfAfxpg44GLga2PMt65VlwLrjDFrgdnAXdbao651dwPvAdtxWgbUAbA4zjvP2xEUKSElgaVxS/MsH9J+CN2bdQecV/1Wr15NQEBAnu3+/PNPXnnlFfz9/Vm0aBENPDwmgYhIRaC5AKTcOnjwIImJiTRs2JBJkybxwAMPqIe/iPg8zQUgFcq6deu48cYbsdYyf/580jPTmT9/Pt9//z2VK1fmwQcfVOUvIlICSgCkzFlzYA0mJndl3q5dOx577DGMMXz88ccEPRnE9qbbGTlypJeiFBEp3/QIQMqckxknmb1xNjddeFOB2xw+eZjqQdUJ9FcPfxGRM+kRQEW0e7e3IygVlQMq51T+fab2YcOfeUcvrFO5jip/EZFzoASgLJo2DebMcT6npYExzut8zZvDiRNeDa207Tuxj2Opx7wdhohIhVMWhwKWmTOhcWMYNMh5l//zz6F+fajgj2vys2nUJm+HICJSISkBKIu+/jr390GDvBOHiIhUWHoEICIi4oOUAHibMTB1au5lu3c7y32wyV9EREqHHgF427Rp4JrXPkejRvDJJ04SICIi4gFqAfC2ESOgXr3cyypVghtu8E48bnIs9Rjf7/ze22GIiEgBlACIR3yy/hN6T+3t7TBERKQASgDEI+7pcg92jPowiIiUVUoApNQ0HN+QySsnezsMERFBCYCUojsj76RLwy7eDkNERFACIKVoTI8xtKnTBhNjSEpP8nY4IiI+TQmAeMSJtBP8Hvd7nuWVAyrz0cCPqBpY1QtRiYjIKUoAxCMmrZhE9JTofNcVNs2viIiUDiUA4hGPdntUbwGIiJRhSgBERER8kBIAERERH6QEQERExAcpARAREfFBSgBERER8kBIAERERH6QEQERExAcpARAREfFBSgDknGRmZ3o7BBEROQuVvB2AlC2HTx6mTuU6xdp2/rb5XPnJlRrxT0TOWkZGBnFxcaSmpno7lHInODiYxo0bExAQcFb7KwGQHMv3LSfqvahiV+j9WvRj30P7PByViFRkcXFxVKtWjebNm2OM8XY45Ya1liNHjhAXF0dYWNhZHUOPACRHl0ZdSnQ37+/nT8NqDT0YkYhUdKmpqYSGhqryLyFjDKGhoefUcqIEQEREvEqV/9k513JTAiAiIuKDlACIiIj4ICUAIiIiPkgJgIiIlBmn3gZw11/z5s2LPOfevXvp2bMnbdu2JTw8nFdffdXzF1oG6DVAEREpM3bv3o217htbpDgd5SpVqsT48ePp1KkTiYmJREZG0rdvX9q1a+e2OMoitQCIiIhPa9CgAZ06dQKgWrVqtG3bln37nDFO1q5dy6WXXkq7du3w8/PDGMOYMWO8Ga7bqAVARETEZdeuXaxevZquXbuSmprKkCFDmDp1KlFRUTz99NOkpqby7LPPejtMt1ALgIiICJCUlMS1117LxIkTqV69OosWLaJTp05ERUUB0LFjR44ePVphxi1QAiAiIj4vIyODa6+9luHDhzNo0CAANmzYQIcOHXK2WbVqVc6jgopACYAUasqqKZiY3NnujqM7mLh0opciEhFxL2stt912G23btuWhhx7KWR4aGsq6desA2Lp1K3PmzGHo0KHeCtPt1AdACnVdu+toWqNprmVL9i7hwW8f5IHoB7wUlYhUVM2aNXNrE3uzZs2K3GbJkiVMmzaNDh06EBERAcALL7zADTfcwJdffkn79u2pU6cOM2bMIDQ01G2xeZtx5+sWZVHnzp3tihUrvB1GmZacnkxIQAh+Rg1CIlK6Nm3aRNu2bb0dRrmVX/kZY1ZaazsXta/+jy9UfbEq//zin94OQ0RESpEeAQgpT6YQ4Bfg7TBERKQUKQEQgisFezsEEREpZXoEICIi4oOUAIiIiPggJQAiIiI+SAmAiIiID1ICICIi4oOUAIiISJny8MMPM378eAAaNmxIfHw8P/74Iz169ABg5MiRTJ48GXCm701MTGTevHlcffXVAAwbNoxPPvkEoFijCqamphIVFcWFF15IeHh4hZnutygaCVBERLzmryPZRUZGsnLlylKNwVpLcnIyVatWJSMjg0suuYRXX32V6OjoUo3jbGgkQCmRtMw0TIwhISXB26GIiORy6s7eXU61BBTGGEPVqlUBZ1bAjIyMnJaDtWvXcumll9KuXTv8/PwwxlSYFgIlAD4oqFIQ7139HjWDa3o7FBGRXKpVq+bW43311VfF2i4rK4uIiAjq1atH37596dq1K6mpqQwZMoSXX36ZjRs38uSTT/LII4/w7LPPujVGb1EC4KNu63SbW2fcEhFxhwEDBrj1eMVpAQDw9/dnzZo1xMXFsWzZMjZs2MCiRYvo1KkTUVFRAHTs2JGjR49WmP93KgEQEZEyY+vWrW493qmOgcVVs2ZNevTowYIFC9iwYQMdOnTIWbdq1So6derk1vi8SQmAFOnwycMkpyd7OwwR8QHubl4fOXJkkdscOnSIY8eOAZCSksKiRYu44IILCA0NZd26dYCTmMyZM4ehQ4e6NT5vUgIgRar7Ul2u+uQqb4chIj4gJiYmJwlo3bo1W7duZeXKlURGRgIlf0Xw1PLC7N+/n549e9KxY0e6dOlC3759GTBgADfccANJSUm0b9+ekSNHMmPGDEJDQ91+zd6i1wBFRMRr8nuNTYpPrwGKiIhIiSgBEBER8UFKAERERHyQEgAREREfpARARETEBykBEBER8UFKAERERDzo2LFjvPXWWzkwJM9bAAAJ3klEQVTf4+Pjue6667wYkUMJgIiIiAf9NQFo2LAhs2fP9mJEDiUAIiLi03bt2kXbtm254447CA8Pp1+/fqSkpLBjxw4uv/xyIiMj6d69O5s3bwZgx44dREdH06VLF5555pmcqYSTkpLo3bs3nTp1okOHDsydOxeAxx9/nB07dhAREcGjjz7Krl27aN++PQBdu3YlNjY2J5YePXqwcuVKkpOTufXWW+nSpQsXXXRRzrHcylpbof8iIyOtiIiUTRs3bizxPidST9jHFj7mthh27txp/f397erVq6211g4ePNhOmzbN9urVy27dutVaa+3SpUttz549rbXWXnXVVfaTTz6x1lr79ttv2ypVqlhrrc3IyLDHjx+31lp76NAh26JFC5udnW137txpw8PDc53v1PcJEybYZ555xlprbXx8vG3VqpW11trRo0fbadOmWWutTUhIsK1atbJJSUl5Ys+v/IAVthj1o1oARESkXNlzfA/jfh3n1mOGhYUREREBQGRkJLt27eLXX39l8ODBREREcOedd7J//34AfvvtNwYPHgzAsGHDco5hreWJJ56gY8eO9OnTh3379nHw4MFCz3v99dcza9YsAD777LOc4y5cuJCxY8cSERFBjx49SE1NZc+ePW695kpuPZqIiIiHhdcLx45x7zw2QUFBOZ/9/f05ePAgNWvWZM2aNcU+xvTp0zl06BArV64kICCA5s2bk5qaWug+jRo1ypl18NNPP2XSpEmAk0x8/vnntGnT5uwuqBjUAiAiIvIX1atXJywsLOfu3FrL2rVrAYiOjubzzz8HYObMmTn7HD9+nHr16hEQEMAPP/zA7t27AWdWwsTExALPNXToUMaNG8fx48fp0KEDAP379+f111/HuibsW716tduvUQmAiIhIPqZPn86UKVO48MILCQ8Pz+mIN3HiRCZMmEBUVBT79++nRo0aAAwfPpwVK1bQuXNnpk+fzgUXXABAaGgo3bp1o3379jz66KN5znPdddcxc+ZMrr/++pxlTz/9NBkZGXTs2JH27dvz9NNPu/36NB2wiIh4TXmcDvjkyZOEhIRgjGHmzJnMmDHDM730i0HTAUuJrIhfQdS7Ud4OQ0SkXFq5ciURERF07NiRt956i/Hjx3s7pLOiToA+KCMrgwC/AG+HISJSLnXv3j2nP0B5phYAH3Rxk4tZctsSb4chIgJARX8U7SnnWm5KAERExGuCg4M5cuSIkoASstZy5MgRgoODz/oYegQgIiJe07hxY+Li4jh06JC3Qyl3goODady48VnvrwRARES8JiAggLCwMG+H4ZO88gjAGPOSMWazMWadMeY/xpiaZ6wbbYzZbozZYozpf8bySGPMete614wxxhuxi4iIVATe6gPwX6C9tbYjsBUYDWCMaQcMBcKBy4G3jDH+rn3eBkYCrVx/l5d20CIiIhWFVxIAa+1Ca22m6+tS4NRDjGuAmdbaNGvtTmA7EGWMaQBUt9b+5prpaCowsNQDFxERqSDKQh+AW4FPXZ8b4SQEp8S5lmW4Pv91eb6MMSNxWgsA0owxG9wWrRRHHeCwt4PwMSrz0qcyL30q8+JpVpyNPJYAGGMWAfXzWfWktXaua5sngUxg+qnd8tneFrI8X9baycBk1zlWFGdIRHEflXnpU5mXPpV56VOZu5fHEgBrbZ/C1htj/gkMAHrb0y+AxgFNztisMRDvWt44n+UiIiJyFrz1FsDlwP8Cf7fWnjxj1ZfAUGNMkDEmDKez3zJr7X4g0RgT7er9fxPgnZkXREREKgBv9QF4AwgC/ut6m2+ptfYua22sMeYzYCPOo4F7rbVZrn3uBj4EQoD5rr/imOzOwKVYVOalT2Ve+lTmpU9l7kYVfjpgERERyUtzAYiIiPggJQAiIiI+qMIkABpeuPQZYwYbY2KNMdnGmM5nLG9ujEkxxqxx/b1zxjqV+TkoqMxd6/Q79zBjzLPGmH1n/LavPGNdvuUv584Yc7mrXLcbYx73djwVRYVJANDwwt6wARgELM5n3Q5rbYTr764zlqvMz02+Za7feal65Yzf9jdQZPnLOXCV45vAFUA74AZXecs5qjAJgIYXLn3W2k3W2i3F3V5lfu4KKXP9zr0r3/L3ckwVRRSw3Vr7h7U2HZiJU95yjipMAvAXt3L6NcFGwN4z1p0aRrgRJRheWEoszBiz2hjzkzGmu2uZytxz9DsvPaNcjxrfN8bUci0rqPzl3KlsPaQszAVQbN4cXthXFafM87EfaGqtPWKMiQS+MMaEozIvlrMsc/3O3aSw8sd5nPI8Thk+D4zHueFQOXuOytZDylUCoOGFS19RZV7APmlAmuvzSmPMDqA1KvNiOZsyR79ztylu+Rtj3gW+cn0tqPzl3KlsPaTCPALQ8MJlhzGm7qkOUMaY83HK/A+VuUfpd14KXH0qTvkHTqdMKKD8Szu+Cmo50MoYE2aMCcTpbPmll2OqEMpVC0ARSnN4YQGMMf8AXgfqAl8bY9ZYa/sDlwLPGWMygSzgLmvtUdduKvNzUFCZ63deasYZYyJwmqB3AXcCFFH+cg6stZnGmFHAt4A/8L61NtbLYVUIGgpYRETEB1WYRwAiIiJSfEoAREREfJASABERER+kBEBERMQHKQEQERHxQUoARCSHMSbLNcvdBmPMLGNM5bM4xnunJmsxxjzxl3W/uitWETk3eg1QRHIYY5KstVVdn6cDK621E9xxPBEpW9QCICIF+RloCWCMecjVKrDBGPOAa1kVY8zXxpi1ruVDXMt/NMZ0NsaMBUJcLQrTXeuSXP9+aoy58tSJjDEfGmOuNcb4G2NeMsYsd024c2dpX7SIr6hIIwGKiJsYYyrhzL++wDWh0y1AV5yJWX43xvwEnA/EW2uvcu1T48xjWGsfN8aMstZG5HOKmcAQ4BvX8K69cUYsvA04bq3tYowJApYYYxa6ptgVETdSC4CInCnEGLMGWAHsAaYAlwD/sdYmW2uTgDlAd2A90McY829jTHdr7fESnGc+0MtVyV8BLLbWpgD9gJtcMfwOhOKMqy8ibqYWABE5U8pf79hdkwjlYa3d6moduBJ40XWn/lxxTmKtTTXG/Aj0x2kJmHHqdMB91tpvz/YCRKR41AIgIkVZDAw0xlQ2xlTBmQXvZ2NMQ+CktfZj4GWgUz77ZhhjAgo47kycRwvdcSZ6wfXv3af2Mca0dp1TRNxMLQAiUihr7SpjzIecnt72PWvtamNMf+AlY0w2kIHzDP+vJgPrjDGrrLXD/7JuITAV+NJam37q2EBzYJWr5eEQMNCtFyQigF4DFBER8Ul6BCAiIuKDlACIiIj4ICUAIiIiPkgJgIiIiA9SAiAiIuKDlACIiIj4ICUAIiIiPuj/AWbj4QrJa5LMAAAAAElFTkSuQmCC\n",
"text/plain": [
"