Creating maps with Cartopy
\n", "\n", "\n", "> *DS Python for GIS and Geoscience* \n", "> *October, 2020*\n", ">\n", "> *© 2020, Joris Van den Bossche and Stijn Van Hoey. Licensed under [CC BY-SA 4.0 Creative Commons](https://creativecommons.org/licenses/by-sa/4.0/)* Adapted from material from Phil Elson and Ryan Abernathey (see below).\n", "\n", "---\n", "\n", "# Maps in Scientific Python\n", "\n", "Making maps is a fundamental part of GIS and geoscience research.\n", "Maps differ from regular figures in the following principle ways:\n", "\n", "- Maps require a *projection* of geographic coordinates on the 3D Earth to the 2D space of your figure.\n", "- Maps often include extra decorations besides just our data (e.g. continents, country borders, etc.)\n", "\n", "The maps we have made up to now, for example using the GeoPandas `plot()` method, assume the data can be plotted as is on the figure. This works fine if your data is already in projected coordinates, and has a limited extent (small study area). When mapping data of a larger area of the full globe, properly taking into account the projection becomes much more important!\n", "\n", "In this notebook, we will learn about [Cartopy](https://scitools.org.uk/cartopy/docs/latest/), one of the most common packages for making maps within python.\n", "\n", "### Credit: Phil Elson and Ryan Abernathey\n", "\n", "Lots of the material in this notebook was adopted from https://earth-env-data-science.github.io/intro.html by Ryan Abernathey, which itself was adopted from [Phil Elson](https://pelson.github.io/)'s excellent [Cartopy Tutorial](https://github.com/SciTools/cartopy-tutorial). Phil is the creator of Cartopy and published his tutorial under an [open license](http://www.nationalarchives.gov.uk/doc/open-government-licence/version/3/), meaning that we can copy, adapt, and redistribute it as long as we give proper attribution. **THANKS PHIL AND RYAN!** 👏👏👏" ] }, { "cell_type": "markdown", "metadata": {}, "source": [ "## Background: Projections" ] }, { "cell_type": "markdown", "metadata": {}, "source": [ "### Most of our media for visualization *are* flat\n", "\n", "Our two most common media are flat:\n", "\n", " * Paper\n", " * Screen\n", "\n", "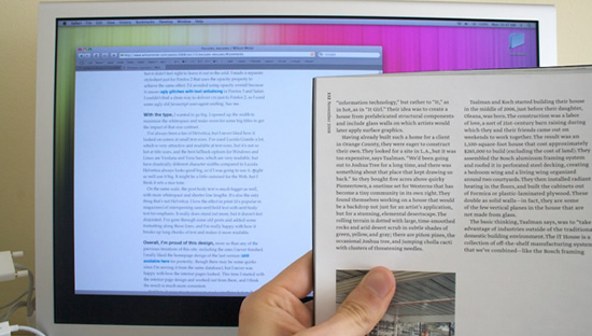\n", "\n", "### [Map] Projections: Taking us from spherical to flat\n", "\n", "A map projection (or more commonly refered to as just \"projection\") is:\n", "\n", "> a systematic transformation of the latitudes and longitudes of locations from the surface of a sphere or an ellipsoid into locations on a plane. [[Wikipedia: Map projection](https://en.wikipedia.org/wiki/Map_projection)].\n", "\n", "### The major problem with map projections\n", "\n", "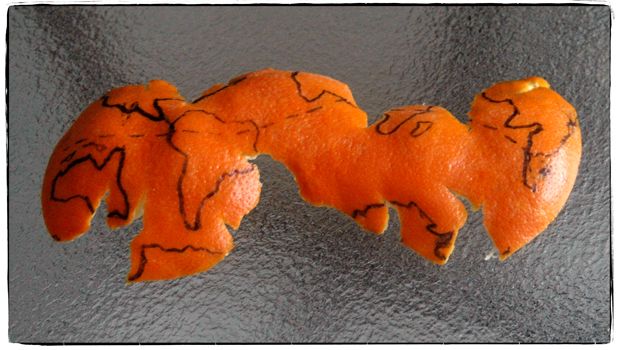\n", "\n", " * The surface of a sphere is topologically different to a 2D surface, therefore we *have* to cut the sphere *somewhere*\n", " * A sphere's surface cannot be represented on a plane without distortion.\n", " \n", "There are many different ways to make a projection, and we will not attempt to explain all of the choices and tradeoffs here. Instead, you can read Phil's [original tutorial](https://github.com/SciTools/cartopy-tutorial/blob/master/tutorial/projections_crs_and_terms.ipynb) for a great overview of this topic.\n", "Instead, we will dive into the more practical sides of Caropy usage." ] }, { "cell_type": "markdown", "metadata": {}, "source": [ "## Introducing Cartopy\n", "\n", "https://scitools.org.uk/cartopy/docs/latest/\n", "\n", "Cartopy makes use of the powerful [PROJ.4](https://proj4.org/), numpy and shapely libraries and includes a programatic interface built on top of Matplotlib for the creation of publication quality maps.\n", "\n", "Key features of cartopy are its object oriented projection definitions, and its ability to transform points, lines, vectors, polygons and images between those projections.\n", "\n", "### Cartopy Projections and other reference systems\n", "\n", "In Cartopy, each projection is a class.\n", "Most classes of projection can be configured in projection-specific ways, although Cartopy takes an opinionated stance on sensible defaults.\n", "\n", "Let's create a Plate Carree projection instance.\n", "\n", "To do so, we need cartopy's crs module. This is typically imported as ``ccrs`` (Cartopy Coordinate Reference Systems)." ] }, { "cell_type": "code", "execution_count": 1, "metadata": {}, "outputs": [], "source": [ "import cartopy.crs as ccrs\n", "import cartopy" ] }, { "cell_type": "markdown", "metadata": {}, "source": [ "Cartopy's projection list tells us that the Plate Carree projection is available with the ``ccrs.PlateCarree`` class: https://scitools.org.uk/cartopy/docs/latest/crs/projections.html\n", "\n", "**Note:** we need to *instantiate* the class in order to do anything projection-y with it!" ] }, { "cell_type": "code", "execution_count": 2, "metadata": {}, "outputs": [ { "data": { "text/html": [ "\n", "\n", "\n", "\n", "<cartopy.crs.PlateCarree object at 0x7fb34d267860>" ], "text/plain": [ "
<cartopy.crs.UTM object at 0x7fb2ddcaaef0>" ], "text/plain": [ "
<xarray.Dataset>\n",
       "Dimensions:  (lat: 89, lon: 180, time: 2000)\n",
       "Coordinates:\n",
       "  * lat      (lat) float32 88.0 86.0 84.0 82.0 80.0 ... -82.0 -84.0 -86.0 -88.0\n",
       "  * lon      (lon) float32 0.0 2.0 4.0 6.0 8.0 ... 350.0 352.0 354.0 356.0 358.0\n",
       "  * time     (time) datetime64[ns] 1854-01-01 1854-02-01 ... 2020-08-01\n",
       "Data variables:\n",
       "    sst      (time, lat, lon) float32 ...\n",
       "Attributes:\n",
       "    climatology:                     Climatology is based on 1971-2000 SST, X...\n",
       "    description:                     In situ data: ICOADS2.5 before 2007 and ...\n",
       "    keywords_vocabulary:             NASA Global Change Master Directory (GCM...\n",
       "    keywords:                        Earth Science > Oceans > Ocean Temperatu...\n",
       "    instrument:                      Conventional thermometers\n",
       "    source_comment:                  SSTs were observed by conventional therm...\n",
       "    geospatial_lon_min:              -1.0\n",
       "    geospatial_lon_max:              359.0\n",
       "    geospatial_laty_max:             89.0\n",
       "    geospatial_laty_min:             -89.0\n",
       "    geospatial_lat_max:              89.0\n",
       "    geospatial_lat_min:              -89.0\n",
       "    geospatial_lat_units:            degrees_north\n",
       "    geospatial_lon_units:            degrees_east\n",
       "    cdm_data_type:                   Grid\n",
       "    project:                         NOAA Extended Reconstructed Sea Surface ...\n",
       "    original_publisher_url:          http://www.ncdc.noaa.gov\n",
       "    References:                      https://www.ncdc.noaa.gov/data-access/ma...\n",
       "    source:                          In situ data: ICOADS R3.0 before 2015, N...\n",
       "    title:                           NOAA ERSSTv5 (in situ only)\n",
       "    history:                         created 07/2017 by PSD data using NCEI's...\n",
       "    institution:                     This version written at NOAA/ESRL PSD: o...\n",
       "    citation:                        Huang et al, 2017: Extended Reconstructe...\n",
       "    platform:                        Ship and Buoy SSTs from ICOADS R3.0 and ...\n",
       "    standard_name_vocabulary:        CF Standard Name Table (v40, 25 January ...\n",
       "    processing_level:                NOAA Level 4\n",
       "    Conventions:                     CF-1.6, ACDD-1.3\n",
       "    metadata_link:                   :metadata_link = https://doi.org/10.7289...\n",
       "    creator_name:                    Boyin Huang (original)\n",
       "    date_created:                    2017-06-30T12:18:00Z (original)\n",
       "    product_version:                 Version 5\n",
       "    creator_url_original:            https://www.ncei.noaa.gov\n",
       "    license:                         No constraints on data access or use\n",
       "    comment:                         SSTs were observed by conventional therm...\n",
       "    summary:                         ERSST.v5 is developed based on v4 after ...\n",
       "    dataset_title:                   NOAA Extended Reconstructed SST V5\n",
       "    data_modified:                   2020-10-03\n",
" DODS_EXTRA.Unlimited_Dimension: timearray([ 88., 86., 84., 82., 80., 78., 76., 74., 72., 70., 68., 66.,\n",
" 64., 62., 60., 58., 56., 54., 52., 50., 48., 46., 44., 42.,\n",
" 40., 38., 36., 34., 32., 30., 28., 26., 24., 22., 20., 18.,\n",
" 16., 14., 12., 10., 8., 6., 4., 2., 0., -2., -4., -6.,\n",
" -8., -10., -12., -14., -16., -18., -20., -22., -24., -26., -28., -30.,\n",
" -32., -34., -36., -38., -40., -42., -44., -46., -48., -50., -52., -54.,\n",
" -56., -58., -60., -62., -64., -66., -68., -70., -72., -74., -76., -78.,\n",
" -80., -82., -84., -86., -88.], dtype=float32)array([ 0., 2., 4., 6., 8., 10., 12., 14., 16., 18., 20., 22.,\n",
" 24., 26., 28., 30., 32., 34., 36., 38., 40., 42., 44., 46.,\n",
" 48., 50., 52., 54., 56., 58., 60., 62., 64., 66., 68., 70.,\n",
" 72., 74., 76., 78., 80., 82., 84., 86., 88., 90., 92., 94.,\n",
" 96., 98., 100., 102., 104., 106., 108., 110., 112., 114., 116., 118.,\n",
" 120., 122., 124., 126., 128., 130., 132., 134., 136., 138., 140., 142.,\n",
" 144., 146., 148., 150., 152., 154., 156., 158., 160., 162., 164., 166.,\n",
" 168., 170., 172., 174., 176., 178., 180., 182., 184., 186., 188., 190.,\n",
" 192., 194., 196., 198., 200., 202., 204., 206., 208., 210., 212., 214.,\n",
" 216., 218., 220., 222., 224., 226., 228., 230., 232., 234., 236., 238.,\n",
" 240., 242., 244., 246., 248., 250., 252., 254., 256., 258., 260., 262.,\n",
" 264., 266., 268., 270., 272., 274., 276., 278., 280., 282., 284., 286.,\n",
" 288., 290., 292., 294., 296., 298., 300., 302., 304., 306., 308., 310.,\n",
" 312., 314., 316., 318., 320., 322., 324., 326., 328., 330., 332., 334.,\n",
" 336., 338., 340., 342., 344., 346., 348., 350., 352., 354., 356., 358.],\n",
" dtype=float32)array(['1854-01-01T00:00:00.000000000', '1854-02-01T00:00:00.000000000',\n",
" '1854-03-01T00:00:00.000000000', ..., '2020-06-01T00:00:00.000000000',\n",
" '2020-07-01T00:00:00.000000000', '2020-08-01T00:00:00.000000000'],\n",
" dtype='datetime64[ns]')[32040000 values with dtype=float32]