{
"metadata": {
"name": ""
},
"nbformat": 3,
"nbformat_minor": 0,
"worksheets": [
{
"cells": [
{
"cell_type": "markdown",
"metadata": {},
"source": [
"#Data Exploration Using Spark\n",
"\n",
"Today, we'll learn how to use [Spark](http://spark.incubator.apache.org/), a framework for large-scale data processing. All of the frameworks that we've used so far (e.g., [Pandas](http://pandas.pydata.org/), R) are designed to be run on a single computer. However, many data sets today are too large to be stored on a single computer. Even when a dataset can be stored on one computer, the data set can often be processed much more quickly using multiple computers. Spark is designed for this purpose: it allows you to concisely describe a program to analyze data on many computers, and hides many of the details of coordinating data analysis on many machines.\n",
"\n",
"If you have problems during the tutorial, checkout the [FAQ](#FAQ) at the bottom of this page. If that doesn't answer your question, beckon a GSI.\n",
"\n",
"Don't forget to fill out the [response form](https://docs.google.com/forms/d/1s8Fwtasunca1AQTGW9SaeTNsFbokGSuG0se_fkIL0K4/viewform)!\n",
"\n",
"\n",
"## Table of Contents\n",
"[Getting Started](#getting_started): How to start a Spark application\n",
"\n",
"[Distributed Data](#distributed_data): How data is stored in-memory across a cluster using Spark\n",
"\n",
"[Spark Operations](#operations): An introduction to Spark functionality\n",
"\n",
" [Basic operations](#operations): How to inspect data you have stored in Spark\n",
" \n",
" [Data parallel operations](#data_parallel): Transforming Spark datasets with operations that are easily parallelized\n",
" \n",
" [Parallelism](#parallelism): Understanding the importance of the number of data partitions and tasks in a Spark job\n",
" \n",
" [Multi-stage operations](#multi_stage): More complicated functionality that requires multiple stages of tasks\n",
"\n",
" [Aggregations](#aggregations): How to aggregate all of the entries in a particular RDD\n",
" \n",
" [Joins](#joins): How to perform Joins with Spark\n",
"\n",
"[Frequently Asked Questions](#FAQ)"
]
},
{
"cell_type": "markdown",
"metadata": {},
"source": [
"\n",
"## Getting Started\n",
"\n",
"We have a Spark cluster up and running for today's class. The cluster includes worker machines, which will perform the data processing, and a master that keeps track of all of the workers. The master runs a web UI that tells you about the cluster on port 8080. Run the code below to print out the URL of the master's UI, and then copy that link into your browser to have a look at the UI."
]
},
{
"cell_type": "code",
"collapsed": false,
"input": [
"# We've setup the notebook so that the hostname of the master is saved\n",
"# as CLUSTER_URL.\n",
"master_ui_address = \"\".join(CLUSTER_URL.split(\"//\")[1].split(\":\")[0])\n",
"print \"Master UI located at %s:8080\" % master_ui_address\n",
"\n",
"application_ui_address = \"http://\" + sc.appName + \":4040\"\n",
"print \"Application UI located at %s\" % application_ui_address"
],
"language": "python",
"metadata": {},
"outputs": []
},
{
"cell_type": "markdown",
"metadata": {},
"source": [
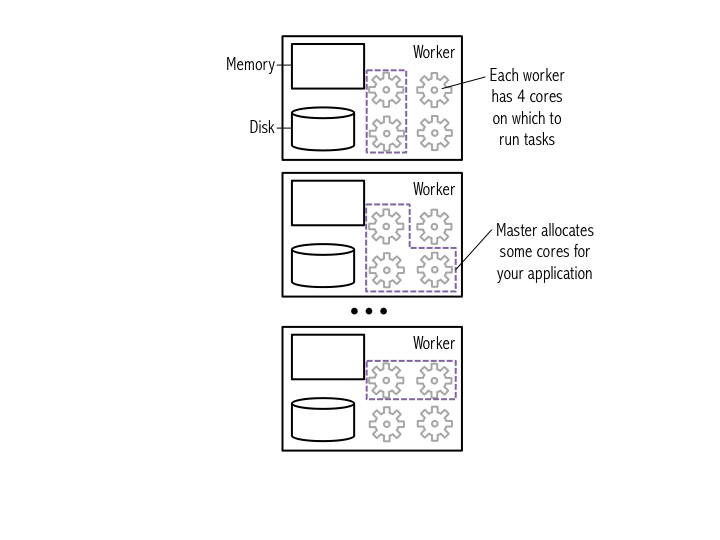
"You start a new Spark application by creating a SparkContext. When the SparkContext is created, it asks the master for some cores to use to do work. The master sets these cores aside just for you; they won't be used for other peoples' applications. The diagram below shows an example cluster, where the cores allocated for an application are outlined in purple.\n",
"\n",
"\n",
"\n",
"We have already started an application for you in the iPython notebook running on the cluster. The `SparkContext` is stored as the `sc` variable. Go back to the master web UI (refresh the page if you already have it open) and look at the list of applications. When we started the `SparkContext` for you, we named your application with the hostname of the machine where your ipython notebook is running; use this to identify your application in the list of \"Running Applications\". Click on the ID of your application and you'll see a list of the machines that were assigned to your application. Next, click \"Application Detail UI\" to get more details on our application. The first page you'll see shows the jobs that you've run so far; there isn't any thing interesting here yet because we haven't run any jobs, but we'll return to this page later.\n"
]
},
{
"cell_type": "markdown",
"metadata": {},
"source": [
"\n",
"## Distributed Data\n",
"\n",
"In this class, when we have analyzed data, we have typically represented a dataset as a list of entries. In Spark, datasets are also represented as a list of entries; the key difference is that now the list is broken up into many different partitions that are each stored on a different machine. Each partition holds a unique subset of the entries in the list. Spark calls data sets that it stores \"Resilient Distributed Datasets\" (RDDs).\n",
"\n",
"One of the defining features of Spark compared to other data analytics frameworks (like Hadoop, which many of you used in CS61C) is that it stores data in memory rather than on disk. This allows Spark applications to run much more quickly, because they aren't slowed by needing to read data from disk. Let's load some data for our Spark application to use.\n",
"\n",
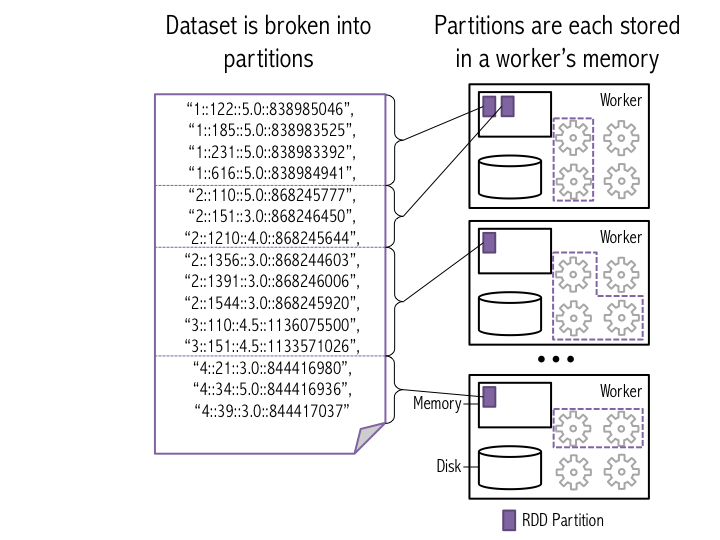
"The figure below illustrates how Spark breaks a list of data entries into partitions that are each stored in memory on a worker.\n",
"\n",
"\n",
"\n",
"To load the data, we'll use `sc.textFile()`, which tells Spark create a new set of input data based on data read from a given input file path (in this case, `movielens/large/ratings.dat`). In this case, the input file path points to a file in Hadoop Distributed File System (HDFS); HDFS stores the data on the disks of machines in the cluster. The second argument to `sc.textFile()` tells Spark how many partitions to break the data into when it stores the data in memory (we'll talk more about this later in the tutorial). Next, we call `cache()` on the new dataset to signal to Spark that this data should be kept in memory (for faster access in the future)."
]
},
{
"cell_type": "code",
"collapsed": false,
"input": [
"# The first argument to textFile is a path to the data in HDFS.\n",
"# The second argument specifies how many pieces to break the file\n",
"# into; we'll talk more about this later in the tutorial.\n",
"raw_ratings = sc.textFile(\"/movielens/large/ratings.dat\", 10)\n",
"# Give our RDD a name so it's easily identifiable in the UI.\n",
"raw_ratings.setName(\"raw ratings\")\n",
"raw_ratings.cache()"
],
"language": "python",
"metadata": {},
"outputs": []
},
{
"cell_type": "markdown",
"metadata": {},
"source": [
" Click on the \"Storage\" tab in your application UI. You'll notice that the new dataset is not yet listed. This is due to a feature of Spark called \"lazy evaluation\": Spark only computes a dataset or a transformation on a dataset when it's necessary to return a result. Here, we haven't asked for any results from the `raw_ratings` dataset, so Spark avoids unnecessary work by not reading in the dataset yet. To force Spark to read in the `raw_ratings` data, we'll count the entries in the dataset. `count()` requires the dataset to compute its result, so now Spark will read the data from HDFS."
]
},
{
"cell_type": "code",
"collapsed": false,
"input": [
"entries = raw_ratings.count()\n",
"print \"%s entries in ratings\" % entries"
],
"language": "python",
"metadata": {},
"outputs": []
},
{
"cell_type": "markdown",
"metadata": {},
"source": [
"Reload the \"Storage\" tab in your application UI. Now you should see the RDD you just created. If you click on the RDD's name, you can see more information about where the RDD is stored: it's been split into ten different pieces (\"partitions\"), which are each stored on one of the workers, similar to the example shown in the diagram above.\n",
"\n",
"One thing that's useful when we have a new dataset is to look at the first few entries to get a sense of what the data looks like. In Spark, we do that using the `take()` command (analogous to the `head()` command in Pandas). The format of each entry is `UserID::MovieID::Rating::Timestamp`."
]
},
{
"cell_type": "code",
"collapsed": false,
"input": [
"# Look at the first 10 items in the dataset.\n",
"raw_ratings.take(10)"
],
"language": "python",
"metadata": {},
"outputs": []
},
{
"cell_type": "markdown",
"metadata": {},
"source": [
"\n",
"## Spark Operations\n",
"\n",
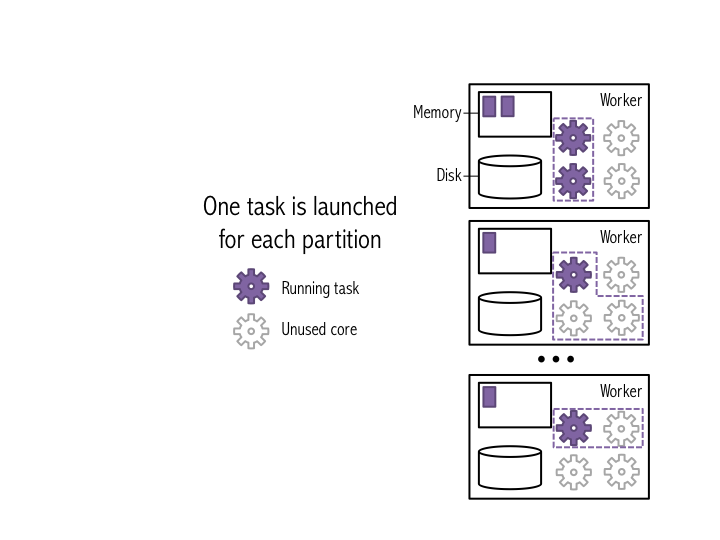
"So far, we've created a distributed dataset that's split into many partitions that are each stored on a single machine in our cluster. Let's look at what happens when we do a basic operation on the dataset. One of the most basic jobs that we can run is the `count()` job that we ran earlier. When you run `count()` on a dataset, a single *stage* of tasks is launched. A *stage* is a group of tasks that all perform the same computation, but on different input data. One task is launched for each partitition, as shown in the example below. A task is a unit of execution that runs on a single machine. In this example, the dataset is broken into 4 partitions, so 4 `count()` tasks are launched.\n",
"\n",
"\n",
"\n",
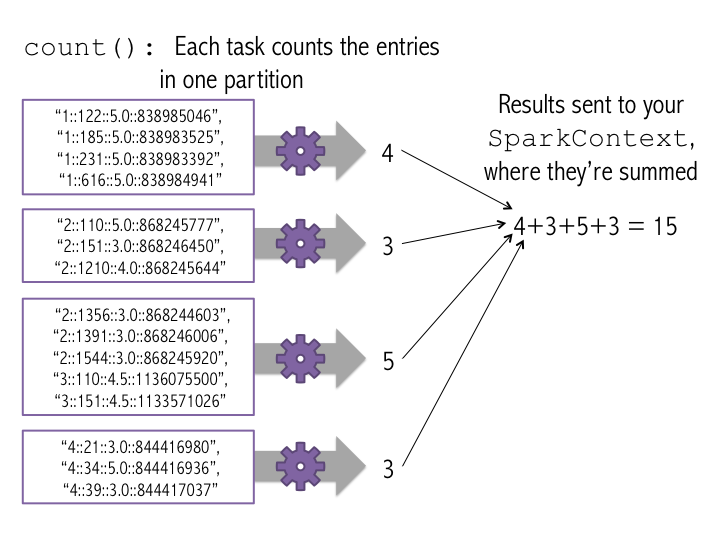
"Each task counts the entries in its partition and sends the result to your SparkContext, which adds up all of the counts, as shown in the figure below.\n",
"\n",
"\n",
"\n",
"The above figures showed what would happen if we ran `count()` on a small example dataset with just 4 partitions. Let's see what happened when we ran `count()` on the `ratings` dataset. Go back to the UI for the application and click on the \"stages\" tab. Under \"Completed Stages,\" click on your `count()` stage from earlier. Scroll to the bottom and you'll see the tasks for the job. You can see the `count()` stage has the same number of tasks (10) as there are partitions of the ratings data set.\n",
"\n",
"Count all of the entries in the ratings dataset again, and go back to the main \"Stages\" tab that summarizes all of the stages that have been run. This page tells you some helpful information about each stage, including the number of tasks in the stage and how long it took. How long did your new `count()` stage take? How long did the old stage take? Can you explain the difference?\n"
]
},
{
"cell_type": "code",
"collapsed": false,
"input": [
"raw_ratings.count()"
],
"language": "python",
"metadata": {},
"outputs": []
},
{
"cell_type": "markdown",
"metadata": {},
"source": [
"\n",
"### Data Parallel Operations\n",
"\n",
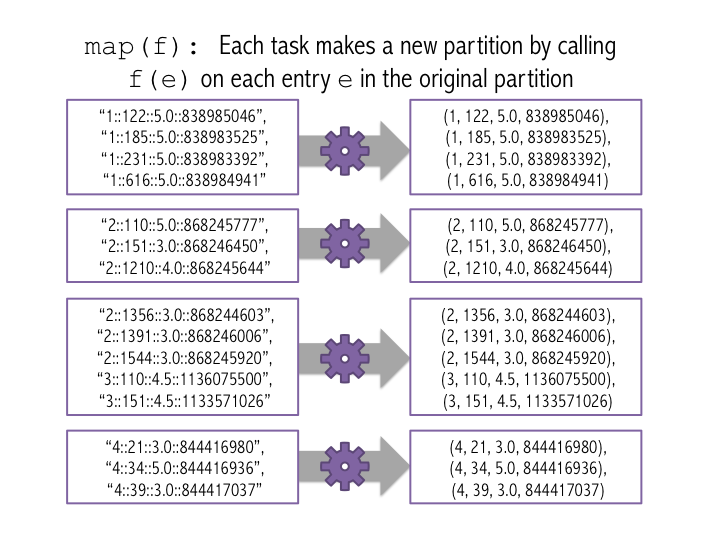
"Many useful data analysis operations can be specified as \"do something to each item in the data set\". These data-parallel operations are convenient because each item in the dataset can be processed individually: the operation on one entry doesn't effect the operations on any of the other entries. Therefore, Spark can easily parallelize the operation: each task does the \"something\" to it's own partition of the dataset. `map(f)` is one such example: it applies a function `f` to each item in the dataset, and outputs the resulting dataset. When we run `map(f)` with Spark, each task applies `f` to all of the entries in a particular partition, and outputs a new partition. We'll use `map(f)` to convert the ratings dataset to a format that's a little easier to manipulate. Having \"`::`\"-separated strings for each data item is not very convenient; let's convert the input data into tuples: `(UserID, MovieID, Rating, Timestamp)`, and convert the IDs, ratings, and timestamps to appropriate data types. The figure below shows how this would work on the smaller data set from the earlier figures. Note that one task is launched for each partition.\n",
"\n",
""
]
},
{
"cell_type": "code",
"collapsed": false,
"input": [
"def get_tuple(entry):\n",
" items = entry.split(\"::\")\n",
" return int(items[0]), int(items[1]), float(items[2]), int(items[3]) \n",
"\n",
"ratings = raw_ratings.map(get_tuple)\n",
"# Set the name of the new RDD, like we did before, so that it's easily\n",
"# identifiable in the UI.\n",
"ratings.setName(\"ratings\")\n",
"ratings.take(10)"
],
"language": "python",
"metadata": {},
"outputs": []
},
{
"cell_type": "markdown",
"metadata": {},
"source": [
"Click on the Storage tab in the UI again. The new dataset is not listed because we haven't asked Spark to `cache()` this dataset. Unless you explicitly ask Spark to save a dataset, it won't keep it in memory; instead, the `ratings` variable stores how to recompute `ratings` if you use it again. We'll be using `ratings` a bunch more time so we want to keep it in memory for quick access, and drop the older `raw_ratings` dataset to clear up space."
]
},
{
"cell_type": "code",
"collapsed": false,
"input": [
"# Cache ratings in memory and call count() to force Spark to bring it into memory.\n",
"ratings.cache()\n",
"ratings.count()\n",
"\n",
"# Remove raw_ratings from memory, since we don't need it anymore.\n",
"raw_ratings.unpersist()"
],
"language": "python",
"metadata": {},
"outputs": []
},
{
"cell_type": "markdown",
"metadata": {},
"source": [
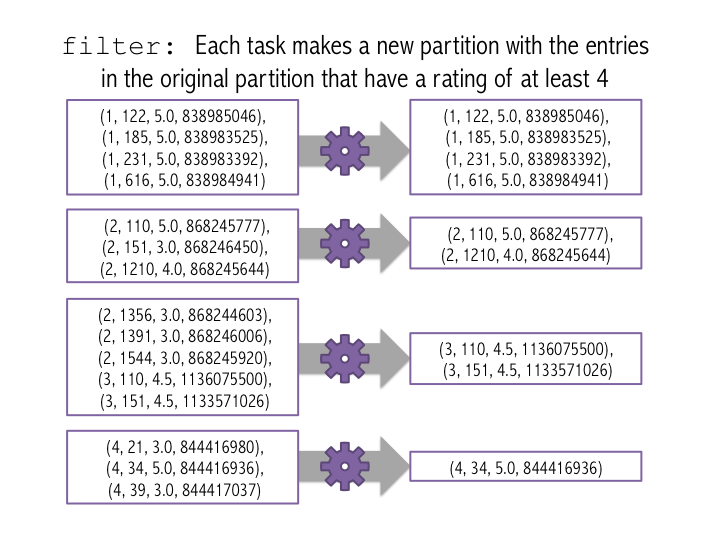
"Another data-parallel operation is `filter(f)`. Filter takes a function `f` that should take an entry and return `True` if the entry should be in the new dataset. `filter(f)` returns a new RDD composed of all of the entries of the original datset for which `f()` returns `True`. Like `map()`, filter can be applied indivudually to each entry in the dataset, so is easily parallelized using Spark. The movie ratings are between 0 and 5; let's count how many movies had a rating of at least 4. The figure below shows how this would work on the small 4-partition dataset.\n",
"\n",
"\n",
"\n"
]
},
{
"cell_type": "code",
"collapsed": false,
"input": [
"# First, create a new RDD make up of the entries of new_ratings\n",
"# that had a rating of at least 4.\n",
"count = ratings.filter(lambda x: x[2] >= 4).count()\n",
"print \"%s entries have ratings of at least 4\" % count"
],
"language": "python",
"metadata": {},
"outputs": []
},
{
"cell_type": "markdown",
"metadata": {},
"source": [
"#### DIY\n",
"\n",
"How many ratings did user 1 submit?"
]
},
{
"cell_type": "code",
"collapsed": false,
"input": [
"### YOUR CODE HERE"
],
"language": "python",
"metadata": {},
"outputs": []
},
{
"cell_type": "markdown",
"metadata": {},
"source": [
"\n",
"\n",
"\n",
"\n",
"
\n",
" \n",
"__To run this solution code, you will need to copy and paste it into the code cell above__\n",
" \n",
"\n",
"user_1_ratings = ratings.filter(lambda x: x[0] == 1).count()\n",
"print \"User 1 submitted %d ratings\" % user_1_ratings\n",
"\n",
"
"
]
},
{
"cell_type": "markdown",
"metadata": {},
"source": [
"What fraction of ratings have a value of 5?"
]
},
{
"cell_type": "code",
"collapsed": false,
"input": [
"### YOUR CODE HERE"
],
"language": "python",
"metadata": {},
"outputs": []
},
{
"cell_type": "markdown",
"metadata": {},
"source": [
"\n",
"\n",
"
\n",
" \n",
"__To run this solution code, you will need to copy and paste it into the code cell above__\n",
" \n",
"\n",
"total_5_ratings = ratings.filter(lambda x: x[2] == 5).count()\n",
"total_ratings = ratings.count()\n",
"print \"Fraction of ratings with a value of 5: %f\" % (total_5_ratings * 1.0 / total_ratings)\n",
"\n",
"
"
]
},
{
"cell_type": "markdown",
"metadata": {},
"source": [
"\n",
"### Parallelism\n",
"\n",
"When we created the ratings dataset, we asked Spark to split the dataset into 10 partitions, which we specified using the second parameter to `sc.textFile()`. Let's look at what happens if we use a different number of partitions. Read in the ratings dataset again using only 5 partitions, and call `count()` as we did the original dataset. How long do you think `count()` will take now that the dataset is stored with half as many partitions?"
]
},
{
"cell_type": "code",
"collapsed": false,
"input": [
"### YOUR CODE HERE\n",
"raw_ratings_fewer_partitions = # Read in the ratings data and split it into 5 partitions\n",
"# Count the entries in the new dataset."
],
"language": "python",
"metadata": {},
"outputs": []
},
{
"cell_type": "markdown",
"metadata": {},
"source": [
"\n",
"\n",
"
\n",
" \n",
"__To run this solution code, you will need to copy and paste it into the code cell above__\n",
" \n",
"\n",
"# Read in the ratings data and split it into 5 partitions\n",
"raw_ratings_fewer_partitions = sc.textFile(\"/movielens/large/ratings.dat\", 5)\n",
"# Count the entries in the new dataset.\n",
"print raw_ratings_fewer_partitions.count()\n",
"\n",
"
"
]
},
{
"cell_type": "markdown",
"metadata": {},
"source": [
"Can you explain the different in times between the count we did on this dataset and the count on the dataset with 10 partitions? The number of partitions your data is split into and correspondingly, the number of tasks in each stage can have a big impact on how quickly your job runs. You'll explore this more in homework 3."
]
},
{
"cell_type": "markdown",
"metadata": {},
"source": [
"\n",
"### Multi-stage Jobs\n",
"\n",
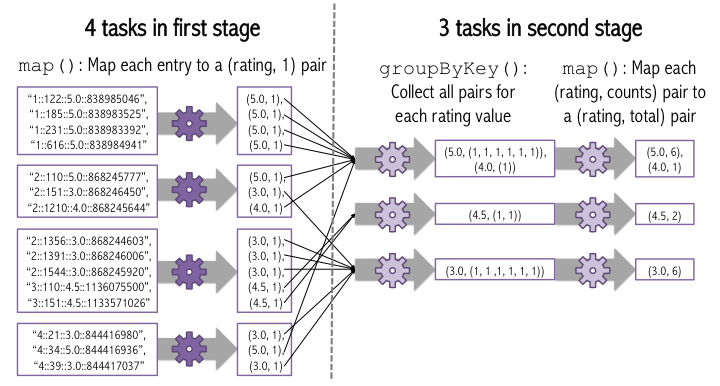
"So far, we've focused on simple, data-parallel operations, where we have a single stage of tasks. A stage is a group of tasks that all do the same thing, but to different partitions of the dataset. Many types of data analysis require *multiple* stages of tasks. As an example of such an operation, let's count the number of entries with each rating value.\n",
"\n",
"The basic idea of how this will work is that first, we do a data-parallel operation where for a particular entry, we return the number of entries with each rating value. So, for each entry, we'll return `(rating, 1)`, where `rating` is the rating in the entry. Now, each task has a bunch of `(rating, 1)` pairs, for different ratings, so the counts for a particular rating (e.g., for rating 5) are spread across a bunch of different tasks on different machines. We need to aggregate the counts for each rating. We'll do this using a \"shuffle\", where all of the counts for a particular rating get sent to a single machine that can aggregate them. The figure below shows how this will work.\n",
"\n",
"\n",
"\n",
"To write this computation in Spark, we first do a `map()`, similar to what we did earlier, to get the `(rating, 1)` pairs. Then, we use `groupByKey()` to group all of the pairs for a singe rating. `groupByKey()` returns a list of `(key, values)` pairs, where `values` is a list of values for that key. Finally, we call `map()` to add up all of the values for each key. Note that the Spark transformation operations (e.g., `map()`, `groupByKey()`, `filter()`) all return a new RDD, so they can be chained together, as we do in the example below."
]
},
{
"cell_type": "code",
"collapsed": false,
"input": [
"def add_counts(entry):\n",
" rating = entry[0]\n",
" counts = entry[1]\n",
" return (rating, sum(counts))\n",
"\n",
"rating_counts = ratings.map(lambda x: (x[2], 1))\n",
"aggregated_counts_rdd = rating_counts.groupByKey().map(add_counts)\n",
"print aggregated_counts_rdd"
],
"language": "python",
"metadata": {},
"outputs": []
},
{
"cell_type": "markdown",
"metadata": {},
"source": [
"Remember that Spark uses lazy evaluation: since we haven't asked Spark to do anything with the `aggregated_counts_rdd` dataset, it hasn't computed it yet. Spark has just created a RDD object that stores how to compute `aggregated_counts_rdd` if we need it in the future. In this case, the resulting `aggregated_counts_rdd` dataset will be small, so we want to just return the dataset as a Python list. We can do this using the `collect()` function, which is like `take(x)` except that it returns the entire dataset rather than just the first `x` entries."
]
},
{
"cell_type": "code",
"collapsed": false,
"input": [
"aggregated_counts_list = aggregated_counts_rdd.collect()\n",
"print aggregated_counts_list"
],
"language": "python",
"metadata": {},
"outputs": []
},
{
"cell_type": "markdown",
"metadata": {},
"source": [
"We can use matplotlib to plot the results, similar to what we've done earlier in the class."
]
},
{
"cell_type": "code",
"collapsed": false,
"input": [
"import matplotlib.pyplot as plot\n",
"# Magic command to make matplotlib and ipython play nicely together.\n",
"%matplotlib inline\n",
"width = 0.3\n",
"rating_values = [x[0] - width / 2 for x in aggregated_counts_list]\n",
"counts = [x[1] for x in aggregated_counts_list]\n",
"# The bar() function takes 2 lists: one list of x-coordinates of the left\n",
"# side of each bar, and one list of bar heights.\n",
"plot.bar(rating_values, counts, width)"
],
"language": "python",
"metadata": {},
"outputs": []
},
{
"cell_type": "markdown",
"metadata": {},
"source": [
"#### DIY\n",
"\n",
"We've done a lot of work on the ratings dataset. Now, it's time for you to do some processing a new dataset that stores information about each movie. The movie dataset is stored at `/movielens/large/movies.dat` and each entry is formatted as `MovieID::Title::Genres`. Read this dataset into memory and convert each entry to a tuple where the movie ID is an integer, the title is a String, and the genre is a list of strings. How many total movies are there? (response form)"
]
},
{
"cell_type": "code",
"collapsed": false,
"input": [
"### YOUR CODE HERE\n",
"count = # Count all of the entries in the movies dataset\n",
"print \"Number of movies: \", count"
],
"language": "python",
"metadata": {},
"outputs": []
},
{
"cell_type": "markdown",
"metadata": {},
"source": [
"\n",
"\n",
"
\n",
" \n",
"__To run this solution code, you will need to copy and paste it into the code cell above__\n",
" \n",
"\n",
"def get_movie_tuple(entry):\n",
" items = entry.split(\"::\")\n",
" movieId = int(items[0])\n",
" # Tip: Don't try to cast the title to a string! It will result in a unicode error\n",
" # for some movies with accented letters.\n",
" title = items[1]\n",
" genres = items[2].split(\"|\")\n",
" return (movieId, title, genres)\n",
"\n",
"movies = sc.textFile(\"/movielens/large/movies.dat\", 10).map(get_movie_tuple)\n",
"count = movies.count() # Count all of the entries in the movies dataset\n",
"print \"Number of movies: \", count\n",
"\n",
"
"
]
},
{
"cell_type": "markdown",
"metadata": {},
"source": [
"How many movies are there for each genre? You may find it useful to use Spark's `flatMap()` function, which is like `map()` except that the provided function maps each input item maps to a list containing 0 or more output items (the FAQ includes [more description of the `flatMap()` function](#flat_map)). We've included a `plot_bars()` function for you that accepts a list of `(genre_name, count)` pairs and will make a bar graph."
]
},
{
"cell_type": "code",
"collapsed": false,
"input": [
"def plot_bars(genre_counts):\n",
" \"\"\" genre_counts should be a list of (genre_name, count) pairs. \"\"\"\n",
" x_coords = range(len(genre_counts))\n",
" genre_names = [x[0] for x in genre_counts]\n",
" counts = [x[1] for x in genre_counts]\n",
" width = 0.8\n",
" plot.bar(x_coords, counts, width)\n",
" plot.xlabel(\"Genre\")\n",
" plot.ylabel(\"Number of Movies\")\n",
" plot.xticks([x + width/2.0 for x in x_coords], genre_names, rotation='vertical')\n",
"\n",
"### YOUR CODE HERE"
],
"language": "python",
"metadata": {},
"outputs": []
},
{
"cell_type": "markdown",
"metadata": {},
"source": [
"\n",
"\n",
"
\n",
" \n",
"__To run this solution code, you will need to copy and paste it into the code cell above__\n",
" \n",
"\n",
"# RDD with (genre, 1) entries for each time a particular genre appears in an\n",
"# entry of movies.\n",
"all_genre_counts = movies.flatMap(lambda x: [(genre, 1) for genre in x[2]])\n",
"# Group all of the \"1\" counts for each genre and add then up.\n",
"movies_per_genre = all_genre_counts.groupByKey().map(lambda x: (x[0], sum(x[1])))\n",
"# If you print movies_per_genre, it's just an RDD: a python structure that holds information about where the\n",
"# data is stored in the cluster. We can use collect() to collect the data set on a single machine.\n",
"print \"RDD: \", movies_per_genre\n",
"collected_movies_per_genre = movies_per_genre.collect()\n",
"print \"Collected dataset:\", collected_movies_per_genre\n",
"# Get the movies_per_genre dataset as a Python list (rather than a distributed dataset)\n",
"# so that we can graph it locally.\n",
"plot_bars(movies_per_genre.collect())\n",
"\n",
"
"
]
},
{
"cell_type": "markdown",
"metadata": {},
"source": [
"So far, we've used `groupByKey()` when we want to combine all of the values for a particular key. Recall that `groupByKey()` collects all of the values for each key in one dataset. Then, we used a subsequent `map()` call to aggregate all of the values. However, this isn't very efficient; often, we don't need all of the values at once. Instead, we can often use incrementally *reduce* the set of values for each key. We do this by specifying a function `f` that takes two values and combines them, and calling `reduceByKey(f)` instead of `groupByKey()`. Spark keeps using `f` to combine pairs of values for the same key until there is only 1 value left for each key. Because Spark can incrementally combine pairs of values for a particular key, so that it never has to store all of the values for a key at one time. Let's use `reduceByKey` to more efficiently count the number of ratings with each ratings value."
]
},
{
"cell_type": "code",
"collapsed": false,
"input": [
"# The function you give to reduceByKey should take two values and produce\n",
"# a new value. Note that the datatype of the two input values and the output\n",
"# value need to be the same.\n",
"def add_two_counts(count1, count2):\n",
" return count1 + count2\n",
"\n",
"rating_counts = ratings.map(lambda x: (x[2], 1))\n",
"aggregated_counts_rdd = rating_counts.reduceByKey(add_two_counts)\n",
"print aggregated_counts_rdd.collect()"
],
"language": "python",
"metadata": {},
"outputs": []
},
{
"cell_type": "markdown",
"metadata": {},
"source": [
"This dataset is not large enough to notice a significant time improvement between the two implementations, but it can make a big difference for larger datasets. Use `reduceByKey` to write your code to count the number of movies for each genre more efficiently."
]
},
{
"cell_type": "code",
"collapsed": false,
"input": [
"### YOUR CODE HERE"
],
"language": "python",
"metadata": {},
"outputs": []
},
{
"cell_type": "markdown",
"metadata": {},
"source": [
"\n",
"\n",
"
\n",
" \n",
"__To run this solution code, you will need to copy and paste it into the code cell above__\n",
" \n",
"\n",
"movies_per_genre = all_genre_counts.reduceByKey(add_two_counts)\n",
"collected_movies_per_genre = movies_per_genre.collect()\n",
"print \"Collected dataset:\", collected_movies_per_genre\n",
"\n",
"
"
]
},
{
"cell_type": "markdown",
"metadata": {},
"source": [
"\n",
"### Aggregations\n",
"\n",
"We have already seen a two ways to aggregate all of the entries in a particular dataset: `count()`, which counts all of the entries, and `collect()`, which returns the entire RDD as a Python list. One more useful function for aggregating data in a particular dataset is the `reduce` function. `reduce` works similarly to `reduceByKey`: it takes a function `f` and uses that function to incrementally combine values. The difference between `reduce` and `reduceByKey` is that reduce combines *all* of the entries in a particular dataset -- not just the entries for a particular key. `reduce` will return a single value, whereas `reduceByKey` returns a new RDD with one entry for each key. Let's use `reduce` to compute the average rating."
]
},
{
"cell_type": "code",
"collapsed": false,
"input": [
"ratings_total = ratings.map(lambda x: x[2]).reduce(lambda x, y: x + y)\n",
"average_rating = ratings_total * 1.0 / ratings.count()\n",
"print \"Average rating:\", average_rating"
],
"language": "python",
"metadata": {},
"outputs": []
},
{
"cell_type": "markdown",
"metadata": {},
"source": [
"#### DIY\n",
"\n",
"Use `reduce` to count the average number of genres that a movie is classified into."
]
},
{
"cell_type": "code",
"collapsed": false,
"input": [
"### YOUR CODE HERE"
],
"language": "python",
"metadata": {},
"outputs": []
},
{
"cell_type": "markdown",
"metadata": {},
"source": [
"\n",
"\n",
"
\n",
" \n",
"__To run this solution code, you will need to copy and paste it into the code cell above__\n",
" \n",
"\n",
"total_genres = movies.map(lambda x: len(x[2])).reduce(lambda x, y: x + y)\n",
"print \"Average genres per movie: %f\" % (total_genres * 1.0 / movies.count())\n",
"\n",
"
"
]
},
{
"cell_type": "markdown",
"metadata": {},
"source": [
"\n",
"### Joins\n",
"\n",
"Spark also supports joins. Joins operate on two data sets, where the entries in each dataset are (key, value) pairs. `d1.join(d2)` returns all pairs `(k, (v1, v2))` such that `(k, v1)` was in `d1` and `(k, v2)` was in `d2`. As an example of a join, let's compute the number of times that each movie was rated. First, we'll compute the number of times that each movie was rated using the ratings dataset, and then we'll use a join to get the movie names from the movies dataset."
]
},
{
"cell_type": "code",
"collapsed": false,
"input": [
"# YOUR CODE HERE\n",
"# YOUR CODE HERE: Create a dataset of (movieID, number of ratings) pairs.\n",
"ratings_per_movie = # YOUR CODE HERE\n",
"\n",
"# YOUR CODE HERE: join average_ratings with movies to get a dataset with movie names and average ratings."
],
"language": "python",
"metadata": {},
"outputs": []
},
{
"cell_type": "markdown",
"metadata": {},
"source": [
"\n",
"\n",
"
\n",
" \n",
"__To run this solution code, you will need to copy and paste it into the code cell above__\n",
" \n",
"\n",
"# Create a dataset of (movieID, number of ratings) pairs.\n",
"ratings_per_movie = ratings.map(lambda x: (x[1], 1)).reduceByKey(lambda x,y: x+y)\n",
"\n",
"# Join average_ratings with movies to get a dataset with movie names and average ratings.\n",
"ratings_with_names = movies.map(lambda x: (x[0], x[1])).join(ratings_per_movie)\n",
"print ratings_with_names.take(10)\n",
"\n",
"
"
]
},
{
"cell_type": "markdown",
"metadata": {},
"source": [
"#### DIY\n",
"\n",
"Which 10 movies have the most ratings? You may want to use the `sortByKey()` function, which expects to be called on an RDD composed of (key, value) pairs and sorts them by key. `sortByKey()` takes an optional parameter describing whether the keys should be sorted in ascending order."
]
},
{
"cell_type": "code",
"collapsed": false,
"input": [
"### YOUR CODE HERE."
],
"language": "python",
"metadata": {},
"outputs": []
},
{
"cell_type": "markdown",
"metadata": {},
"source": [
"\n",
"\n",
"
\n",
" \n",
"__To run this solution code, you will need to copy and paste it into the code cell above__\n",
" \n",
"\n",
"# map transforms ratings_with_names into an RDD where the key is the number of ratings\n",
"# and the value is a 2-item tuple with (movie name, number of ratings). We reformat the\n",
"# dataset in this way so that we can use sortByKey.\n",
"sorted_ratings = ratings_with_names.map(lambda x: (x[1][1], (x[1][0], x[0]))).sortByKey(False)\n",
"sorted_ratings.take(10)\n",
"\n",
"
"
]
},
{
"cell_type": "markdown",
"metadata": {},
"source": [
"Gosh these movies are old! Make a bar chart showing the number of movies for each year. You'll need to parse the year out of the movie title."
]
},
{
"cell_type": "code",
"collapsed": false,
"input": [
"### YOUR CODE HERE"
],
"language": "python",
"metadata": {},
"outputs": []
},
{
"cell_type": "markdown",
"metadata": {},
"source": [
"\n",
"\n",
"
\n",
" \n",
"__To run this solution code, you will need to copy and paste it into the code cell above__\n",
" \n",
"\n",
"import re\n",
"\n",
"def get_year_count(entry):\n",
" movie_name = entry[1]\n",
" # Extract the movie year, which is in parentheses.\n",
" year = re.search(\"\\((\\d+)\\)\", movie_name).group(1)\n",
" return (year, 1)\n",
"\n",
"# Similar to the old plot_bars function, except that the figure size is set to\n",
"# be wider so that we can see all of the years. It's fine to use the function\n",
"# we provided for you; your plot just won't look as nice :).\n",
"def plot_wide_bars(genre_counts):\n",
" \"\"\" genre_counts should be a list of (genre_name, count) pairs. \"\"\"\n",
" x_coords = range(len(genre_counts))\n",
" genre_names = [x[0] for x in genre_counts]\n",
" counts = [x[1] for x in genre_counts]\n",
" width = 0.8\n",
" plot.figure(figsize=(16,6))\n",
" plot.bar(x_coords, counts, width)\n",
" plot.xlabel(\"Genre\")\n",
" plot.ylabel(\"Number of Movies\")\n",
" plot.xticks([x + width/2.0 for x in x_coords], genre_names, rotation='vertical')\n",
"\n",
"year_counts_rdd = movies.map(get_year_count).reduceByKey(lambda x, y: x + y).sortByKey()\n",
"year_counts = year_counts_rdd.collect()\n",
"\n",
"plot_wide_bars(year_counts)\n",
"\n",
"
"
]
},
{
"cell_type": "markdown",
"metadata": {},
"source": [
"\n",
"## Frequently Asked Questions\n",
"\n",
"### How do I get to the UI?\n",
"\n",
"The UI for the Spark master is on port 8080, and the hostname is stored as part of the `CLUSTER_URL` variable pre-loaded into this notebook. From the master UI, you can find the link to your application's UI.\n",
"\n",
"### What are all of the operations I can do on a Spark dataset (RDD)?\n",
"\n",
"[This Page](http://spark.apache.org/docs/0.9.0/api/pyspark/index.html) lists all of the operations you can do on a Spark RDD. Spark also has a Scala API (Scala is a programming language similar to Java); the [documentation for the Scala functions](http://spark.apache.org/docs/0.9.0/scala-programming-guide.html) is sometimes more helpful, and the Python functions work in the same way.\n",
"\n",
"### How do I use matplotlib?\n",
"\n",
"There are lots of good examples on the [matplotlib website](http://matplotlib.org/index.html). For example, [this page](http://matplotlib.org/examples/pylab_examples/simple_plot.html) shows how to plot a single line.\n",
"\n",
"### Why am I getting an OutOfMemoryError?\n",
"\n",
"If you get an error that looks like: `org.apache.spark.SparkException: Job aborted: Exception while deserializing and fetching task: java.lang.OutOfMemoryError: Java heap space`, it probably means that you've tried to collect too much data on the machine where Python is running. This is likely to happen if you do `collect()` on a large dataset. The best way to remedy this problem is to restart your iPython notebook (go to the main server, at port 8888 of the machine you were assigned, click \"Shutdown\" on your notebook, and then open it again) and don't do `collect()` on a large dataset.\n",
"\n",
"Curious why you're getting a Java error when your program is written in Python? Spark is mostly written in Java (and Scala, a language built on top of Java). We're using `pyspark` here, which uses a translation layer to translate between Python and Java. Your Python `SparkContext` object is backed by a Java `SparkContext` object; all operations you run on Spark datasets are passsed through this Java object. So, if you try to collect a result that's too large, the Java Virtual Machine that's running the Java `SparkContext` runs out of memory.\n",
"\n",
"### Python / Spark is giving me a crazy weird error!\n",
"\n",
"Spark is mostly written in Scala and Java, and the Python version of the code (\"pyspark\") hooks into the Java implementation in a way that can make error messages very difficult to understand. If you get a hard-to-understand error when you run a Spark operation, we recommend first narrowing down the error so that you know exactly which operation caused the error. For example, if `rdd.groupByKey().map(lambda x: x[1])` fails with an error, separate the `groupByKey()` and `map()` calls onto separate lines so you know which one is causing the error. Next, double check the function signature to make sure you're passing the right arguments. Pyspark can fail with a weird error if a RDD operation is given the wrong number or type of arguments. If you're still stumped, try using `take(10)` to print out the first 10 entries in the dataset you're calling the RDD operation on. Make sure the function you're calling and the arguments you're passing in make sense given the format of the input dataset.\n",
"\n",
"\n",
"### Can you explain more about how `flatMap()` works?\n",
"\n",
"Let's look at an example: suppose you have an RDD where each entry lines of text in a book, and you want to make a new RDD where each entry is a single word. You could use `flatMap()` to do this as follows:"
]
},
{
"cell_type": "code",
"collapsed": false,
"input": [
"lines_in_book = [\n",
" \"I am Sam\",\n",
" \"I am Sam\",\n",
" \"Sam I am\",\n",
" \"Do you like\",\n",
" \"green eggs and ham?\"]\n",
"# sc.parallelize turns a Python list into an RDD.\n",
"lines_in_book_rdd = sc.parallelize(lines_in_book)\n",
"\n",
"# Notice that here, the function passed to flat map will return a list.\n",
"words_rdd = lines_in_book_rdd.flatMap(lambda x: x.split(\" \"))\n",
"\n",
"print words_rdd.collect()"
],
"language": "python",
"metadata": {},
"outputs": []
},
{
"cell_type": "markdown",
"metadata": {},
"source": [
"The resulting RDD will have a list of words. The function we passed into `flatMap` returned a list of words for each entry in the original RDD, and `flatMap` combines all of these lists of words into a single list. Let's do this same thing with `map` to see what's different."
]
},
{
"cell_type": "code",
"collapsed": false,
"input": [
"list_of_words_rdd = lines_in_book_rdd.map(lambda x: x.split(\" \"))\n",
"print list_of_words_rdd.collect()"
],
"language": "python",
"metadata": {},
"outputs": []
},
{
"cell_type": "markdown",
"metadata": {},
"source": [
"Notice that now the resulting RDD has a list of lists.\n",
"\n",
"Another way to think about this is that `map()` always returns a new RDD with the same number of entries as the original RDD: each entry in the original RDD is mapped to one entry in the new RDD. With `flatMap()`, each entry in the original RDD maps to a list of 0 or more entries, so the new RDD isn't necessarily the same size as the old RDD (it might be larger or smaller).\n",
"\n",
"### How do I save my iPython notebook that's hosted in the cluster?\n",
"\n",
"Go to File > Download as and then select how you'd like to download your notebook (probably as an iPython notebook)."
]
}
],
"metadata": {}
}
]
}