---
title: "Practical R: R Markdown"
author: Abhijit Dasgupta
date: BIOF 339
---
```{r setup, include=FALSE, child=here::here('slides/templates/setup.Rmd')}
```
```{r setup1, include=FALSE}
library(pander)
library(emo)
```
layout: true
---
class: middle, center, inverse
# RMarkdown
---
---
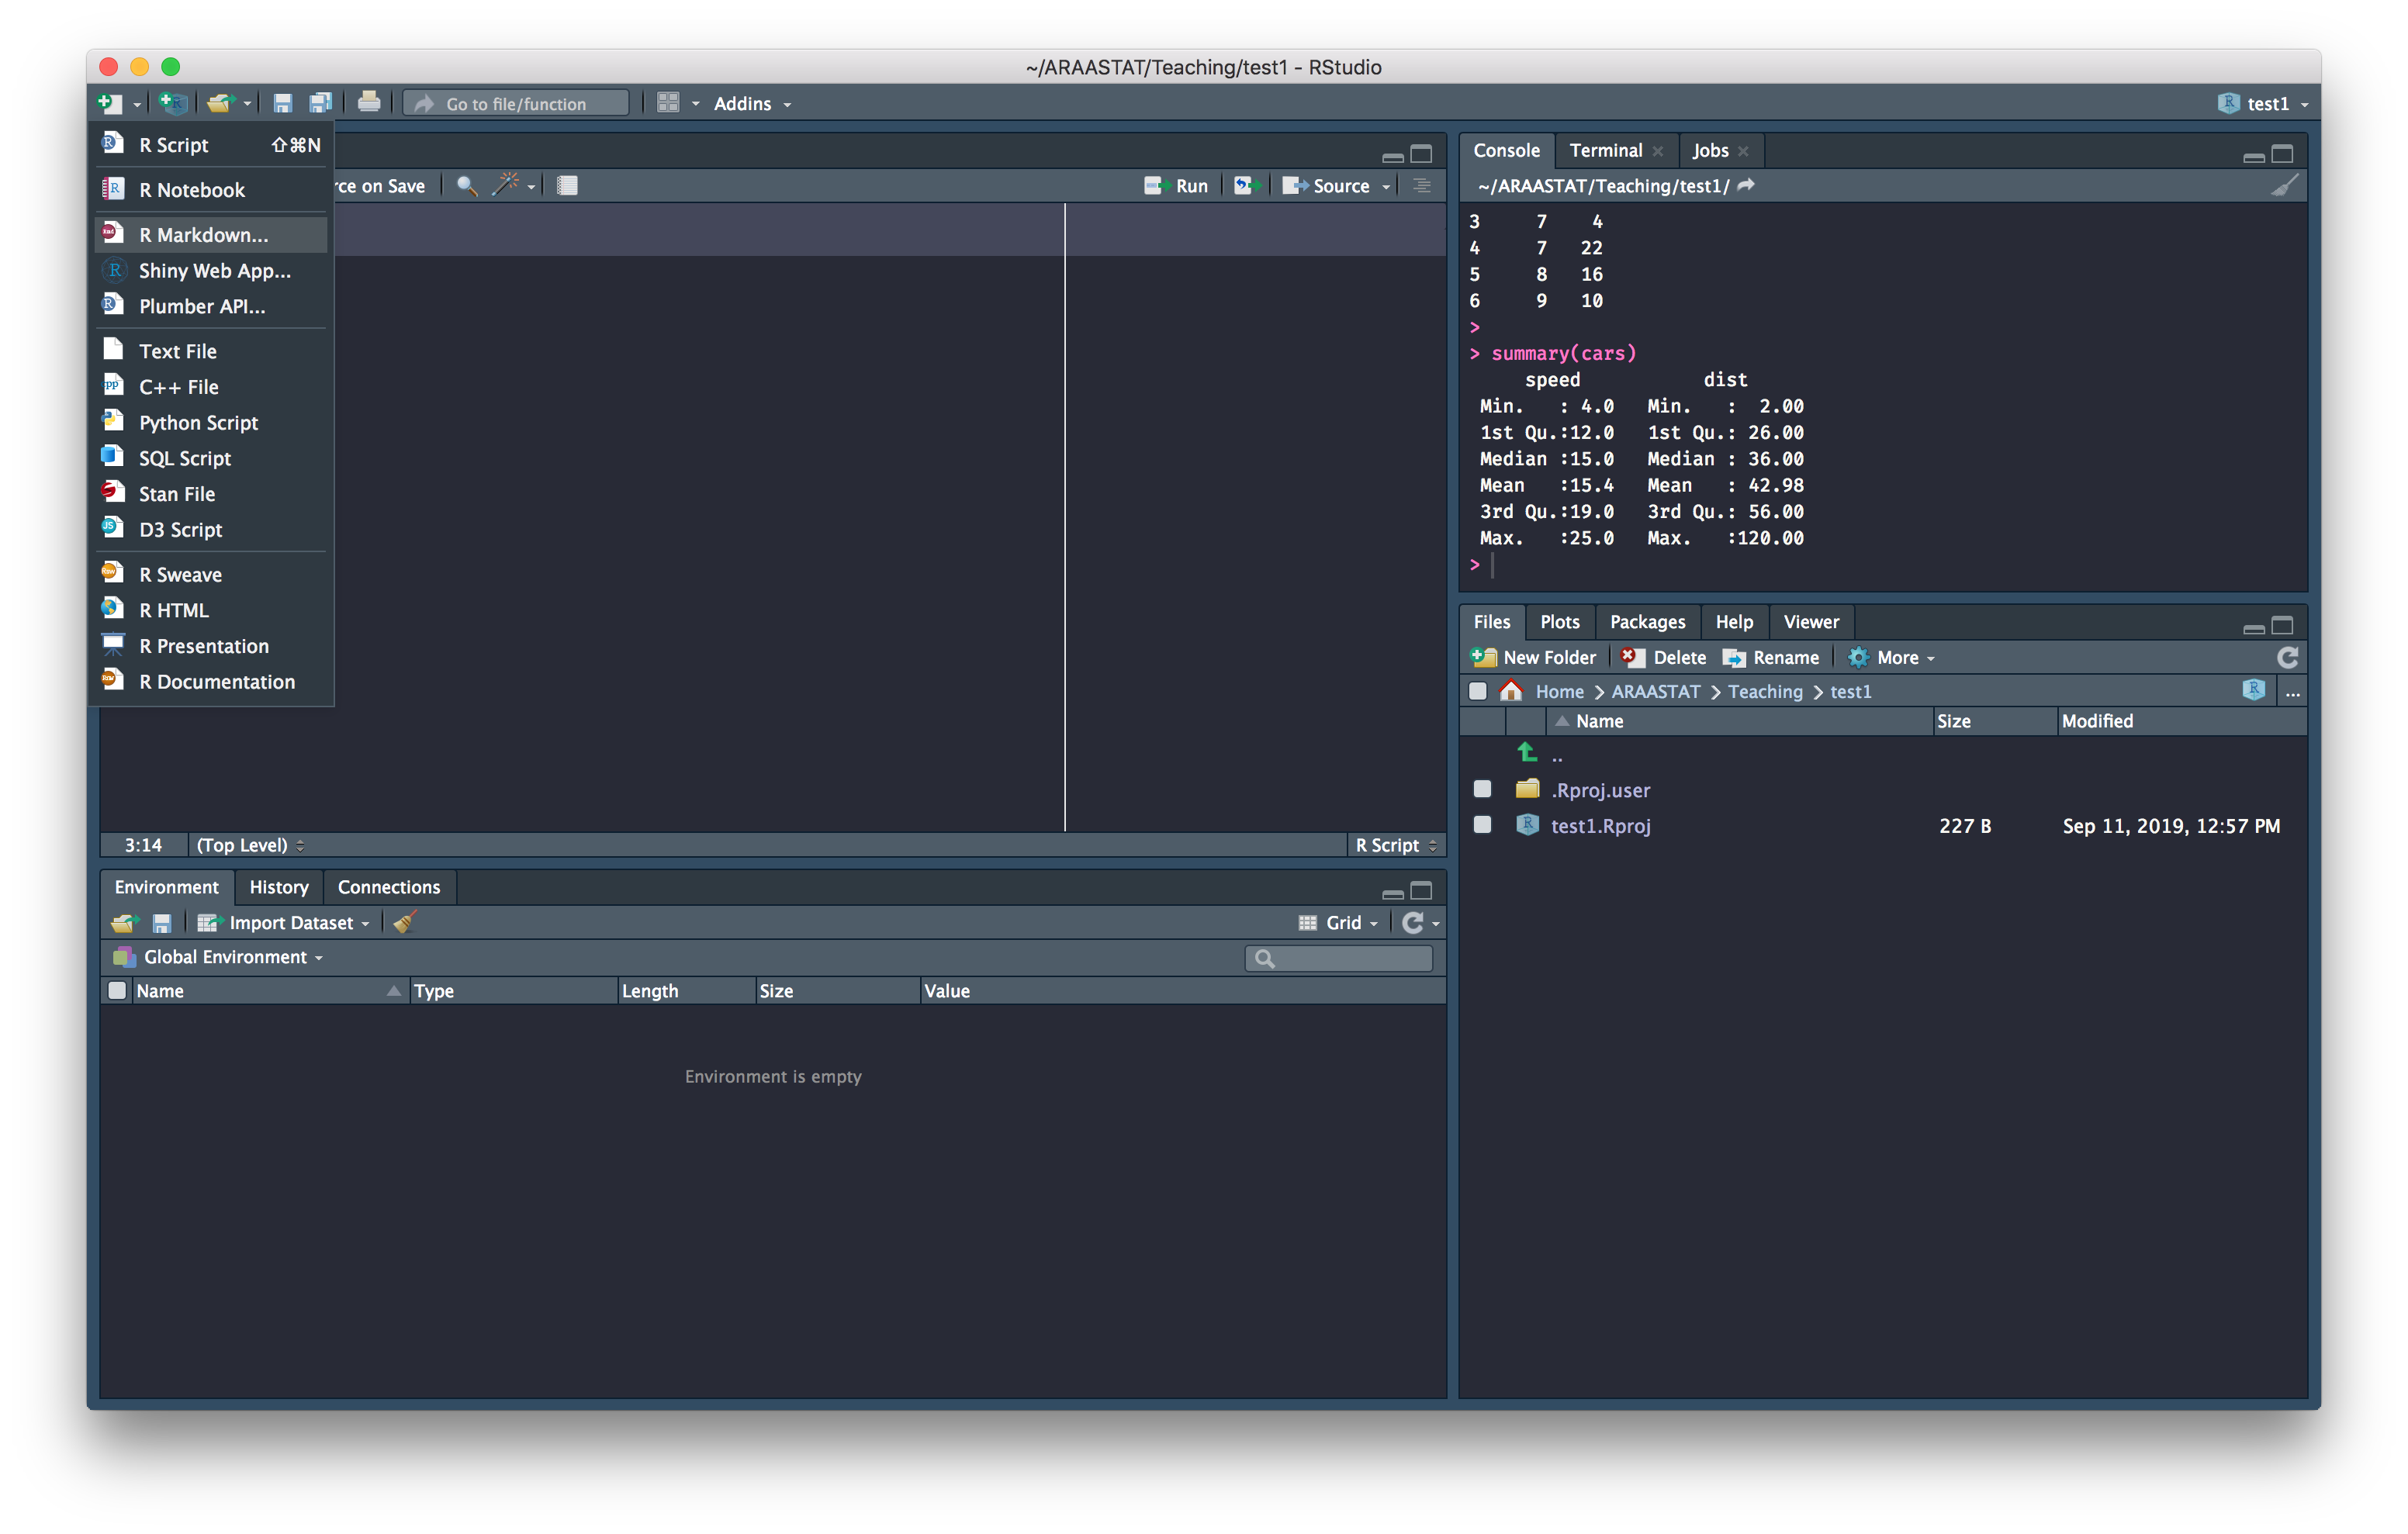
## R Markdown
.left-column30[
+ There are some choices you might need to make
+ Document is like a paper
+ Presentation is like PowerPoint
+ Shiny is an interactive web app developed in R. May talk about it towards the end
+ Various packages also provide templates for RMarkdown documents
]
.right-column30[
]
---
.left-column30[
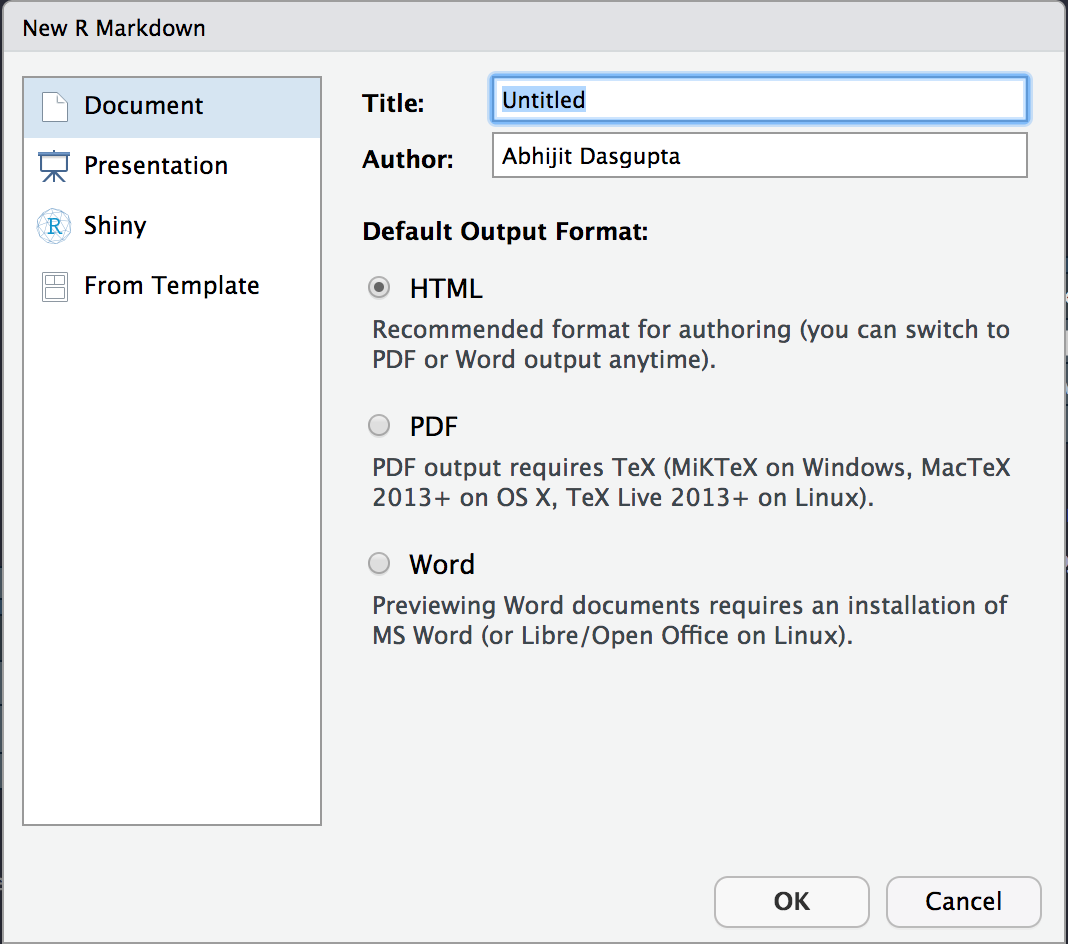
+ Elements on the right are output formats
- Documents produce Word, PDF or HTML
- Presentations produce PowerPoint, PDF, or HTML
]
.right-column30[

]
---
```
---
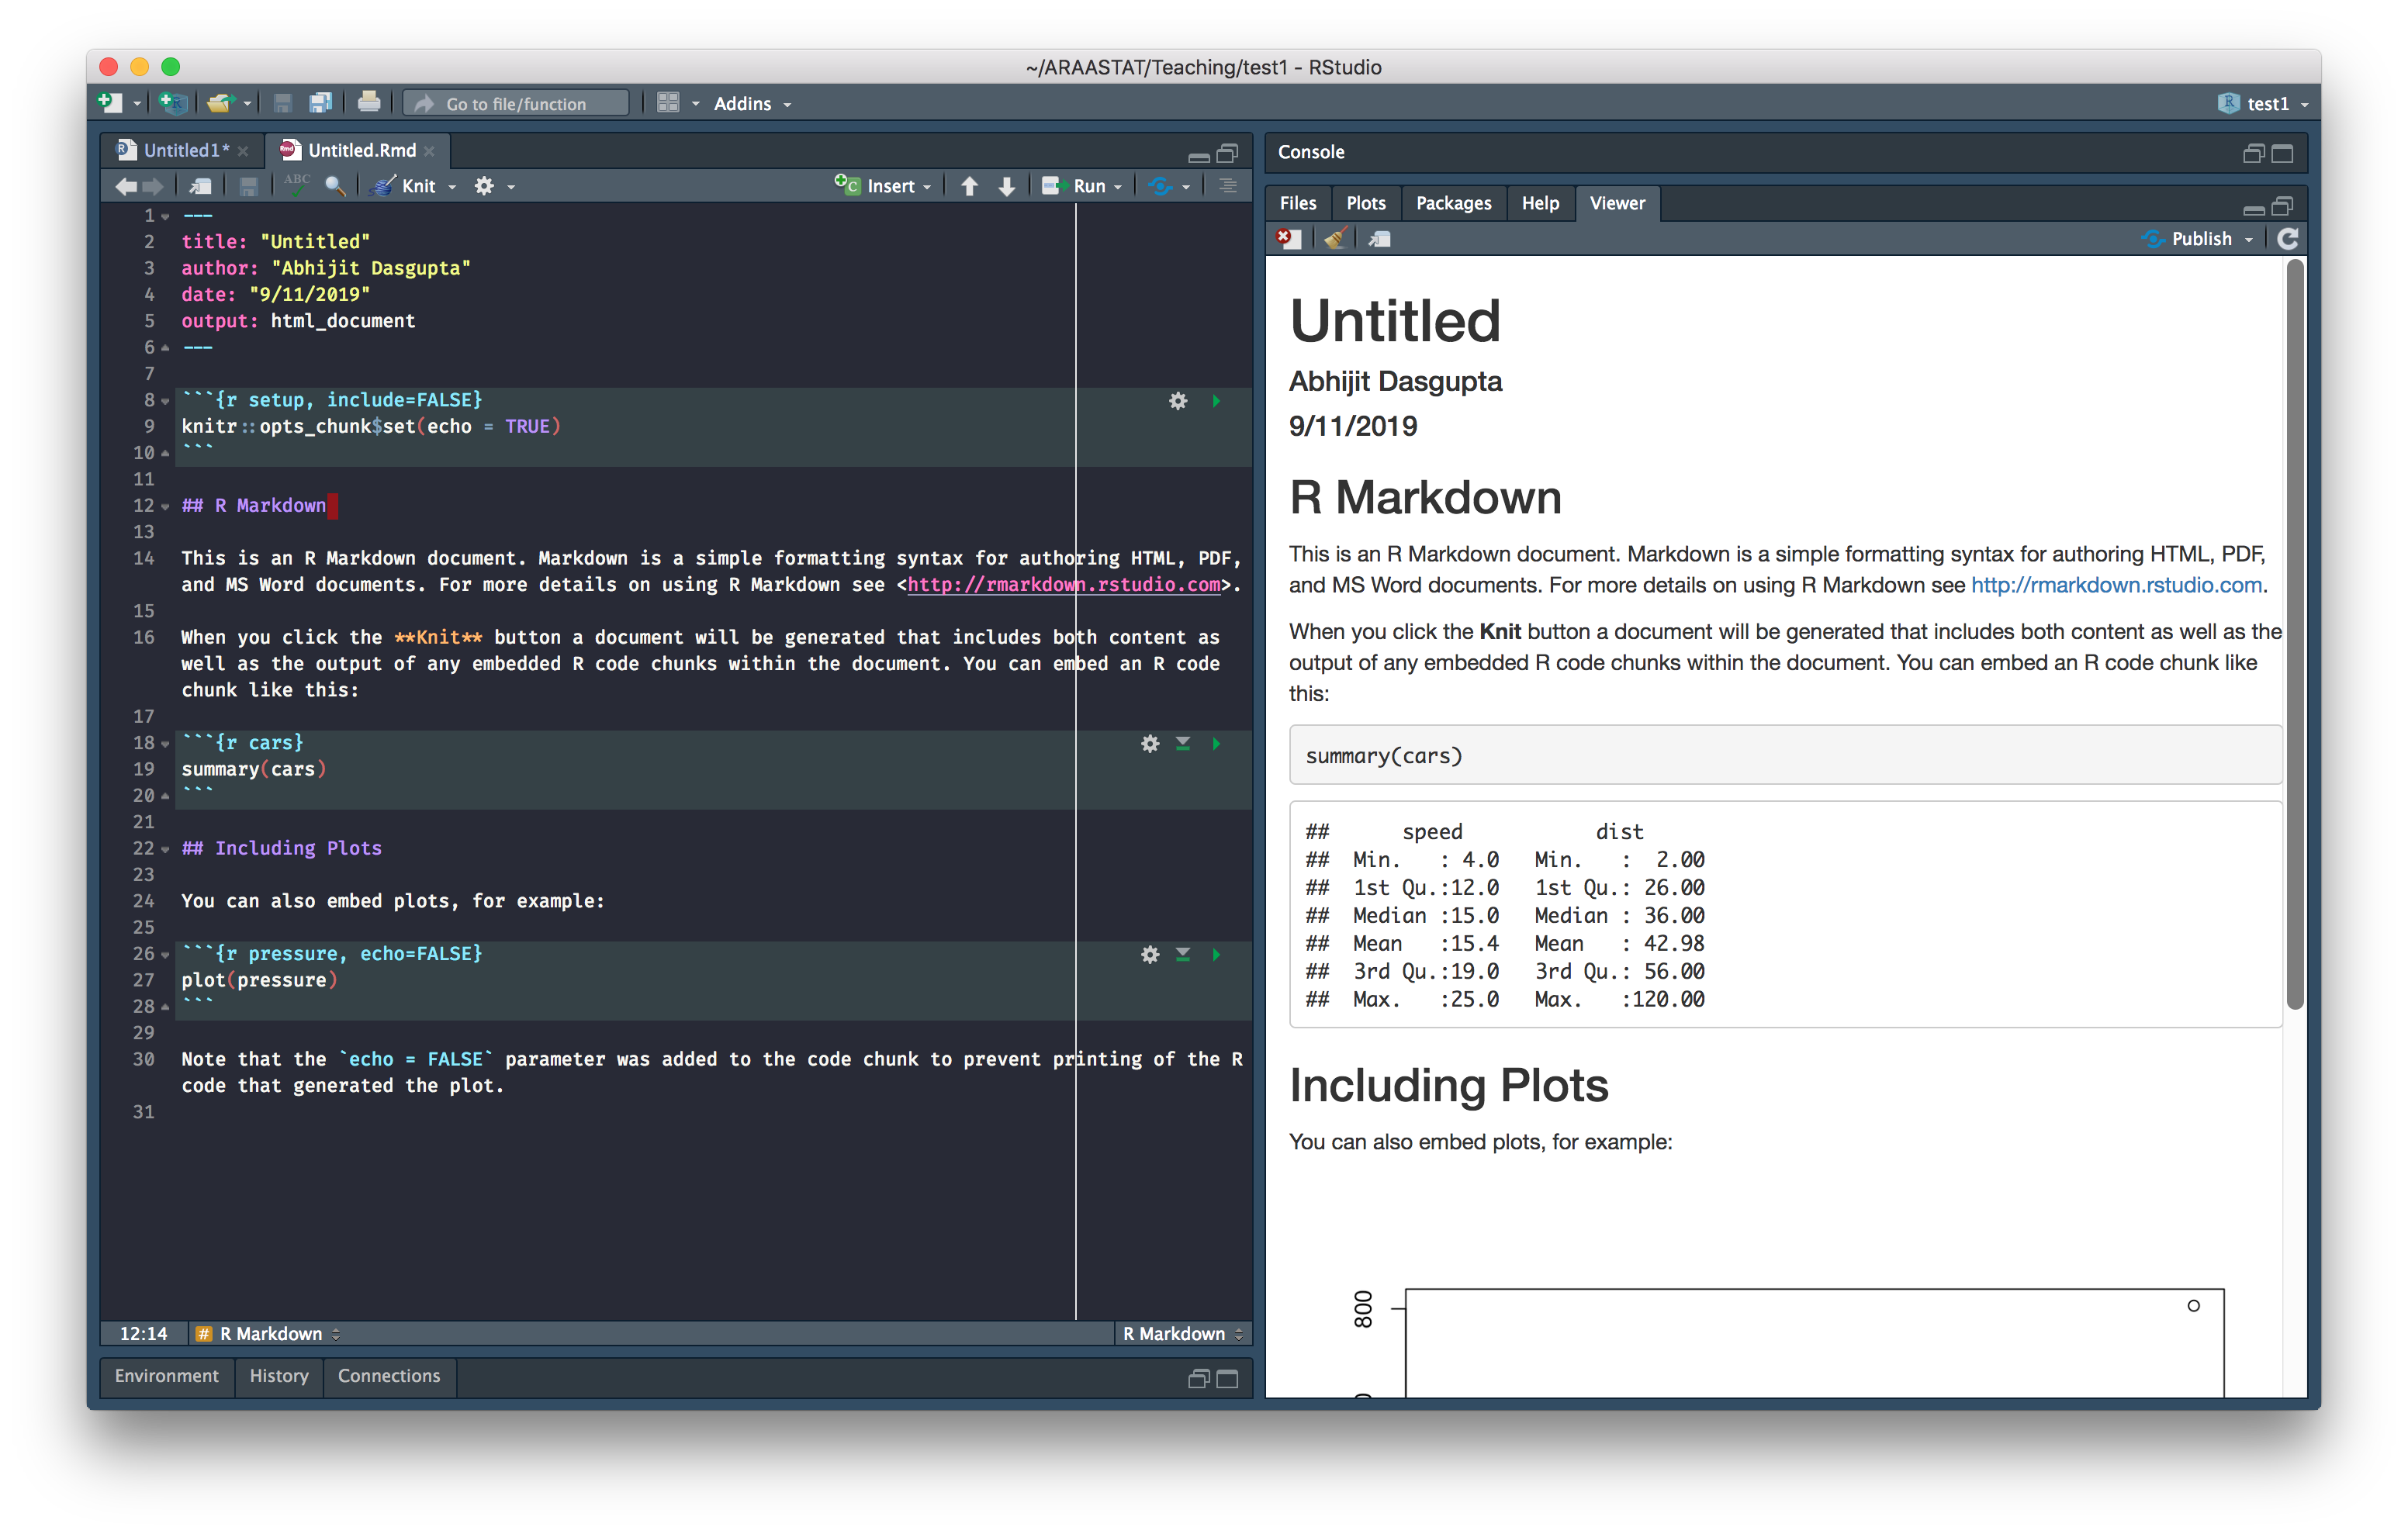
title: "Untitled"
author: "Abhijit Dasgupta"
date: "9/11/2019"
output: html_document
---
```
This determines the title and author, and the output type. Typically don't modify the
entry in `output` for now
--
````markdown
`r ''````{r cars}
summary(cars)
```
````
This is a code chunk. RMarkdown evaluates this chunk of code and replaces the code
with the results. This code chunk happens to be named "cars". The naming is optional but useful.
---
.pull-left[
### RMarkdown
````markdown
`r ''````{r cars}
summary(cars)
```
````
]
.pull-right[
### Results
```{r 01-intro-22}
summary(cars)
```
]
---
.pull-left[
### RMarkdown
````markdown
`r ''````{r}
library(tableone) # Use a package
kableone(CreateTableOne(data=airquality),
format='html')
```
````
]
.pull-right[
### Results
```{r 01-intro-23}
library(tableone) # Use a package
kableone(CreateTableOne(data=airquality),
format='html')
```
]
The code chunk on the left gets **replaced** by the table on the right in your document
---
---
## Inline code evaluation
.pull-left[
### RMarkdown
The airquality data set has
`` `r
nrow(airquality)` `` observations
The average ozone level is `` `r
mean(airquality$Ozone)` `` parts per billion
]
.pull-right[
### Results
The airquality data set has `r nrow(airquality)` observations
The average ozone level is
`r mean(airquality$Ozone, na.rm=T)` `` parts per billion
]