{
"cells": [
{
"cell_type": "markdown",
"metadata": {},
"source": [
"# Sports & MBTA Ridership"
]
},
{
"cell_type": "markdown",
"metadata": {},
"source": [
"## Motivation"
]
},
{
"cell_type": "markdown",
"metadata": {},
"source": [
"Major public events like concerts and sporting events often cause sudden spikes in demand for transportation services, both before they start and after they end. Transportation demand often increases across the system, perhaps with characteristic patterns along different lines and at specific stations. Postgame entries spike at stations in the immediate vicinity of the venue as people exit. We measure this effect in terms of “lift”—T entries in excess of those expected at a particular weekday/time around the same time of year."
]
},
{
"cell_type": "markdown",
"metadata": {},
"source": [
"---"
]
},
{
"cell_type": "markdown",
"metadata": {},
"source": [
"## Methodology"
]
},
{
"cell_type": "markdown",
"metadata": {},
"source": [
"To begin to understand these effects, we focus our analysis on Boston Bruins, Celtics, and Red Sox games. Only home games were considered. Game day traffic is compared to same-weekday and -time traffic on game-less days (e.g., Sunday evening Celtics games are compared to in-season Sunday evenings). We excluded several days from both the set of game days and game-less days, including holidays and service interruptions. Our reasoning: we are seeking the effect of games on traffic, and should not consider days with unique traffic patterns that we are reasonably sure have no link to a game.\n",
"\n",
"Note that some stations service more than one line. When that happens, we allocate pregame lift to the line that services the particular team's venue. For example, Government Center lies along the Green and Blue Lines. But only the Green Line services Fenway Park and TD Garden, so all lift is allocated to those lines. This rule is applied for all analysis below."
]
},
{
"cell_type": "markdown",
"metadata": {},
"source": [
"### Data"
]
},
{
"cell_type": "markdown",
"metadata": {},
"source": [
"We obtained sports schedules by manually retrieving them from [espn.com](http://www.espn.com/) and [redsox.com](http://www.redsox.com/). Time frames for each team’s schedule matches the MBTA data that we have available—they start in early 2013 and run until early 2015 (while the Bruins and Celtics seasons were both ongoing). This constitutes two entire seasons for the Red Sox, and three full or partial seasons for the others."
]
},
{
"cell_type": "markdown",
"metadata": {},
"source": [
"---"
]
},
{
"cell_type": "markdown",
"metadata": {},
"source": [
"## Pregame Demand Lift"
]
},
{
"cell_type": "markdown",
"metadata": {},
"source": [
"### Lift by Line"
]
},
{
"cell_type": "markdown",
"metadata": {},
"source": [
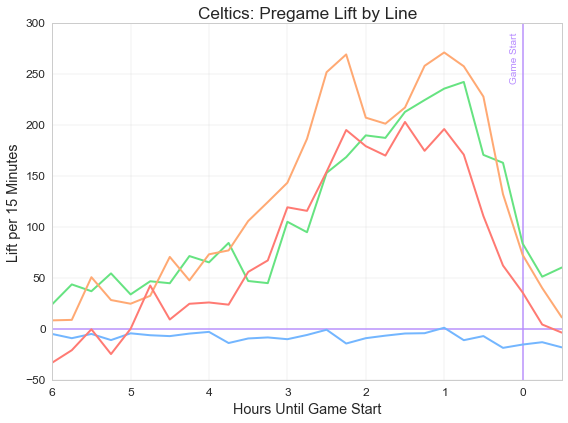
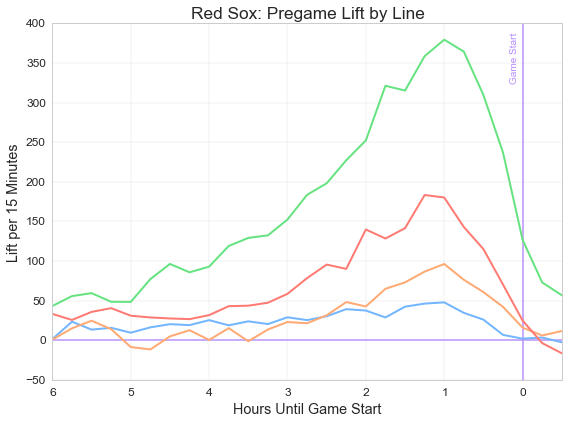
"As Boston sports fans live throughout urban Boston and the metropolitan area more generally, we analyzed entry lift throughout the system before games to gauge the effect of sporting events on ridership demand. Line-by-line trends for each team appear below."
]
},
{
"cell_type": "markdown",
"metadata": {},
"source": [
"\n",
"\n",
""
]
},
{
"cell_type": "markdown",
"metadata": {},
"source": [
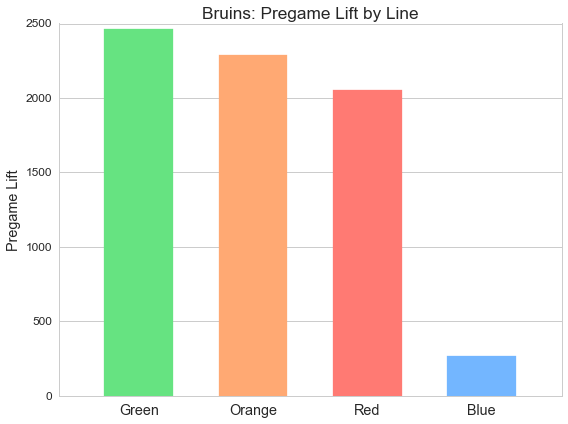
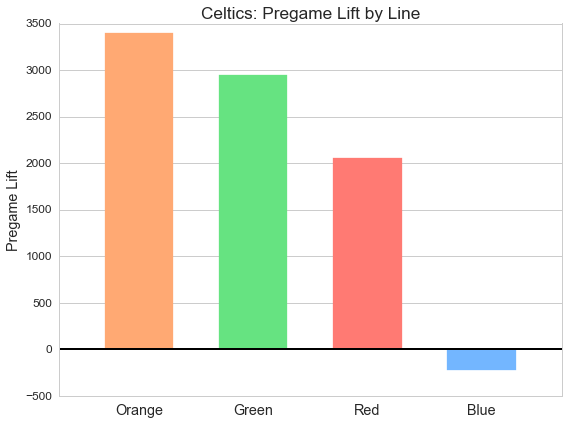
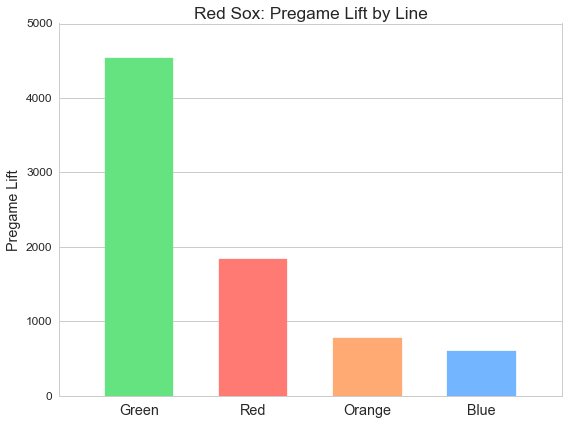
"Each team shows a long “ramp-up” starting several hours before game time and peaking around one hour before start. The Bruins and Celtics show comparable lift among non-Blue routes; Red Sox fans show a distinct preference for the Green Line, followed by the Red and Orange. The Blue Line shows little lift relative to the others, particularly before Celtics games, where Blue Line lift appears negative at times where other lines are reaching their peaks. To illustrate this, aggregate pregame ridership lift by line appears below:"
]
},
{
"cell_type": "markdown",
"metadata": {},
"source": [
"\n",
"\n",
""
]
},
{
"cell_type": "markdown",
"metadata": {},
"source": [
"### Lift by Station"
]
},
{
"cell_type": "markdown",
"metadata": {},
"source": [
"Turning our attention to specific stations: all teams show a mixture of lift at both inner-city stations and those farther out. The top 15 stations for each team appear below, along with notes about any observable patterns. Each table shows the station's primary line, a group that indicates its position in metro Boston, and the pregame lift for that station/team. Groups (as distinct from Lines) are based on our own clustering of MBTA stations."
]
},
{
"cell_type": "markdown",
"metadata": {},
"source": [
"#### Bruins"
]
},
{
"cell_type": "markdown",
"metadata": {},
"source": [
"\n",
" Bruins: Top Stations by Pregame Lift | Station | Line | Group | Lift |
|---|
\n",
" | Sullivan Square | Orange | Outer | 372 | \n",
"
\n",
" | JFK/U Mass | Red | Core | 346 | \n",
"
\n",
" | Wellington | Orange | Outer | 305 | \n",
"
\n",
" | Copley Square | Green | Core | 293 | \n",
"
\n",
" | Oak Grove | Orange | Outer | 293 | \n",
"
\n",
" | Back Bay | Orange | Core | 271 | \n",
"
\n",
" | Kenmore Square | Green | Core | 263 | \n",
"
\n",
" | Government Center | Green | Core | 261 | \n",
"
\n",
" | Harvard | Red | Core | 257 | \n",
"
\n",
" | Riverside | Green | Outer | 242 | \n",
"
\n",
" | Alewife | Red | Outer | 217 | \n",
"
\n",
" | Arlington | Green | Core | 211 | \n",
"
\n",
" | Quincy Adams | Red | Outer | 207 | \n",
"
\n",
" | Braintree | Red | Outer | 185 | \n",
"
\n",
" | Downtown Crossing | Orange | Core | 182 | \n",
"
\n",
"
"
]
},
{
"cell_type": "markdown",
"metadata": {},
"source": [
"Bruins games precipitate significant lift at many core Green and Orange Line stations. This is intuitive as both lines service TD Garden.\n",
"\n",
"Outer stations also show significant lift above normal entry rates. As a group, the northernmost Orange Line stations are quite popular. Both ends of the Red Line are popular as well, along with Harvard and JFK/UMass—two \"core\" stations that are somewhat peripheral. Finally, Riverside—the western end of Green Line D—is the tenth most popular station. We cannot break out particular above-ground stations along that line, but these results indicate that significant lift at other inbound stops is likely."
]
},
{
"cell_type": "markdown",
"metadata": {},
"source": [
"#### Celtics"
]
},
{
"cell_type": "markdown",
"metadata": {},
"source": [
"\n",
" Celtics: Top Stations by Pregame Lift | Station | Line | Group | Lift |
|---|
\n",
" | Back Bay | Orange | Core | 438 | \n",
"
\n",
" | Ruggles | Orange | Core | 428 | \n",
"
\n",
" | Downtown Crossing | Orange | Core | 397 | \n",
"
\n",
" | Sullivan Square | Orange | Outer | 375 | \n",
"
\n",
" | Copley Square | Green | Core | 357 | \n",
"
\n",
" | Kenmore Square | Green | Core | 329 | \n",
"
\n",
" | JFK/U Mass | Red | Core | 279 | \n",
"
\n",
" | Boylston | Green | Core | 278 | \n",
"
\n",
" | Hynes | Green | Core | 262 | \n",
"
\n",
" | Kendall Square | Red | Core | 249 | \n",
"
\n",
" | Forest Hills | Orange | Outer | 248 | \n",
"
\n",
" | Community College | Orange | Core | 235 | \n",
"
\n",
" | Arlington | Green | Core | 200 | \n",
"
\n",
" | Wellington | Orange | Outer | 196 | \n",
"
\n",
" | Central Square | Red | Transitional | 186 | \n",
"
\n",
"
"
]
},
{
"cell_type": "markdown",
"metadata": {},
"source": [
"Although the Celtics play in the same venue as the Bruins, pregame traffic patterns are somewhat different. As expected, the Green and Orange Lines still show significant lift. But those increases are heavier on \"core\" stations. Among the northern Orange Line stations popular before Bruins games, two appear in the top 15 stations before Celtics games; they are not atop the list. Instead, the Celtics appear to draw more fans from farther down the Orange Line (particularly at Back Bay and Ruggles). Forest Hills—the southeasternmost end of the Orange Line—also appears in the top 15.\n",
"\n",
"Red Line stations with significant lift are also no longer as close to the edges. The three Red Line stations among the top origins for fans traveling to Celtics games are all core stations or marginal ones. Riverside also no longer appears among top stations."
]
},
{
"cell_type": "markdown",
"metadata": {},
"source": [
"#### Red Sox"
]
},
{
"cell_type": "markdown",
"metadata": {},
"source": [
"\n",
" Red Sox: Top Stations by Pregame Lift | Station | Line | Group | Lift |
|---|
\n",
" | Riverside | Green | Outer | 844 | \n",
"
\n",
" | Government Center | Green | Core | 777 | \n",
"
\n",
" | North Station | Green | Core | 457 | \n",
"
\n",
" | Park Street | Green | Core | 431 | \n",
"
\n",
" | Alewife | Red | Outer | 410 | \n",
"
\n",
" | Copley Square | Green | Core | 386 | \n",
"
\n",
" | Haymarket | Green | Core | 379 | \n",
"
\n",
" | Quincy Adams | Red | Outer | 325 | \n",
"
\n",
" | Harvard | Red | Core | 289 | \n",
"
\n",
" | Arlington | Green | Core | 268 | \n",
"
\n",
" | Braintree | Red | Outer | 261 | \n",
"
\n",
" | Oak Grove | Orange | Outer | 257 | \n",
"
\n",
" | Sullivan Square | Orange | Outer | 234 | \n",
"
\n",
" | Wellington | Orange | Outer | 234 | \n",
"
\n",
" | Wonderland | Blue | Outer | 202 | \n",
"
\n",
"
"
]
},
{
"cell_type": "markdown",
"metadata": {},
"source": [
"Unlike TD Garden, Fenway is only served by the Green Line. Accordingly, quite a bit of pregame traffic arrives along that line. Riverside (recall, at the easternmost end of Green Line D) shows the most lift. This likely indicates a large number of people outside of *urban* Boston who park their cars and commute the rest of the way to games using the Green Line; unknown others park their cars at closer stations and commute from there.\n",
"\n",
"Other top stations are primarily outer stations: the ends of the Orange, Red, and Blue Lines all appear among top 15 stations by lift before Red Sox games. Harvard is the one exception to this pattern. Overall, there appears to be more ridership from peripheral stations for Red Sox games than for Bruins and Celtics games."
]
},
{
"cell_type": "markdown",
"metadata": {},
"source": [
"---"
]
},
{
"cell_type": "markdown",
"metadata": {},
"source": [
"## Postgame Demand Lift"
]
},
{
"cell_type": "markdown",
"metadata": {},
"source": [
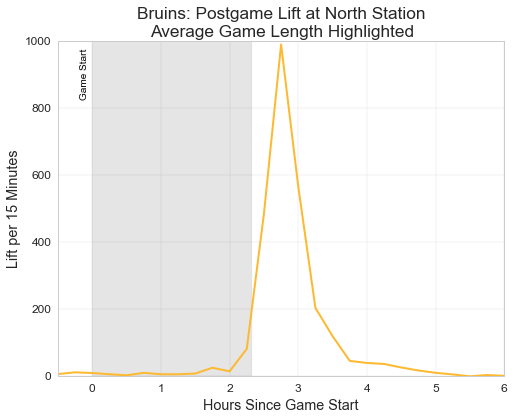
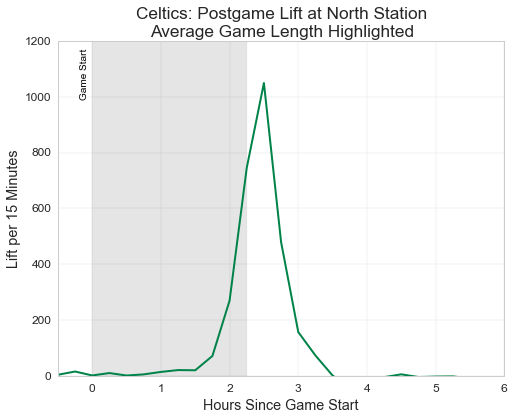
"Postgame entry lift follows a pattern completely distinct from pregame lift, featuring a large swell in entries around each sporting venue, rather than an aggregate increase in entries across the entire system. Postgame spikes naturally affect the rest of the system—people enter stations to go to others after all—but we can only observe effects at entry points.\n",
"\n",
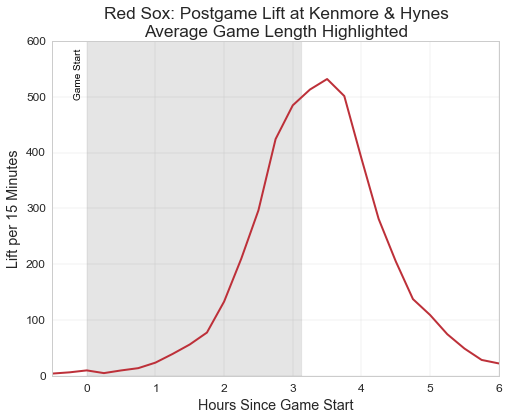
"For the Bruins and Celtics, we analyzed entry lift at North Station (nearest to TD Garden); Red Sox entries are focused on Kenmore Square and Hynes. Figure 11 shows postgame lift (from game start until several hours after end) at these stations. Typical game length roughly corresponds to the peak for each team: basketball/hockey games last (on average) just over two hours; baseball games, slightly more than three."
]
},
{
"cell_type": "markdown",
"metadata": {},
"source": [
"\n",
"\n",
""
]
},
{
"cell_type": "markdown",
"metadata": {},
"source": [
"As we see, the Bruins/Celtics show a characteristically different pattern from the Red Sox. In the former case, fans appear to immediately exit games (which we theorize to be of relatively uniform time length) and board public transportation. TD Garden holds relatively few fans, but post-game peak lift is larger than any time following a typical Red Sox game.\n",
"\n",
"The Red Sox show a much different pattern: lift around Fenway Park gradually increases starting late in the game, and fans continue to enter the T long after the game ends. We initially hypothesized that this was due to two factors: increased variance in game length and the tendency of more fans to leave early. But the pattern turned out to hold for individual games, suggesting that it is not an artifact of increased variance in game length; rather, many people both leave a typical baseball game early and remain in the neighborhood longer.\n",
"\n",
"Intuitively, much of the observed postgame lift is likely return traffic to the same key stations that we identify for pregame traffic. It is difficult to rigorously analyze transfers and station exits with the data that we have available. It should simply be noted that although postgame entries spike at the observed stations, ridership increases across the system (with the possible exception of the Blue Line for certain sports/games)."
]
},
{
"cell_type": "markdown",
"metadata": {},
"source": [
"---"
]
},
{
"cell_type": "markdown",
"metadata": {},
"source": [
"## Conclusions"
]
},
{
"cell_type": "markdown",
"metadata": {},
"source": [
"The ridership patterns described above show a mixture of consistency and discrepancy among the major Boston sports teams. All teams show similar pre-game \"ramp-up\" as spectators board T trains before games start. The Bruins and Celtics show very similar spikes in postgame entries at North Station, while the Red Sox show a more gradual increase and recession around the end of each game. Both of the latter patterns show very little variation across games.\n",
"\n",
"Differences arose in our examination of pregame traffic by line and station. The Red Sox showed the most \"suburban\" traffic pattern, with the highest concentration of riders arriving at far-flung stations. The Bruins showed a more urban ridership pattern, along with a preponderance of outer station ridership at the northern end of the Orange Line and along the Red Line. The Celtics showed the most \"urban\" lift, with ridership spiking strongly at core Orange Line stations and increasing relatively little at outer stations.\n",
"\n",
"Examining ridership lift by lines and stations is a useful way to gauge the ways in which the MBTA must meet demand before major public events. The nature of rail systems generally necessitates running trains from start to end along routes, so there are relatively few \"levers to pull\" beyond adding trains to the schedule. Still, with limited resources, planners must carefully plan service changes and consider how the typical commute will vary across events. Large rushes of people at particular stations also raise staffing concerns at those stations, as staff must be ready to meet and assist large crowds.\n",
"\n",
"Thus, our work serves and enlightens the MBTA across several dimensions. With any luck, it will make your next trip to Fenway Park a pleasant one."
]
}
],
"metadata": {
"kernelspec": {
"display_name": "Python 2",
"language": "python",
"name": "python2"
},
"language_info": {
"codemirror_mode": {
"name": "ipython",
"version": 2
},
"file_extension": ".py",
"mimetype": "text/x-python",
"name": "python",
"nbconvert_exporter": "python",
"pygments_lexer": "ipython2",
"version": "2.7.6"
}
},
"nbformat": 4,
"nbformat_minor": 0
}