{ "cells": [ { "cell_type": "markdown", "metadata": {}, "source": [ "# Lab 3 - Spark MLlib\n", "\n", "\"A computer program is said to learn from experience E with respect to some class of tasks T and performance measure P if its performance at tasks in T, as measured by P, improves with experience E\"\n", "-Tom M. Mitchell\n", "\n", "Machine Learning - the science of getting computers to act without being explicitly programmed\n", "\n", "MLlib is Spark’s machine learning (ML) library. Its goal is to make practical machine learning scalable and easy. It consists of common learning algorithms and utilities, including classification, regression, clustering, collaborative filtering (this example!), dimensionality reduction, as well as lower-level optimization primitives and higher-level pipeline APIs.\n", "\n", "It divides into two packages:\n", "1. spark.mllib contains the original API built on top of RDDs.\n", "2. spark.ml provides higher-level API built on top of DataFrames for constructing ML pipelines.\n", "\n", "\n", "Using spark.ml is recommended because with DataFrames the API is more versatile and flexible. But we will keep supporting spark.mllib along with the development of spark.ml. Users should be comfortable using spark.mllib features and expect more features coming.\n", "\n", "http://spark.apache.org/docs/latest/mllib-guide.html\n", "\n", "## Online Purchase Recommendations\n", "\n", "Learn how to create a recommendation engine using the Alternating Least Squares algorithm in Spark's machine learning library\n", "\n", "\n", "\n", "## The data\n", "\n", 
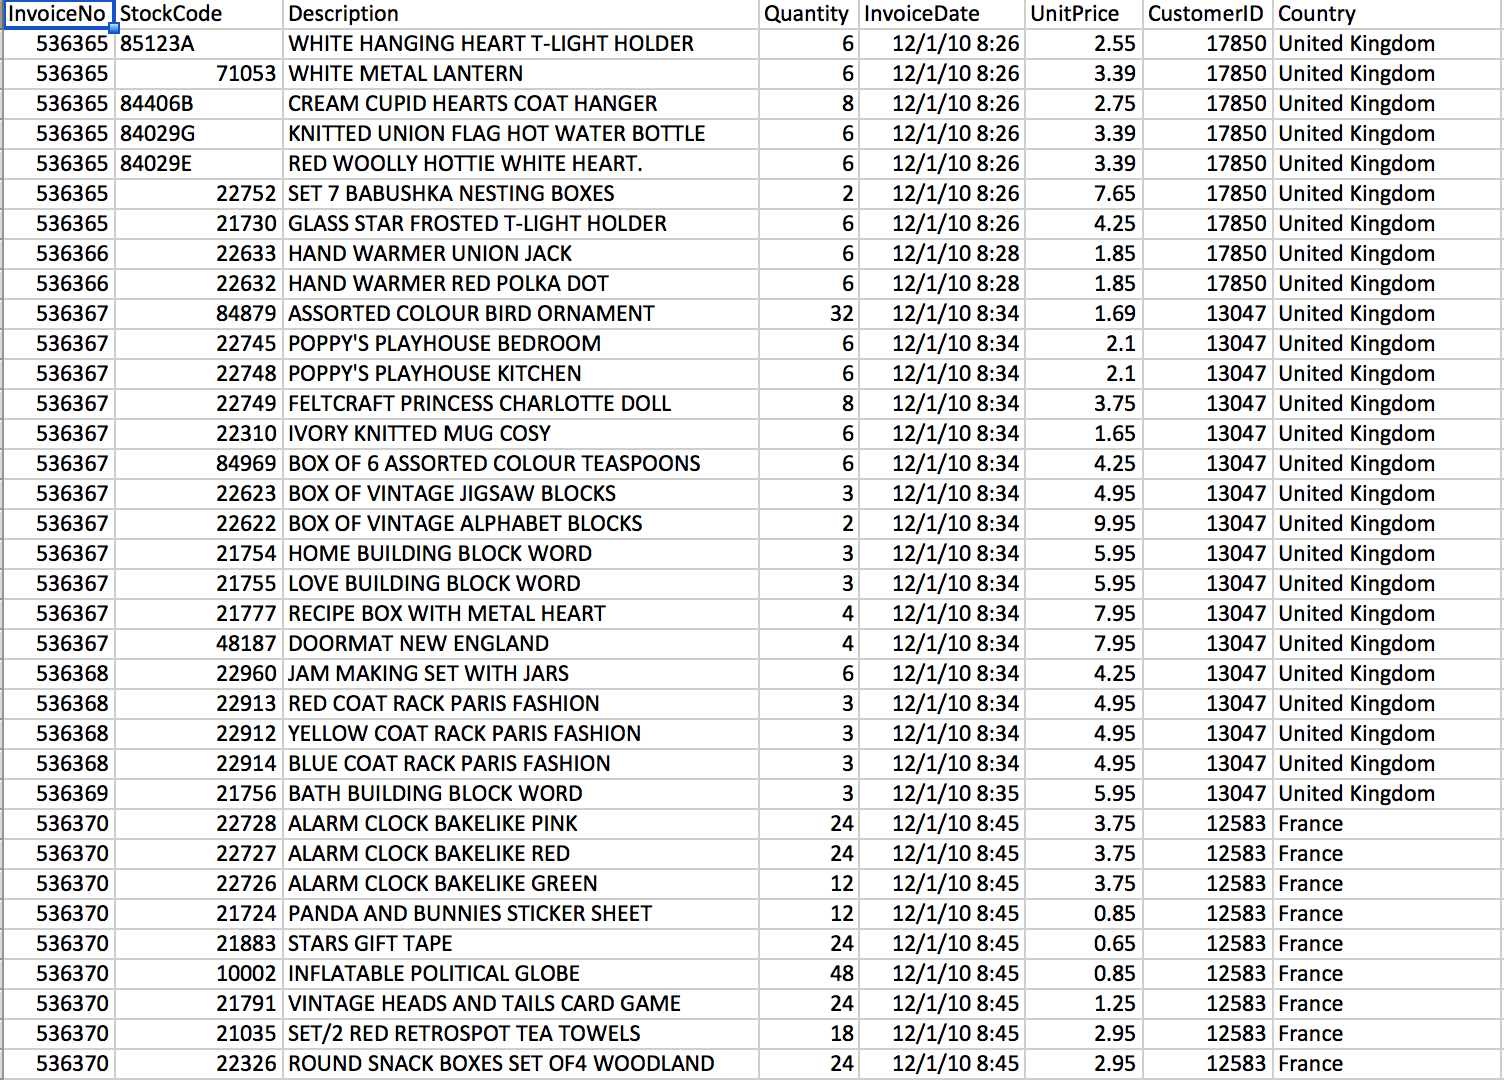
"This is a transnational data set which contains all the transactions occurring between 01/12/2010 and 09/12/2011 for a UK-based and registered non-store online retail. The company mainly sells unique all-occasion gifts. Many customers of the company are wholesalers.\n", "\n", "http://archive.ics.uci.edu/ml/datasets/Online+Retail\n", "\n", "" ] }, { "cell_type": "markdown", "metadata": {}, "source": [ "## Step 1 - Create an RDD from the CSV File \n", "### 1.1 - Download the data" ] }, { "cell_type": "code", "execution_count": 1, "metadata": { "collapsed": false, "scrolled": false }, "outputs": [ { "name": "stdout", "output_type": "stream", "text": [ "--2016-10-17 17:01:52-- https://raw.githubusercontent.com/rosswlewis/RecommendationPoT/master/OnlineRetail.csv.gz\n", "Resolving raw.githubusercontent.com (raw.githubusercontent.com)... 151.101.48.133\n", "Connecting to raw.githubusercontent.com (raw.githubusercontent.com)|151.101.48.133|:443... connected.\n", "HTTP request sent, awaiting response... 200 OK\n", "Length: 7483128 (7.1M) [application/octet-stream]\n", "Saving to: 'OnlineRetail.csv.gz'\n", "\n", "100%[======================================>] 7,483,128 --.-K/s in 0.1s \n", "\n", "2016-10-17 17:01:54 (69.4 MB/s) - 'OnlineRetail.csv.gz' saved [7483128/7483128]\n", "\n" ] } ], "source": [ "#Download the data from github to the local directory\n", "!rm 'OnlineRetail.csv.gz' -f\n", "!wget https://raw.githubusercontent.com/rosswlewis/RecommendationPoT/master/OnlineRetail.csv.gz" ] }, { "cell_type": "markdown", "metadata": {}, "source": [ "### 1.2 - Put the csv into an RDD (at first, each row in the RDD is a string which correlates to a line in the csv) and show the first three lines.\n", "
\n", "
\n", "
\n", "
\n", "

\n", " \n", " Hint 1\n", "

\n", "
\n", "
\n", "
Use the Spark context (sc) to get the list of possible methods. sc.<TAB>
\n", "
\n", "
\n", "
\n", "
\n", "

\n", " \n", " Hint 2\n", "

\n", "
\n", "
\n", "
Use the textFile() method
\n", "
\n", "
\n", "
\n", "
\n", "

\n", " \n", " Hint 3\n", "

\n", "
\n", "
\n", "
Type:
\n", "loadRetailData = sc.textFile(\"OnlineRetail.csv.gz\")
\n", "loadRetailData.take(3)
\n", "
\n", "
\n", "
\n", "\n" ] }, { "cell_type": "code", "execution_count": null, "metadata": { "collapsed": false }, "outputs": [], "source": [] }, { "cell_type": "markdown", "metadata": {}, "source": [ "## Step 2 - Prepare and shape the data: \"80% of a Data Scientists job\"" ] }, { "cell_type": "markdown", "metadata": {}, "source": [ "### 2.1 - Remove the header from the RDD and split the remaining lines by comma.\n", "
\n", "
\n", "
\n", "
\n", "

\n", " \n", " Hint 1\n", "

\n", "
\n", "
\n", "
The header is the first line in the RDD -- use first() to obtain it.
\n", "
\n", "
\n", "
\n", "
\n", "

\n", " \n", " Hint 2\n", "

\n", "
\n", "
\n", "
Use the filter() method to filter out all lines which are not equal to the header line.
\n", "
\n", "
\n", "
\n", "
\n", "

\n", " \n", " Hint 3\n", "

\n", "
\n", "
\n", "
Map the split() method to the remaining lines to split on \",\"
\n", "
\n", "
\n", "
\n", "
\n", "

\n", " \n", " Hint 4\n", "

\n", "
\n", "
\n", "
Type:
\n", "\n", "header = loadRetailData.first()
\n", "splitColumns = loadRetailData.filter(lambda line: line != header).map(lambda l: l.split(\",\"))
\n", "
\n", "
\n", "
" ] }, { "cell_type": "code", "execution_count": null, "metadata": { "collapsed": false }, "outputs": [], "source": [ "\n" ] }, { "cell_type": "markdown", "metadata": {}, "source": [ "### 2.2 - Filter the remaining lines using regular expressions\n", "The original file at UCI's Machine Learning Repository has commas in the product description. Those have been removed to expediate the lab.\n", "Only keep rows that have a quantity greater than 0, a non-empty customerID, and a non-blank stock code after removing non-numeric characters.

\n", "
\n", "
\n", "
\n", "

\n", " \n", " Hint 1\n", "

\n", "
\n", "
\n", "
Examine the header to determine which fields need to be used to filter the data.
\n", "
\n", "
\n", "
\n", "
\n", "

\n", " \n", " Hint 2\n", "

\n", "
\n", "
\n", "
Use the filter() method for the first two requirements. Note -- you may have to cast values.
\n", "
\n", "
\n", "
\n", "
\n", "

\n", " \n", " Hint 3\n", "

\n", "
\n", "
\n", "
Look at the re.sub() method
\n", "
\n", "
\n", "
\n", "
\n", "

\n", " \n", " Hint 4\n", "

\n", "
\n", "
\n", "
Type:
\n", "import re
\n", "filteredRetailData = splitColumns.filter(lambda l: int(l[3]) > 0 and len(re.sub(\"\\D\", \"\", l[1])) != 0 and l[6] != \"\")
\n", "
\n", "
\n", "
" ] }, { "cell_type": "code", "execution_count": null, "metadata": { "collapsed": false }, "outputs": [], "source": [ "\n" ] }, { "cell_type": "markdown", "metadata": {}, "source": [ "### 2.3 - Map each line to a SQL Row and create a Dataframe from the result. Register the Dataframe as an SQL temp table.\n", "
\n", "Use the following for the Row column names: inv, stockCode, description, quant, invDate, price, custId, country. inv, stockCode, quant and custId should be integers. \n", "price is a float. description and country are strings (the default).\n", "

\n", "Hint: When you replaced non-digit characters using the regular expression above, you replaced them in the context of a test. You'll have to do it again when creating the stockCode Row value.\n", "

\n", "
\n", "
\n", "
\n", "

\n", " \n", " Hint 1\n", "

\n", "
\n", "
\n", "
We haven't used SQLContext or Row in this notebook, so you will have to import them from the pyspark.sql package and then create a SQLContext.
\n", "
\n", "
\n", "
\n", "
\n", "

\n", " \n", " Hint 2\n", "

\n", "
\n", "
\n", "
You can create a Row using a map(). For example:
\n", " example = myRDD.map(lambda x: Row(v1=x[1], v2=int(x[2]), v3=float(x[3]))
\n", " Note how we set the column names this way.
\n", "
\n", "
\n", "
\n", "
\n", "

\n", " \n", " Hint 3\n", "

\n", "
\n", "
\n", "
use createDataFrame() in your SQLContext. Then register the dataframe with registerTempTable()
\n", "
\n", "
\n", "
\n", "
\n", "

\n", " \n", " Hint 4\n", "

\n", "
\n", "
\n", "
Type:
\n", "from pyspark.sql import SQLContext, Row
\n", "sqlContext = SQLContext(sc)
\n", "\n", "retailRows = filteredRetailData.map(lambda l: Row(inv=int(l[0]), stockCode=int(re.sub(\"\\D\", \"\", l[1])), description=l[2], quant=int(l[3]), invDate=l[4], price=float(l[5]), custId=int(l[6]), country=l[7]))
\n", "\n", "retailDf = sqlContext.createDataFrame(retailRows)
\n", "retailDf.registerTempTable(\"retailPurchases\")
\n", "
\n", "
\n", "
" ] }, { "cell_type": "code", "execution_count": 1, "metadata": { "collapsed": false }, "outputs": [], "source": [ "from pyspark.sql import SQLContext, Row\n", "sqlContext = SQLContext(sc)\n", "\n" ] }, { "cell_type": "markdown", "metadata": {}, "source": [ "### 2.4 - Keep only the data we need (custId, stockCode, and rank)\n", "
\n", "The Alternating Least Squares algorithm requires three values. In this case, we're going to use the Customer ID (custId), stock code (stockCode) and a ranking value. In this situation there is not a ranking value within the data, so we will create one. We will set a value of 1 to indicate a purchase since these are all actual orders. Set that value to \"purch\".\n", "

\n", "After doing the select, group by custId and stockCode.\n", "

\n", "
\n", "
\n", "
\n", "

\n", " \n", " Hint 1\n", "

\n", "
\n", "
\n", "
To add a fixed value within a select statement, use something like select x,y,1 as purch from z
\n", "
\n", "
\n", "
\n", "
\n", "

\n", " \n", " Hint 2\n", "

\n", "
\n", "
\n", "
Use the group by statement to group results. To group by two values, separate them by commas (i.e. group by x,y)
\n", "
\n", "
\n", "
\n", "
\n", "

\n", " \n", " Hint 3\n", "

\n", "
\n", "
\n", "
Type:\n", "\n", "query = \"\n", "SELECT \n", " custId, stockCode, 1 as purch\n", "FROM \n", " retailPurchases \n", "group \n", " by custId, stockCode\"
\n", "uniqueCombDf = sqlContext.sql(query)
\n", "
\n", "
\n", "
" ] }, { "cell_type": "code", "execution_count": null, "metadata": { "collapsed": false }, "outputs": [], "source": [] }, { "cell_type": "markdown", "metadata": {}, "source": [ "### 2.5 - Randomly split the data into a testing set (10% of the data), a cross validation set (10% of the data) a training set (80% of the data)\n", "

\n", "We wish to split up the data into three parts. A training set (80%) to train the algorithm, a testing set (10%) and a cross-validation set (10%). The data for each set should be randomly selected.\n", "

\n", "
\n", "
\n", "
\n", "

\n", " \n", " Hint 1\n", "

\n", "
\n", "
\n", "
Use the randomSplit() method
\n", "
\n", "
\n", "
\n", "
\n", "

\n", " \n", " Hint 2\n", "

\n", "
\n", "
\n", "
Type:
\n", " testDf, cvDf, trainDf = uniqueCombDf.randomSplit([.1,.1,.8])
\n", "
\n", "
\n", "
\n", "
\n", "

\n", " \n", " Advanced Optional 1\n", "

\n", "
\n", "
\n", "
randomSplit() takes an optional seed parameter. At the end of the exercise give a random seed and see whether the results change.
\n", "
\n", "
\n", "
" ] }, { "cell_type": "code", "execution_count": null, "metadata": { "collapsed": false }, "outputs": [], "source": [ "\n" ] }, { "cell_type": "markdown", "metadata": {}, "source": [ "## Step 3 - Build recommendation models\n", "\n", "### 3.1 - Use the training dataframe to train a model with Alternating Least Squares using the ALS class\n", "
\n", "ALS attempts to estimate the ratings matrix R as the product of two lower-rank matrices, X and Y, i.e. X * Yt = R. Typically these approximations are called ‘factor’ matrices. The general approach is iterative. During each iteration, one of the factor matrices is held constant, while the other is solved for using least squares. The newly-solved factor matrix is then held constant while solving for the other factor matrix.\n", "

\n", "Latent Factors / rank
\n", "    The number of columns in the user-feature and product-feature matricies
\n", "Iterations / maxIter
\n", "    The number of factorization runs

\n", "To use the ALS class type:\n", "
\n", "from pyspark.ml.recommendation import ALS
\n", "
\n", "When running ALS, we need to create two separate instances. For both instances userCol is custId, itemCol is stockCode and ratingCol is purch.

\n", "For the first instance, use a rank of 15 and set iterations to 5.
\n", "For the second instance, use a rank of 2 and set iterations to 10.
\n", "Run fit() on both instances using the training dataframe.
\n", "
\n", "
\n", "
\n", "
\n", "

\n", " \n", " Advanced Optional 1\n", "

\n", "
\n", "
\n", "
Create an emply instance of the ALS class and run the explainParams method on it to see the default values.
\n", "
\n", "
\n", "
\n", "
\n", "

\n", " \n", " Hint 1\n", "

\n", "
\n", "
\n", "
als1 = ALS(rank=15, maxIter=5, userCol=\"custId\", itemCol=\"stockCode\", ratingCol=\"purch\")
\n", "
\n", "
\n", "
\n", "
\n", "

\n", " \n", " Hint 2\n", "

\n", "
\n", "
\n", "
model1 = als1.fit(trainDf)
\n", "
\n", "
\n", "
\n", "
\n", "

\n", " \n", " Hint 3\n", "

\n", "
\n", "
\n", "
Type:\n", "
\n", "from pyspark.ml.recommendation import ALS
\n", "\n", "als1 = ALS(rank=15, maxIter=5, userCol=\"custId\", itemCol=\"stockCode\", ratingCol=\"purch\")
\n", "model1 = als1.fit(trainDf)
\n", "\n", "als2 = ALS(rank=2, maxIter=10, userCol=\"custId\", itemCol=\"stockCode\", ratingCol=\"purch\")
\n", "model2 = als2.fit(trainDf)\n", "
\n", "
\n", "
\n", "
\n" ] }, { "cell_type": "code", "execution_count": 2, "metadata": { "collapsed": false, "scrolled": true }, "outputs": [], "source": [ "from pyspark.ml.recommendation import ALS\n", "\n" ] }, { "cell_type": "markdown", "metadata": {}, "source": [ "## Step 4 - Test the models\n", "\n", "Use the models to predict what the user will rate a certain item. The closer our model is to 1 for an item a user has already purchased, the better.\n", "\n", "### 4.1 - Evaluate the model with the cross validation dataframe by using the transform function.\n", "\n", "Some of the users or purchases in the cross validation data may not have been in the training data. Let's remove the ones that aren't. To do this obtain all the the custId and stockCode values from the training data and filter out any lines with those values from the cross-validation data.\n", "

\n", "At the end, print out how many cross-validation lines we had at the start -- and the new number afterwords.\n", "

\n", "
\n", "
\n", "
\n", "

\n", " \n", " Hint 1\n", "

\n", "
\n", "
\n", "
Use map() to return a specific value (i.e. foo = foo.map(lambda x: x.value)) and put them all in a set (i.e. foo1 = set(foo))
\n", "
\n", "
\n", "
\n", "
\n", "

\n", " \n", " Hint 2\n", "

\n", "
\n", "
\n", "
You need all the returned values (remember they might be spread all across the cluster!) so run collect() on the results of the map(). (i.e. foo1 = set(foo.collect()))
\n", "
\n", "
\n", "
\n", "
\n", "

\n", " \n", " Hint 3\n", "

\n", "
\n", "
\n", "
Use the filter() to filter out any values in the cross-validation dataframe which are in the stockCode or custId sets. Use toDF() to change the results to a dataframe.
\n", "
\n", "
\n", "
\n", "
\n", "

\n", " \n", " Hint 4\n", "

\n", "
\n", "
\n", "
Type:
\n", "customers = set(trainDf.rdd.map(lambda line: line.custId).collect())
\n", "stock = set(trainDf.rdd.map(lambda line: line.stockCode).collect())
\n", "\n", "filteredCvDf = cvDf.rdd.filter(lambda line: line.stockCode in stock and line.custId in customers).toDF()
\n", "\n", "print cvDf.count()
\n", "print filteredCvDf.count()
\n", "
\n", "
\n", "
" ] }, { "cell_type": "code", "execution_count": null, "metadata": { "collapsed": false, "scrolled": true }, "outputs": [], "source": [ "\n" ] }, { "cell_type": "markdown", "metadata": {}, "source": [ "### Step 4.2 - Make Predictions using transform()\n", "\n", "Type:\n", "\n", "predictions1 = model1.transform(filteredCvDf)
\n", "predictions2 = model2.transform(filteredCvDf)\n", "" ] }, { "cell_type": "code", "execution_count": null, "metadata": { "collapsed": false, "scrolled": false }, "outputs": [], "source": [ "\n" ] }, { "cell_type": "markdown", "metadata": {}, "source": [ "### 4.3 - Calculate and print the Mean Squared Error. For all ratings, subtract the prediction from the actual purchase (1), square the result, and take the mean of all of the squared differences.\n", "\n", "The lower the result number, the better the model.\n", "\n", "Type:\n", "\n", "meanSquaredError1 = predictions1.map(lambda line: (line.purch - line.prediction)\\*\\*2).mean()
\n", "meanSquaredError2 = predictions2.map(lambda line: (line.purch - line.prediction)\\*\\*2).mean()

\n", " \n", "print 'Mean squared error = %.4f for our first model' % meanSquaredError1
\n", "print 'Mean squared error = %.4f for our second model' % meanSquaredError2\n" ] }, { "cell_type": "code", "execution_count": null, "metadata": { "collapsed": false }, "outputs": [], "source": [ "\n" ] }, { "cell_type": "markdown", "metadata": {}, "source": [ "### 4.4 - Confirm the model by testing it with the test data and the best hyperparameters found during cross-validation\n", "\n", "Filter the test dataframe (testDf) the same way as the cross-validation dataframe. Then run the transform() and calculate the mean squared error. It should be the same as the value calcuated above.\n", "\n", "Type:\n", "\n", "filteredTestDf = testDf.rdd.filter(lambda line: line.stockCode in stock and line.custId in customers).toDF()
\n", "predictions3 = model2.transform(filteredTestDf)
\n", "meanSquaredError3 = predictions3.map(lambda line: (line.purch - line.prediction)\\*\\*2).mean()

\n", " \n", "print 'Mean squared error = %.4f for our best model' % meanSquaredError3\n" ] }, { "cell_type": "code", "execution_count": null, "metadata": { "collapsed": false }, "outputs": [], "source": [ "\n", "\n" ] }, { "cell_type": "markdown", "metadata": {}, "source": [ "## Step 5 - Implement the model\n", "\n", "### 5.1 - First, create a dataframe in which each row has the user id and an item id.\n", "
\n", "Use the Dataframe methods to create a Dataframe with a specific user and that user's purchased products.
\n", "    First, use the Dataframe filter() to filter out all custId's but 15544.
\n", "    Then use the select() to only return the custId column.
\n", "    Now use distinct() to ensure we only have the single custId.
\n", "    Do a join() with the distinct values from the stockCode column.\n", "

\n", "
\n", "
\n", "
\n", "

\n", " \n", " Hint 1\n", "

\n", "
\n", "
\n", "
Use the Dataframe filter() method to filter out all users but 15544
\n", " user = trainDf.filter(trainDf.custId == 15544)
\n", "
\n", "
\n", "
\n", "
\n", "

\n", " \n", " Hint 2\n", "

\n", "
\n", "
\n", "
Use the Dataframe select() method to only select the custId column
\n", " userCustId = user.select(\"custId\")
\n", "
\n", "
\n", "
\n", "
\n", "

\n", " \n", " Hint 3\n", "

\n", "
\n", "
\n", "
Use the Dataframe distinct() method to only return unique rows.
\n", " userCustIdDistinct = userCustId.distinct()
\n", "
\n", "
\n", "
\n", "
\n", "

\n", " \n", " Hint 4\n", "

\n", "
\n", "
\n", "
Use the Dataframe join() method to join the results with distinct stockCodes
\n", "
\n", "
\n", "
\n", "
\n", "

\n", " \n", " Hint 5\n", "

\n", "
\n", "
\n", "
Type:
\n", "user = trainDf.filter(trainDf.custId == 15544)
\n", "userCustId = user.select(\"custId\")
\n", "userCustIdDistinct = userCustId.distinct()
\n", "stockCode = trainDf.select(\"stockCode\")
\n", "stockCodeDistinct = stockCode.distinct()
\n", "userItems = userCustIdDistinct.join(stockCodeDistinct)
\n", "OR\n", "userItems = trainDf.filter(trainDf.custId == 15544).select(\"custId\").distinct().join( trainDf.select(\"stockCode\").distinct())
\n", "
\n", "
\n", "
" ] }, { "cell_type": "code", "execution_count": null, "metadata": { "collapsed": false }, "outputs": [], "source": [ "\n" ] }, { "cell_type": "markdown", "metadata": {}, "source": [ "### 5.2 - Use 'transform' to rate each item.\n", "\n", "Type:\n", "\n", "bestRecsDf = model2.transform(userItems)
\n", "bestRecsDf.first()\n" ] }, { "cell_type": "code", "execution_count": null, "metadata": { "collapsed": false }, "outputs": [], "source": [ "\n" ] }, { "cell_type": "markdown", "metadata": {}, "source": [ "### 5.3 - Print the top 5 recommendations sorted on prediction.\n", "\n", "
\n", "
\n", "
\n", "

\n", " \n", " Hint 1\n", "

\n", "
\n", "
\n", "
In order to print the top five recommendations, we need to sort() them in descending order
\n", "
\n", "
\n", "
\n", "
\n", "

\n", " \n", " Hint 2\n", "

\n", "
\n", "
\n", "
Use take() to get the top 5 values.
\n", "
\n", "
\n", "
\n", "
\n", "

\n", " \n", " Hint 3\n", "

\n", "
\n", "
\n", "
Type:
\n", " print bestRecsDf.sort(\"prediction\",ascending=False).take(5)
\n", "
\n", "
\n", "
\n", "
\n", "

\n", " \n", " Advanced Optional 1\n", "

\n", "
\n", "
\n", "
select from the retailPurchases temp table on stockCode to see some of selections recommended.
\n", "
\n", "
\n", "
" ] }, { "cell_type": "code", "execution_count": null, "metadata": { "collapsed": false, "scrolled": true }, "outputs": [], "source": [] }, { "cell_type": "markdown", "metadata": {}, "source": [ "Let's look up this user and the recommended product ID's in the excel file...\n", "\n", "" ] }, { "cell_type": "markdown", "metadata": { "collapsed": true }, "source": [ 
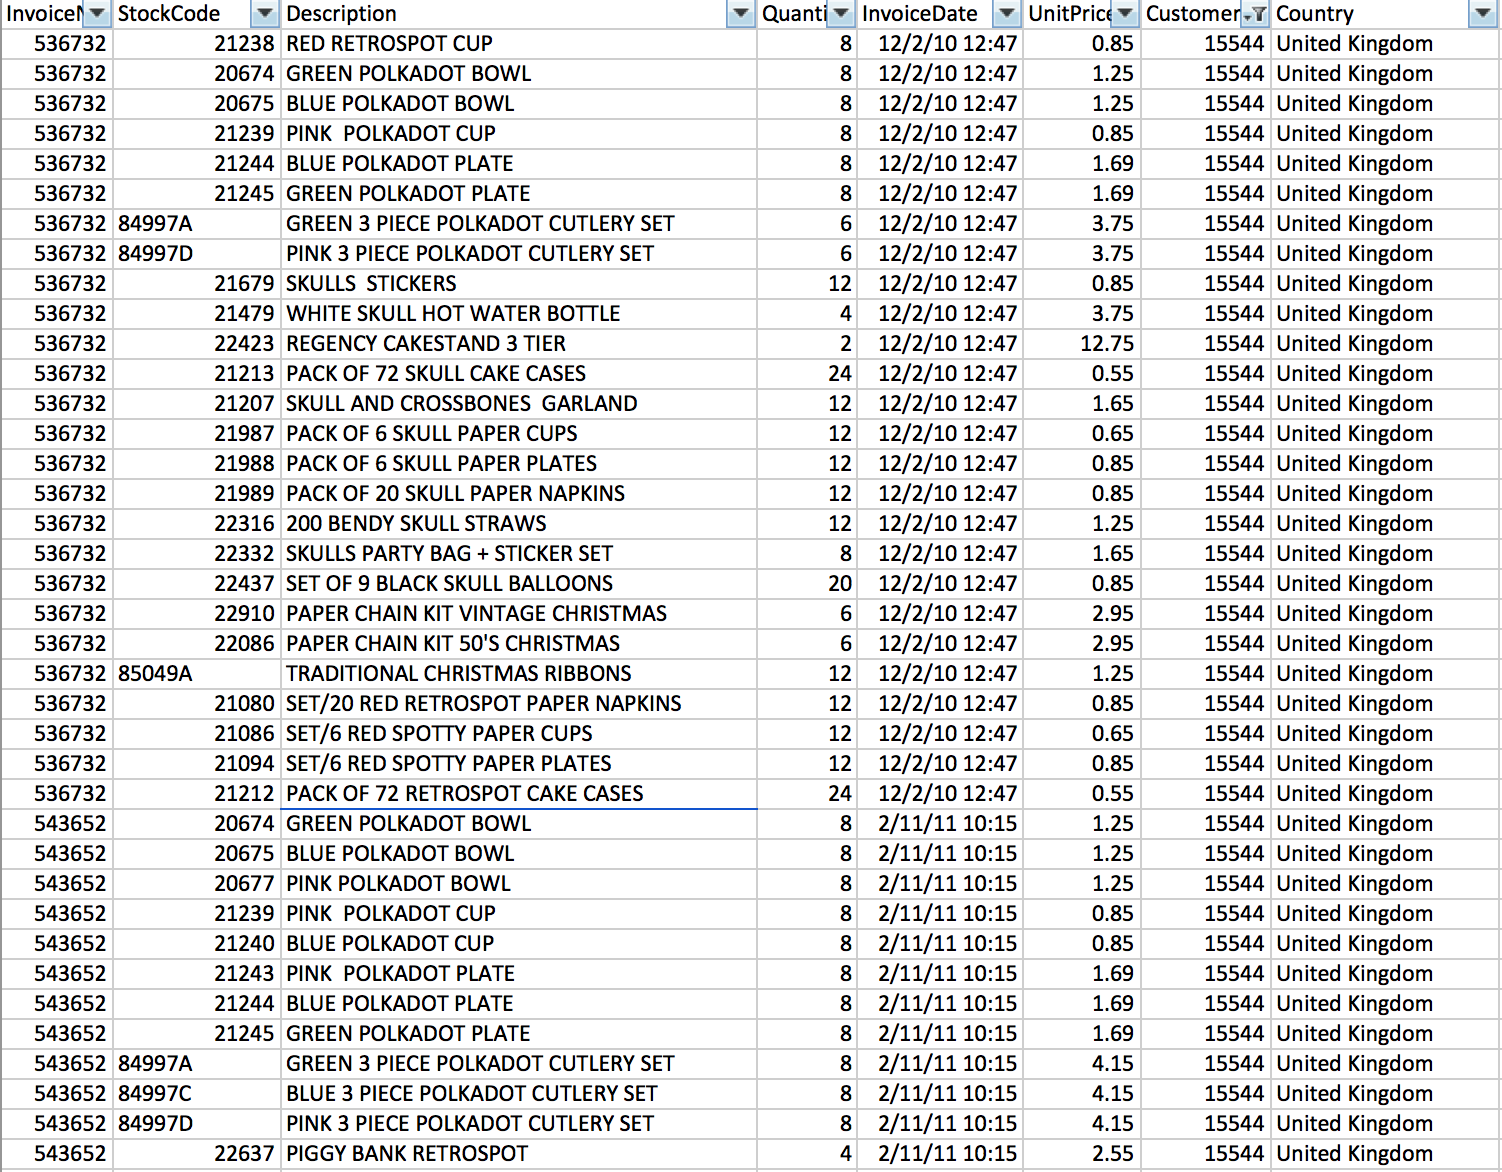
"This user seems to have purchased a lot of childrens gifts and some holiday items. The recommendation engine we created suggested some items along these lines\n" ] }, { "cell_type": "markdown", "metadata": {}, "source": [ "##### Citation\n", "Daqing Chen, Sai Liang Sain, and Kun Guo, Data mining for the online retail industry: A case study of RFM model-based customer segmentation using data mining, Journal of Database Marketing and Customer Strategy Management, Vol. 19, No. 3, pp. 197–208, 2012 (Published online before print: 27 August 2012. doi: 10.1057/dbm.2012.17)." ] } ], "metadata": { "kernelspec": { "display_name": "Python 2 with Spark 1.6", "language": "python", "name": "python2" }, "language_info": { "codemirror_mode": { "name": "ipython", "version": 2 }, "file_extension": ".py", "mimetype": "text/x-python", "name": "python", "nbconvert_exporter": "python", "pygments_lexer": "ipython2", "version": "2.7.11" } }, "nbformat": 4, "nbformat_minor": 0 }