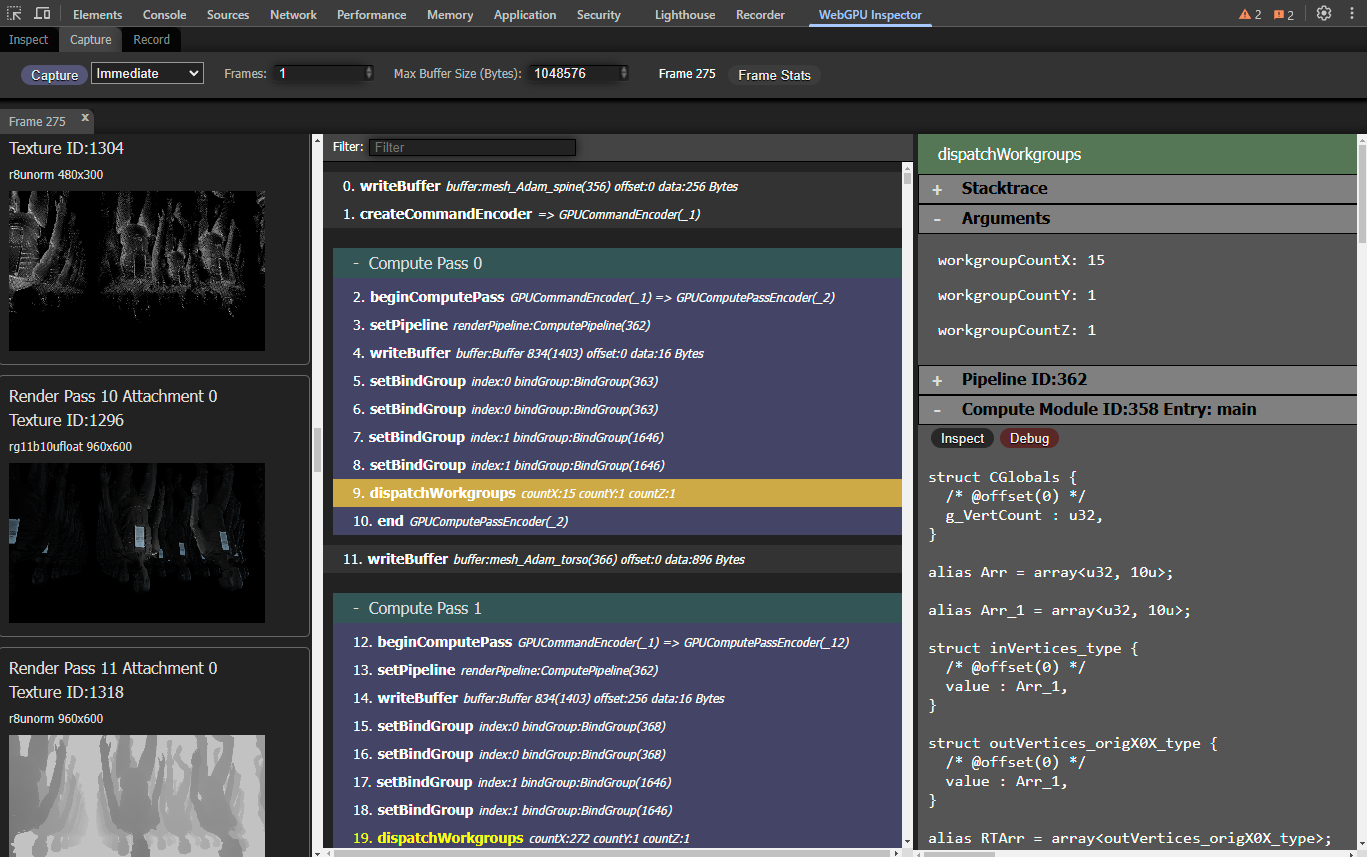
The shader debugger is an experimental work in progress and not guaranteed to work on all shaders. It supports compute, vertex, and fragment shaders.
The shader debugger is a CPU interpreter of WGSL shaders. Because it does not actually run on the GPU, there will be some differences in how the shader is executed compared to running on the GPU. The shader debugger steps through a single thread of execution of the shader, whereas on the GPU the shader is SIMD multithreaded. This means some shader behaviors, like workgroup shared memory and barrier functions, will not behave the same with the shader debugger. The shader debugger is not suitable for debugging issues that invove these things, or issues like race conditions. The shader debugger is best suited for debugging things like shader logic issues.
To properly debug the shader, all buffers and textures used by the shader will need to have been captured. Large buffers may have been skipped, due to the Max Buffer Size capture property. If a buffer was skipped due to being too large, increase the Max Buffer Size to accommodate for the size needed by the buffer and capture the frame again.
 ## Debugging a vertex shader
###### [Back to top](#shader-debugger-experimental)
Select a **draw** or **drawIndexed** command from the capture. The command details include the render pipeline and its shader modules. Open the **Vertex Module** section (or the combined shader module section, if the pipeline uses a single module for both stages) and press the **Debug** / **Debug Vertex** button to start debugging the vertex shader for that draw. This opens a debugger tab for the selected vertex stage.
Instead of the compute **Thread ID**, the vertex debugger's toolbar provides a **Vertex** and an **Instance** input:
- **Vertex** is the `@builtin(vertex_index)` of the vertex you wish to debug.
- **Instance** is the `@builtin(instance_index)`.
When you start debugging, the inspector performs the "vertex fetch" that the GPU would normally do: it decodes the draw's captured vertex buffers according to the pipeline's vertex layout and feeds the resulting attribute values (plus the vertex/instance builtins) into the shader for the selected vertex. All vertex buffers used by the draw must have been captured for this to work; see the Max Buffer Size note above.
## Debugging a fragment shader
###### [Back to top](#shader-debugger-experimental)
Select a **draw** or **drawIndexed** command, open the **Fragment Module** section (or the combined shader module section), and press the **Debug** / **Debug Fragment** button. Fragment debugging works by picking a pixel in the draw's render target.
The fragment debugger's toolbar provides **Pixel X**, **Y**, **Instance**, and **Prim** inputs. Enter the pixel you want to debug and start debugging. **Prim** selects a specific primitive (triangle index) to debug at the pixel; the default of `-1` selects the front-most primitive covering it. The inspector then reproduces what the GPU rasterizer does:
1. It assembles the draw into triangles from the index/vertex buffers and topology.
2. It runs the vertex shader for the relevant vertices and rasterizes to find the triangle that covers the picked pixel.
3. It builds the four perspective-correct, interpolated inputs of the 2×2 pixel quad that contains the picked pixel, so that derivatives (`dpdx`/`dpdy`) and texture sampling resolve correctly.
You step through the picked pixel's lane; the other three lanes of the quad are advanced in lockstep at derivative and texture-sampling points. If no primitive in the draw covers the entered pixel, a message is shown in the toolbar (for example, `No primitive covers pixel (x, y)`) — pick a different pixel that lies inside the drawn geometry.
Rather than entering a pixel by hand, you can use [Pixel History](capture.md#pixel-history) to click a pixel in a render-pass attachment, see every fragment that touched it, and open the fragment debugger pre-seeded with that fragment's pixel, instance, and primitive.
## Debugging a vertex shader
###### [Back to top](#shader-debugger-experimental)
Select a **draw** or **drawIndexed** command from the capture. The command details include the render pipeline and its shader modules. Open the **Vertex Module** section (or the combined shader module section, if the pipeline uses a single module for both stages) and press the **Debug** / **Debug Vertex** button to start debugging the vertex shader for that draw. This opens a debugger tab for the selected vertex stage.
Instead of the compute **Thread ID**, the vertex debugger's toolbar provides a **Vertex** and an **Instance** input:
- **Vertex** is the `@builtin(vertex_index)` of the vertex you wish to debug.
- **Instance** is the `@builtin(instance_index)`.
When you start debugging, the inspector performs the "vertex fetch" that the GPU would normally do: it decodes the draw's captured vertex buffers according to the pipeline's vertex layout and feeds the resulting attribute values (plus the vertex/instance builtins) into the shader for the selected vertex. All vertex buffers used by the draw must have been captured for this to work; see the Max Buffer Size note above.
## Debugging a fragment shader
###### [Back to top](#shader-debugger-experimental)
Select a **draw** or **drawIndexed** command, open the **Fragment Module** section (or the combined shader module section), and press the **Debug** / **Debug Fragment** button. Fragment debugging works by picking a pixel in the draw's render target.
The fragment debugger's toolbar provides **Pixel X**, **Y**, **Instance**, and **Prim** inputs. Enter the pixel you want to debug and start debugging. **Prim** selects a specific primitive (triangle index) to debug at the pixel; the default of `-1` selects the front-most primitive covering it. The inspector then reproduces what the GPU rasterizer does:
1. It assembles the draw into triangles from the index/vertex buffers and topology.
2. It runs the vertex shader for the relevant vertices and rasterizes to find the triangle that covers the picked pixel.
3. It builds the four perspective-correct, interpolated inputs of the 2×2 pixel quad that contains the picked pixel, so that derivatives (`dpdx`/`dpdy`) and texture sampling resolve correctly.
You step through the picked pixel's lane; the other three lanes of the quad are advanced in lockstep at derivative and texture-sampling points. If no primitive in the draw covers the entered pixel, a message is shown in the toolbar (for example, `No primitive covers pixel (x, y)`) — pick a different pixel that lies inside the drawn geometry.
Rather than entering a pixel by hand, you can use [Pixel History](capture.md#pixel-history) to click a pixel in a render-pass attachment, see every fragment that touched it, and open the fragment debugger pre-seeded with that fragment's pixel, instance, and primitive.
Fragment debugging requires the draw's vertex buffers (and, for indexed draws, index buffer) to have been captured, since the inspector re-runs the vertex shader and rasterizes to locate the picked pixel.
 button to start debugging
that invocation. Keyboard shortcut: **F8**
### Debugger Controls

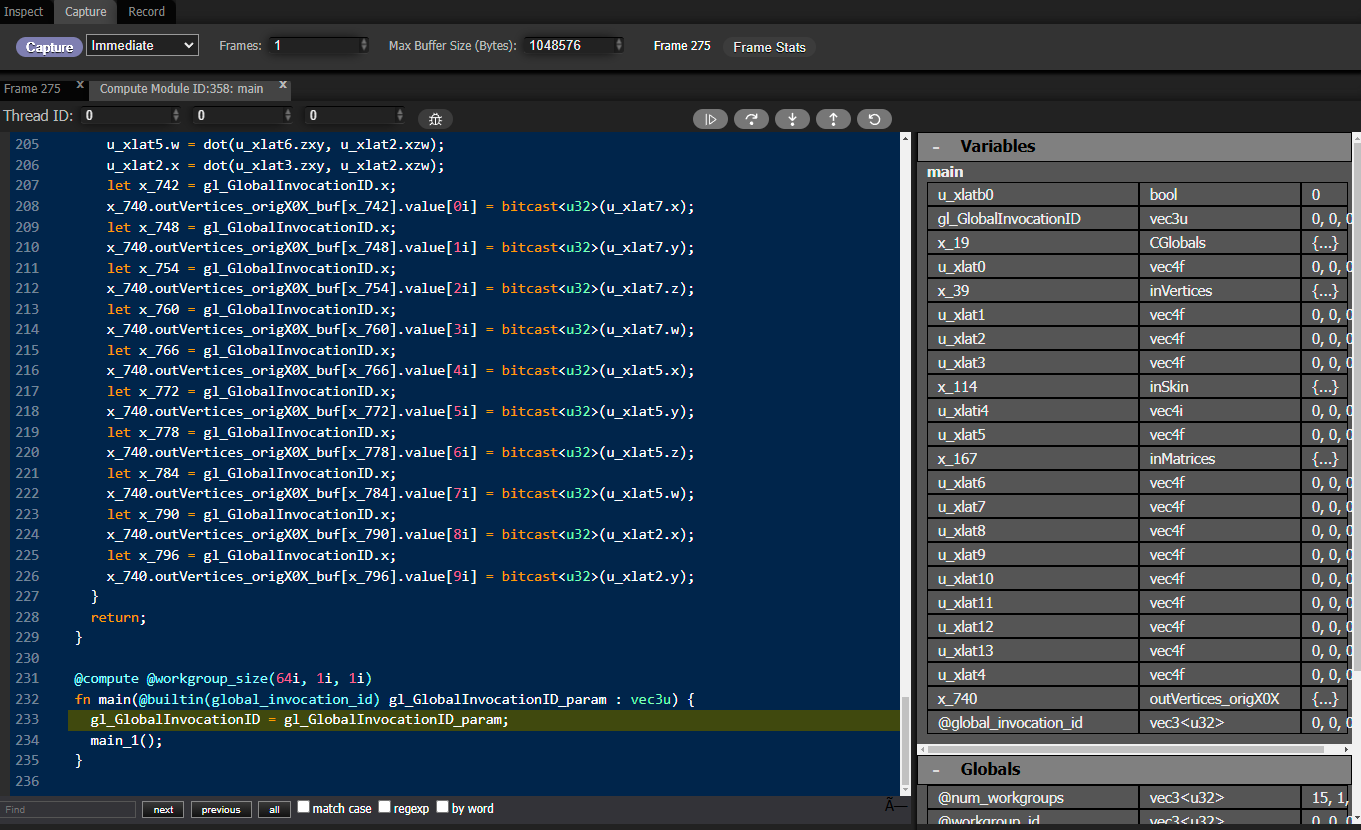
The shader debugger will start paused on the first statement of the compute shader kernel.
The toolbar at the top gives controls for stepping through the shader.
button to start debugging
that invocation. Keyboard shortcut: **F8**
### Debugger Controls

The shader debugger will start paused on the first statement of the compute shader kernel.
The toolbar at the top gives controls for stepping through the shader.
 Run from the current position all the way through to the end,
or until a breakpoint has been reached. Pressing this button again will pause the execution. Keyboard shortcut: **F5**
Run from the current position all the way through to the end,
or until a breakpoint has been reached. Pressing this button again will pause the execution. Keyboard shortcut: **F5**
 Execute the current statement, stepping over any function calls. Keyboard shortcut: **F10**
 Execute the current statement, stepping into any function calls. Keyboard shortcut: **F11**
 Run from the current position until the current block or function
has completed. Keyboard shortcut: **F12**
Run from the current position until the current block or function
has completed. Keyboard shortcut: **F12**
 Restart debugging the shader from the beginning. Keyboard shortcut: **F7**
The highlighted statement indicates the next statement to be executed, not the statement that was just executed.
The race detector scans a single workgroup. It detects races within a workgroup, caused by missing barriers. Races between different workgroups on storage memory are not decidable, as WebGPU provides no cross-workgroup ordering guarantees.