# timetk for R
[](https://github.com/business-science/timetk/actions/workflows/R-CMD-check.yaml)
[](https://cran.r-project.org/package=timetk)


[](https://app.codecov.io/gh/business-science/timetk)
> Making time series analysis in R easier.
Mission: To make time series analysis in R easier, faster, and more
enjoyable.
## Installation
*Download the development version with latest features*:
``` r
remotes::install_github("business-science/timetk")
```
*Or, download CRAN approved version*:
``` r
install.packages("timetk")
```
## Package Functionality
There are *many* R packages for working with Time Series data. Here’s
how `timetk` compares to the “tidy” time series R packages for data
visualization, wrangling, and feature engineeering (those that leverage
data frames or tibbles).
| Task | [timetk](https://business-science.github.io/timetk/) | [tsibble](https://tsibble.tidyverts.org/index.html) | [feasts](https://feasts.tidyverts.org/index.html) | [tibbletime (retired)](https://business-science.github.io/tibbletime/) |
|----|----|----|----|----|
| **Structure** | | | | |
| Data Structure | tibble (tbl) | tsibble (tbl_ts) | tsibble (tbl_ts) | tibbletime (tbl_time) |
| [**Visualization**](https://business-science.github.io/timetk/articles/TK04_Plotting_Time_Series.html) | | | | |
| Interactive Plots (plotly) | ✅ | :x: | :x: | :x: |
| Static Plots (ggplot) | ✅ | :x: | ✅ | :x: |
| [Time Series](https://business-science.github.io/timetk/articles/TK04_Plotting_Time_Series.html) | ✅ | :x: | ✅ | :x: |
| [Correlation, Seasonality](https://business-science.github.io/timetk/articles/TK05_Plotting_Seasonality_and_Correlation.html) | ✅ | :x: | ✅ | :x: |
| [**Data Wrangling**](https://business-science.github.io/timetk/articles/TK07_Time_Series_Data_Wrangling.html) | | | | |
| Time-Based Summarization | ✅ | :x: | :x: | ✅ |
| Time-Based Filtering | ✅ | :x: | :x: | ✅ |
| Padding Gaps | ✅ | ✅ | :x: | :x: |
| Low to High Frequency | ✅ | :x: | :x: | :x: |
| Imputation | ✅ | ✅ | :x: | :x: |
| Sliding / Rolling | ✅ | ✅ | :x: | ✅ |
| **Machine Learning** | | | | |
| [Time Series Machine Learning](https://business-science.github.io/timetk/articles/TK03_Forecasting_Using_Time_Series_Signature.html) | ✅ | :x: | :x: | :x: |
| [Anomaly Detection](https://business-science.github.io/timetk/articles/TK08_Automatic_Anomaly_Detection.html) | ✅ | :x: | :x: | :x: |
| [Clustering](https://business-science.github.io/timetk/articles/TK09_Clustering.html) | ✅ | :x: | :x: | :x: |
| [**Feature Engineering (recipes)**](https://business-science.github.io/timetk/articles/TK03_Forecasting_Using_Time_Series_Signature.html) | | | | |
| Date Feature Engineering | ✅ | :x: | :x: | :x: |
| Holiday Feature Engineering | ✅ | :x: | :x: | :x: |
| Fourier Series | ✅ | :x: | :x: | :x: |
| Smoothing & Rolling | ✅ | :x: | :x: | :x: |
| Padding | ✅ | :x: | :x: | :x: |
| Imputation | ✅ | :x: | :x: | :x: |
| **Cross Validation (rsample)** | | | | |
| [Time Series Cross Validation](https://business-science.github.io/timetk/reference/time_series_cv.html) | ✅ | :x: | :x: | :x: |
| [Time Series CV Plan Visualization](https://business-science.github.io/timetk/reference/plot_time_series_cv_plan.html) | ✅ | :x: | :x: | :x: |
| **More Awesomeness** | | | | |
| [Making Time Series (Intelligently)](https://business-science.github.io/timetk/articles/TK02_Time_Series_Date_Sequences.html) | ✅ | ✅ | :x: | ✅ |
| [Handling Holidays & Weekends](https://business-science.github.io/timetk/articles/TK02_Time_Series_Date_Sequences.html) | ✅ | :x: | :x: | :x: |
| [Class Conversion](https://business-science.github.io/timetk/articles/TK00_Time_Series_Coercion.html) | ✅ | ✅ | :x: | :x: |
| [Automatic Frequency & Trend](https://business-science.github.io/timetk/articles/TK06_Automatic_Frequency_And_Trend_Selection.html) | ✅ | :x: | :x: | :x: |
## Getting Started
- [Visualizing Time
Series](https://business-science.github.io/timetk/articles/TK04_Plotting_Time_Series.html)
- [Wrangling Time
Series](https://business-science.github.io/timetk/articles/TK07_Time_Series_Data_Wrangling.html)
- [Full Time Series Machine Learning and Feature Engineering
Tutorial](https://business-science.github.io/timetk/articles/TK03_Forecasting_Using_Time_Series_Signature.html)
- [API Documentation](https://business-science.github.io/timetk/) for
articles and a [complete list of function
references](https://business-science.github.io/timetk/reference/index.html).
## Summary
Timetk is an amazing package that is part of the `modeltime` ecosystem
for time series analysis and forecasting. The forecasting system is
extensive, and it can take a long time to learn:
- Many algorithms
- Ensembling and Resampling
- Machine Learning
- Deep Learning
- Scalable Modeling: 10,000+ time series
Your probably thinking how am I ever going to learn time series
forecasting. Here’s the solution that will save you years of struggling.
## Take the High-Performance Forecasting Course
> Become the forecasting expert for your organization
 [*High-Performance Time Series
Course*](https://university.business-science.io/p/ds4b-203-r-high-performance-time-series-forecasting/)
### Time Series is Changing
Time series is changing. **Businesses now need 10,000+ time series
forecasts every day.** This is what I call a *High-Performance Time
Series Forecasting System (HPTSF)* - Accurate, Robust, and Scalable
Forecasting.
**High-Performance Forecasting Systems will save companies by improving
accuracy and scalability.** Imagine what will happen to your career if
you can provide your organization a “High-Performance Time Series
Forecasting System” (HPTSF System).
### How to Learn High-Performance Time Series Forecasting
I teach how to build a HPTFS System in my [**High-Performance Time
Series Forecasting
Course**](https://university.business-science.io/p/ds4b-203-r-high-performance-time-series-forecasting).
You will learn:
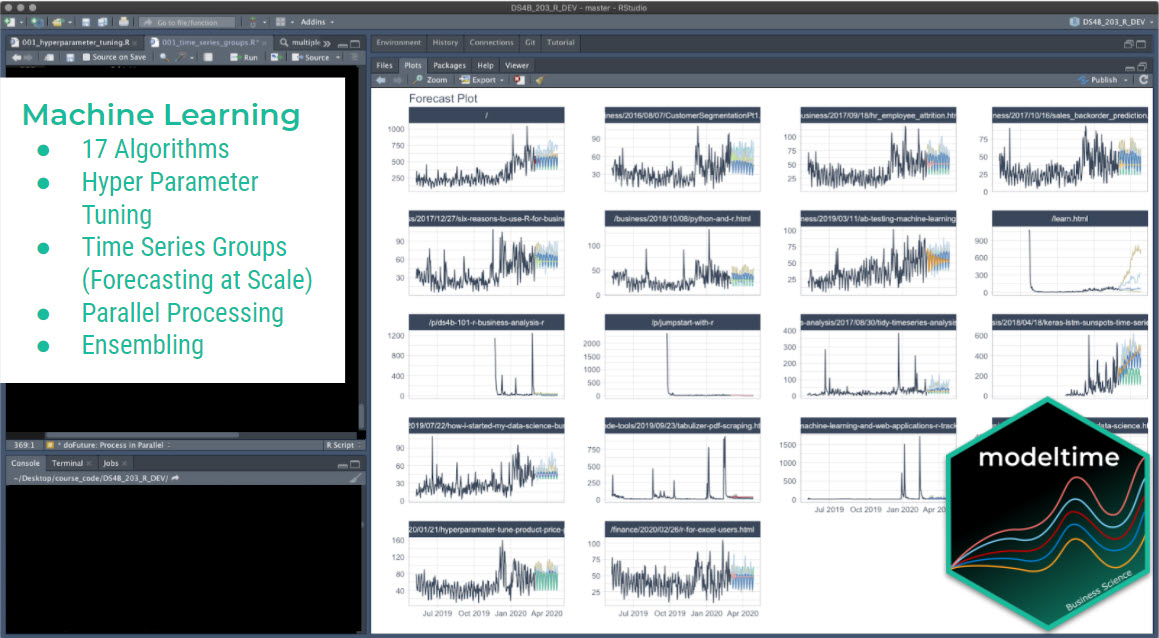
- **Time Series Machine Learning** (cutting-edge) with `Modeltime` - 30+
Models (Prophet, ARIMA, XGBoost, Random Forest, & many more)
- **Deep Learning** with `GluonTS` (Competition Winners)
- **Time Series Preprocessing**, Noise Reduction, & Anomaly Detection
- **Feature engineering** using lagged variables & external regressors
- **Hyperparameter Tuning**
- **Time series cross-validation**
- **Ensembling** Multiple Machine Learning & Univariate Modeling
Techniques (Competition Winner)
- **Scalable Forecasting** - Forecast 1000+ time series in parallel
- and more.
[*High-Performance Time Series
Course*](https://university.business-science.io/p/ds4b-203-r-high-performance-time-series-forecasting/)
### Time Series is Changing
Time series is changing. **Businesses now need 10,000+ time series
forecasts every day.** This is what I call a *High-Performance Time
Series Forecasting System (HPTSF)* - Accurate, Robust, and Scalable
Forecasting.
**High-Performance Forecasting Systems will save companies by improving
accuracy and scalability.** Imagine what will happen to your career if
you can provide your organization a “High-Performance Time Series
Forecasting System” (HPTSF System).
### How to Learn High-Performance Time Series Forecasting
I teach how to build a HPTFS System in my [**High-Performance Time
Series Forecasting
Course**](https://university.business-science.io/p/ds4b-203-r-high-performance-time-series-forecasting).
You will learn:
- **Time Series Machine Learning** (cutting-edge) with `Modeltime` - 30+
Models (Prophet, ARIMA, XGBoost, Random Forest, & many more)
- **Deep Learning** with `GluonTS` (Competition Winners)
- **Time Series Preprocessing**, Noise Reduction, & Anomaly Detection
- **Feature engineering** using lagged variables & external regressors
- **Hyperparameter Tuning**
- **Time series cross-validation**
- **Ensembling** Multiple Machine Learning & Univariate Modeling
Techniques (Competition Winner)
- **Scalable Forecasting** - Forecast 1000+ time series in parallel
- and more.
Become the Time Series Expert for your organization.
Take
the High-Performance Time Series Forecasting Course
## Acknowledgements
The `timetk` package wouldn’t be possible without other amazing time
series packages.
- `stats` - Basically every `timetk` function that uses a period
(frequency) argument owes it to `ts()`.
- `plot_acf_diagnostics()`: Leverages `stats::acf()`, `stats::pacf()`
& `stats::ccf()`
- `plot_stl_diagnostics()`: Leverages `stats::stl()`
- [lubridate](https://lubridate.tidyverse.org/): `timetk` makes heavy
use of `floor_date()`, `ceiling_date()`, and `duration()` for
“time-based phrases”.
- Add and Subtract Time (`%+time%` & `%-time%`):
`"2012-01-01" %+time% "1 month 4 days"` uses `lubridate` to
intelligently offset the day
- [xts](https://github.com/joshuaulrich/xts): Used to calculate
periodicity and fast lag automation.
- [forecast (retired)](https://pkg.robjhyndman.com/forecast/): Possibly
my favorite R package of all time. It’s based on `ts`, and its
predecessor is the `tidyverts` (`fable`, `tsibble`, `feasts`, and
`fabletools`).
- The `ts_impute_vec()` function for low-level vectorized imputation
using STL + Linear Interpolation uses `na.interp()` under the hood.
- The `ts_clean_vec()` function for low-level vectorized imputation
using STL + Linear Interpolation uses `tsclean()` under the hood.
- Box Cox transformation `auto_lambda()` uses `BoxCox.Lambda()`.
- [tibbletime
(retired)](https://business-science.github.io/tibbletime/): While
`timetk` does not import `tibbletime`, it uses much of the innovative
functionality to interpret time-based phrases:
- `tk_make_timeseries()` - Extends `seq.Date()` and `seq.POSIXt()`
using a simple phase like “2012-02” to populate the entire time
series from start to finish in February 2012.
- `filter_by_time()`, `between_time()` - Uses innovative endpoint
detection from phrases like “2012”
- `slidify()` is basically `rollify()` using `slider` (see below).
- [slider](https://slider.r-lib.org/): A powerful R package that
provides a `purrr`-syntax for complex rolling (sliding) calculations.
- `slidify()` uses `slider::pslide` under the hood.
- `slidify_vec()` uses `slider::slide_vec()` for simple vectorized
rolls (slides).
- [padr](https://edwinth.github.io/padr/): Used for padding time series
from low frequency to high frequency and filling in gaps.
- The `pad_by_time()` function is a wrapper for `padr::pad()`.
- See the `step_ts_pad()` to apply padding as a preprocessing recipe!
- [TSstudio](https://github.com/RamiKrispin/TSstudio): This is the best
interactive time series visualization tool out there. It leverages the
`ts` system, which is the same system the `forecast` R package uses. A
ton of inspiration for visuals came from using `TSstudio`.