



Transform SQL queries into interactive visual flow diagrams
Features • Dialects • Installation • Usage • Configuration • Contributing
--- SQL Crack is a VS Code extension that visualizes SQL queries as interactive execution flow diagrams. Understand complex queries at a glance, track data lineage across your entire workspace, and identify optimization opportunities with professional-grade visual analysis. > Inspired by [JSON Crack](https://jsoncrack.com/) and Snowflake Query Profile 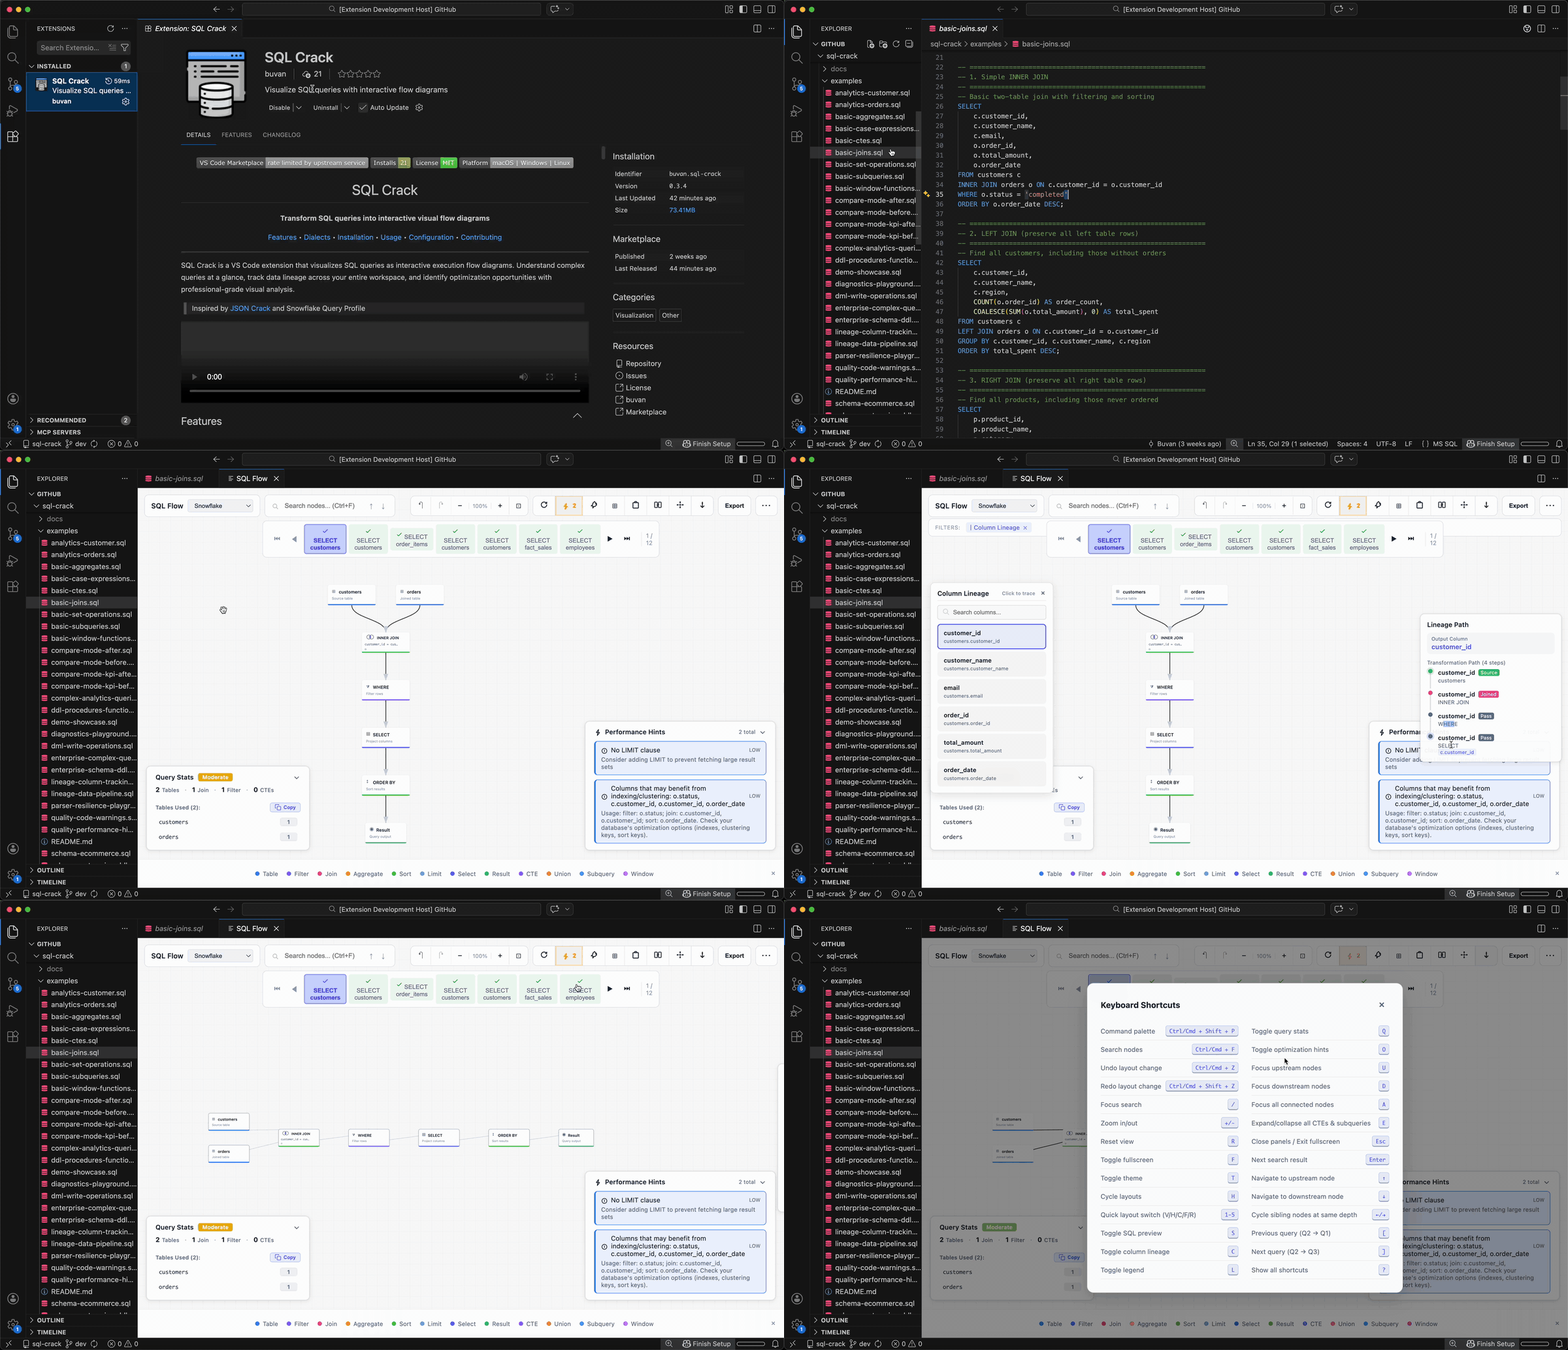 ## Features ### Query Visualization | Feature | Description | |---------|-------------| | **Execution Flow** | See how your SQL executes step-by-step with color-coded operation nodes | | **Multi-Query Support** | Visualize multiple statements with tab navigation (Q1, Q2, Q3...) | | **Column Lineage** | Click any output column to trace its transformation path through JOINs, aggregations, and calculations | | **Legend Bar (Default On)** | Bottom legend is visible on first open, dismissable, and remembers your preference | | **Command Palette** | Press `Cmd/Ctrl + Shift + P` inside the webview for quick action search | | **CTE & Subquery Expansion** | Double-click to expand CTEs/subqueries in floating cloud panels with independent pan/zoom | | **Undo / Redo Layout History** | Revert or re-apply drag, zoom, layout, and focus-mode changes with toolbar controls or keyboard shortcuts | | **Query Compare Mode** | Compare baseline vs current query side-by-side with added/removed/changed node highlights and stats deltas | | **Query Statistics** | Complexity score, CTE depth, fan-out analysis, and performance score (0-100) | > **Large graph behavior**: For SQL Flow graphs with `100+` nodes, SQL Crack automatically enables clustering to keep rendering responsive. Search and keyboard navigation follow the currently rendered graph, so collapsed clusters behave differently from a fully expanded graph. **Node Types**: Table (Blue) • Filter (Purple) • Join (Pink) • Aggregate (Amber) • Window (Fuchsia) • Sort (Green) • Limit (Cyan) • Select (Indigo) • Union/Set Op (Slate) • CTE (Purple) • Subquery (Violet) • Case (Orange) • Result (Green) **Operation Badges**: READ (Blue) • WRITE (Red) • DERIVED (Teal) • CTE (Purple) • SQ (Violet) • INSERT (Green) • UPDATE (Amber) • DELETE (Dark Red) • MERGE (Violet) • CTAS (Cyan) --- ### Workspace Analysis Analyze cross-file dependencies across your entire SQL project with three main views: #### Graph View Dependency graph showing file and table relationships with color-coded edges for SELECT, JOIN, INSERT, UPDATE, and DELETE operations. Includes a selection panel with upstream/downstream context, focus mode, and an index freshness badge, plus guided empty-state prompts when the graph is empty or search yields no matches. #### Lineage View Explore data lineage across tables, views, and CTEs with: - **Interactive Graph** — Animated flow edges showing data direction - **Legend Panel** — Collapsible reference for node types and column colors - **Mini-Map** — Overview panel for navigating large graphs - **Column Type Colors** — Primary (Gold), Numeric (Blue), Text (Green), DateTime (Purple), JSON (Teal) - **Focus Modes** — View upstream only (`U`), downstream only (`D`), or all connections (`A`) - **Trace Controls** — Trace Up/Down buttons to highlight full upstream/downstream lineage - **Table Browser** — Search and browse all tables, views, and CTEs with schema details and cross-references #### Impact Analysis Analyze change impact (MODIFY/RENAME/DROP) with severity indicators, grouped transitive impacts, and source → target column paths. **Common Features** (all views): - Click nodes to open files, double-click to visualize SQL - Pan/zoom navigation with search (regex and case-sensitivity options) - Statistics panel showing files, tables, views, and references - Orphaned/missing definition badges with click-to-navigate - Incremental parsing with SHA-256 hashing and auto-update on save --- ### Smart Analysis | Analysis | Description | |----------|-------------| | **Quality Warnings** | Unused CTEs, dead columns, duplicate subqueries, repeated table scans | | **Performance Hints** | Filter pushdown, join order, index suggestions, non-sargable expressions | | **Performance Score** | 0-100 score based on detected anti-patterns | | **Inline Diagnostics** | SQL Crack hints surface as VS Code diagnostics with a quick fix to open SQL Flow | ### Parser Reliability | Capability | Description | |------------|-------------| | **Partial Parse Fallback** | If AST parsing fails, SQL Crack falls back to regex extraction to still render best-effort tables/joins | | **Auto-Retry Dialect** | Detects dialect-specific syntax patterns and retries parsing with the correct dialect when the selected one fails | | **Nested CTE Hoisting** | Automatically rewrites Snowflake/Tableau-style `FROM (WITH ... SELECT ...)` subqueries to top-level CTEs for full visualization | | **PostgreSQL Syntax Preprocessing** | Automatically rewrites `AT TIME ZONE`, `timestamptz '...'`, and other type-prefixed literals for full AST parsing, including during dialect auto-retry | | **Safer Dialect Detection** | Reduces false positives in dialect pattern matching (for example time literals like `00:00:00`) so valid queries are less likely to fall back unnecessarily | | **Large File Handling** | Parses within configurable file/statement limits and clearly reports truncation instead of failing hard | | **Web Worker Parsing** | SQL parsing runs off the main thread via a dedicated Web Worker, keeping the UI responsive during large queries. Falls back to synchronous parsing when workers are unavailable. | | **Timeout Protection** | Configurable parse timeout prevents UI hangs on pathological queries | | **MERGE / UPSERT Coverage** | Supports MERGE-style visualization and dialect-native upsert patterns (`ON CONFLICT`, `ON DUPLICATE KEY`) | | **TVF Awareness** | Recognizes common table-valued functions across PostgreSQL, Snowflake, BigQuery, and SQL Server | | **DBT/Jinja Preprocessing** | Automatically rewrites `{{ ref() }}`, `{{ source() }}`, `{% if/else %}`, and other Jinja templates to valid SQL so DBT projects visualize correctly | | **Actionable Parse Errors** | Parse diagnostics include source line context in the badge and canvas overlay, not just line/column numbers | **Performance Icons**: Filter Pushdown (⬆) • Non-Sargable (🚫) • Join Order (⇄) • Index Suggestion (📇) • Repeated Scan (🔄) • Complex (🧮) > **Note**: This is heuristic-based static analysis. For production optimization, validate with actual query plans (`EXPLAIN ANALYZE`). --- ### Interactive Navigation - **Click to Navigate** — Click nodes to jump to SQL source, click edges to view JOIN/WHERE clauses - **Breadcrumb Trail** — Navigate through nested CTEs with clickable breadcrumbs - **Search** — Find nodes by name with `Cmd/Ctrl + F` - **Editor Sync** — Bidirectional highlighting between editor and flow diagram - **Hover Tooltips** — Detailed information on hover for nodes and edges --- ### Layout & Export - **Layout Picker** — Toolbar picker with SVG icons for vertical, horizontal, compact, force, and radial layouts - **Layout Shortcuts** — Cycle layouts with `H` or jump directly with keys `1`-`5` - **Auto-Refresh** — Updates automatically as you edit (configurable debounce) - **Export Options** — PNG, SVG, Mermaid.js, or clipboard copy - **View Modes** — Display beside editor or in a new tab - **Pin Visualizations** — Save snapshots as persistent tabs - **Fullscreen** — Press `F` for distraction-free viewing --- ## Supported Dialects MySQL • PostgreSQL • SQL Server • MariaDB • SQLite • Snowflake • BigQuery • Redshift • Hive • Athena • Trino • Oracle • Teradata --- ## Installation ### From VS Code Marketplace (Recommended) 1. Open VS Code 2. Go to Extensions (`Cmd+Shift+X` / `Ctrl+Shift+X`) 3. Search for **"SQL Crack"** 4. Click **Install** Or install directly: [SQL Crack on Marketplace](https://marketplace.visualstudio.com/items?itemName=buvan.sql-crack) ### Cursor 1. Open Cursor 2. Go to Extensions (`Cmd+Shift+X` / `Ctrl+Shift+X`) 3. Search for **"buvan.sql-crack"** (use the publisher-qualified name for reliable results) 4. Click **Install** Or install from [Open VSX Registry](https://open-vsx.org/extension/buvan/sql-crack). ### From Source ```bash git clone https://github.com/buva7687/sql-crack.git cd sql-crack npm install npm run package ``` Install the generated `.vsix` file via **Extensions → ••• → Install from VSIX**. --- ## Usage ### Quick Start 1. Open any `.sql` file 2. Visualize using one of: - Click the **graph icon** in the editor title bar - Press `Cmd+Shift+L` (Mac) / `Ctrl+Shift+L` (Windows/Linux) - Right-click → **"SQL Crack: Visualize SQL Query"** > Cursor note: Some Cursor builds do not render custom editor-title icons consistently. If the title icon is not visible, run **SQL Crack: Visualize SQL Query** from the Command Palette (`Cmd/Ctrl+Shift+P`) or use the context menu. ### Workspace Analysis Analyze cross-file dependencies: - Right-click folder → **"SQL Crack: Analyze Workspace Dependencies"** - Command Palette → **"SQL Crack: Analyze Workspace Dependencies"** > **Tip:** Re-open the panel anytime by running the same command from the Command Palette. --- ## Keyboard Shortcuts ### Query Visualization | Shortcut | Action | |----------|--------| | `Cmd/Ctrl + Shift + L` | Open visualization | | `Cmd/Ctrl + Shift + P` | Open command palette | | `Cmd/Ctrl + F` or `/` | Search nodes | | `Enter` / `↓` | Next search result | | `↑` | Previous search result | | `Escape` | Clear selection | | `C` | Toggle column lineage | | `L` | Toggle legend | | `S` | Toggle SQL preview | | `Q` | Toggle query stats | | `O` | Toggle hints/optimization panel | | `H` | Cycle layout (vertical → horizontal → compact → force → radial) | | `1-5` | Jump directly to a specific layout option | | `E` | Expand/collapse all CTEs | | `U` / `D` / `A` | Focus mode: upstream / downstream / all | | `T` | Toggle theme | | `F` | Toggle fullscreen | | `R` | Reset view (fit to screen) | | `+` / `-` | Zoom in / out | | `Cmd/Ctrl + Z` | Undo latest layout change | | `Cmd/Ctrl + Shift + Z` | Redo layout change | | `[` / `]` | Previous/next query | | `?` | Show all shortcuts | ### Workspace Graph | Shortcut | Action | |----------|--------| | `Cmd/Ctrl + F` | Focus graph search | | `Escape` | Clear search or selection | | `F` | Toggle focus mode (neighbors only) | | `R` | Reset view (fit to screen) | ### Lineage View | Shortcut | Action | |----------|--------| | `U` | Focus upstream only | | `D` | Focus downstream only | | `A` | Show all connections | | `C` | Toggle column lineage | | `Scroll` | Zoom in/out | | `Drag` | Pan the view | ### Accessibility All toolbar buttons have ARIA labels for screen readers. Graph nodes are keyboard-navigable: | Key | Action | |-----|--------| | `Tab` | Focus next node | | `Enter` / `Space` | Select focused node | | `Arrow keys` | Navigate between nodes | | `Escape` | Deselect and return to canvas | UI transitions and entrance animations also respect `prefers-reduced-motion`. --- ## Configuration ### Core Settings | Setting | Default | Description | |---------|---------|-------------| | `sqlCrack.defaultDialect` | `MySQL` | SQL dialect for parsing | | `sqlCrack.autoDetectDialect` | `true` | Auto-detect dialect from query content. Disable for single-dialect repos where auto-detection produces false positives. | | `sqlCrack.viewLocation` | `tab` | Panel location: `beside`, `tab` | | `sqlCrack.defaultLayout` | `vertical` | Initial SQL Flow graph layout: `vertical`, `horizontal`, `compact`, `force`, `radial`. Layout only; it does not change SQL execution semantics or lineage direction. | | `sqlCrack.autoRefresh` | `true` | Auto-refresh on SQL changes | | `sqlCrack.autoRefreshDelay` | `500` | Debounce delay in ms (100-5000) | | `sqlCrack.gridStyle` | `lines` | Visual canvas background style: `dots`, `lines`, `none` | | `sqlCrack.nodeAccentPosition` | `left` | Visual-only node accent strip position: `left`, `bottom` | | `sqlCrack.showMinimap` | `auto` | Minimap visibility: `auto`, `always`, `never`. `auto` shows it only for multi-node graphs. | | `sqlCrack.colorblindMode` | `off` | Color accessibility mode: `off`, `deuteranopia`, `protanopia`, `tritanopia` | ### Workspace Settings | Setting | Default | Description | |---------|---------|-------------| | `sqlCrack.workspaceAutoIndexThreshold` | `50` | Max files to auto-index (10-500) | | `sqlCrack.workspaceLineageDepth` | `5` | Default lineage traversal depth (1-20) | | `sqlCrack.workspaceGraphDefaultMode` | `tables` | Default Graph tab mode: `files`, `tables` | ### Custom File Extensions | Setting | Default | Description | |---------|---------|-------------| | `sqlCrack.additionalFileExtensions` | `[]` | Additional file extensions to treat as SQL (e.g. `.hql`, `.bteq`, `.tpt`, `.dbsql`, `.sql.j2`). With or without the leading dot is accepted and normalized. Compound extensions like `sql.j2` are preserved. | Files with these extensions will show the SQL Crack icon in the editor title bar and can be visualized like `.sql` files. They are also included in workspace analysis (find files, index), trigger incremental index updates on save/create/delete, and watcher patterns are refreshed when the extension setting changes. Workspace indexing intentionally skips dependency/build folders (`node_modules`, `.git`, `dist`, `build`). ### Custom Functions | Setting | Default | Description | |---------|---------|-------------| | `sqlCrack.customAggregateFunctions` | `[]` | Custom aggregate function names (e.g., `["MY_SUM"]`) | | `sqlCrack.customWindowFunctions` | `[]` | Custom window function names (e.g., `["MY_RANK"]`) | ### Advanced Settings | Setting | Default | Description | |---------|---------|-------------| | `sqlCrack.advanced.defaultTheme` | `light` | Theme: `auto`, `dark`, `light` | | `sqlCrack.advanced.showDiagnosticsInProblems` | `false` | Show SQL Crack hints/errors in VS Code Problems panel | | `sqlCrack.advanced.showDeadColumnHints` | `true` | Show warnings for unused columns | | `sqlCrack.advanced.combineDdlStatements` | `false` | Merge consecutive DDL into single tab | | `sqlCrack.advanced.maxFileSizeKB` | `100` | Max SQL file size before truncation handling (10-10000) | | `sqlCrack.advanced.maxStatements` | `50` | Max statements parsed per file (1-500) | | `sqlCrack.advanced.deferredQueryThreshold` | `50` | Query count threshold before SQL Flow compacts non-active query graphs and hydrates them on demand (1-500) | | `sqlCrack.advanced.parseTimeoutSeconds` | `5` | Parser timeout in seconds (1-60) | | `sqlCrack.advanced.debugLogging` | `false` | Enable verbose SQL Crack output-channel logs | | `sqlCrack.advanced.workspaceUxInstrumentation` | `false` | Enable local-only Workspace Graph UX metrics in the SQL Crack output channel; no external telemetry is sent | | `sqlCrack.advanced.cacheTTLHours` | `24` | Workspace index cache duration in hours. `0` skips cached restore and forces a rebuild when opening Workspace Dependencies (max 168) | --- ## Troubleshooting ### Common Issues | Problem | Solution | |---------|----------| | **Icon not showing for custom extensions** | In Settings → **SQL Crack** → **Additional File Extensions**, add one item per extension (e.g. .hql, .tpt). With or without a leading dot is fine; the extension normalizes automatically. Reload the window if the icon still doesn’t appear. | | **Parse error on valid SQL** | Try a different dialect from the dropdown. SQL Crack auto-retries when it detects a stronger dialect match, but some vendor-specific syntax may still require manually switching (PostgreSQL is usually the most permissive fallback). | | **Graph is slow with large files** | SQL files over 100KB or 50+ statements may be slow. Try visualizing smaller sections by selecting text first. | | **CTE/Subquery not expanding** | Double-click the node. If it has no children, it may be a simple reference. | | **Workspace indexing stuck** | Click Cancel in the notification, then try again. For very large workspaces, increase `workspaceAutoIndexThreshold`. | | **Columns not highlighting** | Press `C` to enable column lineage mode first, then click output columns in the SELECT node. | ### Debug Mode To see detailed logs: 1. Enable `sqlCrack.advanced.debugLogging` in VS Code settings 2. Open **View → Output** and select **SQL Crack** from the dropdown 3. Extension logs appear in the Output Channel as you interact For lower-level diagnostics you can also open **Help → Toggle Developer Tools → Console** and filter by "SQL Crack". ### Resetting State If the extension behaves unexpectedly: 1. Run **"Developer: Reload Window"** from Command Palette 2. If issues persist, disable/re-enable the extension 3. For workspace index issues, re-run **"SQL Crack: Analyze Workspace Dependencies"** to rebuild the index, or set **Cache TTL** to `0` (Advanced) and reload the window --- ## Privacy - **100% Local** — All processing happens in VS Code - **No Network Calls** — Your SQL never leaves your machine - **No Telemetry** — Zero data collection - **Open Source** — Fully auditable code --- ## Development ```bash npm install # Install dependencies npm run compile # Build extension npm run watch # Watch mode npm run typecheck # Type check npm run lint # Lint code ``` Press `F5` to launch the Extension Development Host. ### Architecture Overview ```text src/ ├── extension.ts # Extension entrypoint, commands, lifecycle ├── visualizationPanel.ts # SQL Flow webview panel orchestration ├── dialects/ # Dialect registry/config ├── shared/ # Cross-layer tokens/utils/messages │ └── messages/ # Typed host/webview message contracts ├── webview/ # Browser-side SQL Flow runtime │ ├── index.ts # Webview bootstrap + wiring │ ├── sqlParser.ts # Parse orchestrator │ ├── renderer.ts # Render orchestrator │ ├── parser/ # Extracted parser modules (validation, dialects, hints, statements, extractors) │ ├── rendering/ # Node/edge/cloud/viewport rendering modules │ ├── features/ # Export, lineage, theme, minimap, focus, search, metadata │ ├── interaction/ # Event listeners, drag/zoom/keyboard, pulse/selection │ ├── navigation/ # Node/table/keyboard navigation helpers │ ├── panels/ # Info/stats/sql panel renderers │ ├── state/ # Renderer state factories │ ├── constants/ # Color/theme constants │ ├── types/ # Webview runtime types │ ├── ui/ # Toolbar/context menu/tooltip/layout/command UI │ │ └── toolbar/ # Extracted toolbar component modules │ └── parser.worker.ts # Off-main-thread SQL parse worker └── workspace/ # Extension-host workspace analysis runtime ├── workspacePanel.ts # Workspace panel orchestrator ├── scanner.ts # SQL file discovery/scanning ├── indexManager.ts # Incremental index/cache/watcher ├── handlers/ # Message routing + command handlers ├── panel/ # Workspace panel/page/export/stats modules ├── lineage/ # Cross-file lineage graph + analyzers ├── extraction/ # Definition/reference extraction pipeline ├── graph/ # Workspace graph build/filter/layout modules └── ui/ # Workspace webview scripts/styles/views ``` **Data Flow**: 1. User opens `.sql` file → `extension.ts` creates `VisualizationPanel` 2. SQL text → `sqlParser.ts` (node-sql-parser) → AST → `FlowNode[]` + `FlowEdge[]` 3. Nodes/edges → `renderer.ts` → SVG with dagre layout 4. User interactions → message passing between webview and extension host --- ## Roadmap - ✅ **Phase 1** — Core visualization (execution flow, CTE expansion, fullscreen) - ✅ **Phase 2** — Developer productivity (quality warnings, column lineage, cloud panels) - ✅ **Phase 3** — Performance analysis (filter pushdown, join order, anti-pattern detection) - ✅ **Phase 4** — Workspace analysis (cross-file lineage, dependency graph, 3 view modes) - ✅ **Phase 5** — Polish & accessibility (keyboard navigation, ARIA labels, cancellable indexing) - ✅ **Phase 6** — Large-file modular refactor (parser/renderer/workspace UI split into focused modules) - ✅ **Phase 7** — Export preview with PDF support `0.9.0`: Security & reliability hardening — production dependency upgrades (`npm audit --omit=dev` reports 0 advisories), cryptographically strong CSP nonces and collision-free pin/tab IDs, stricter HTML-attribute / DOT / Mermaid export escaping, source-scoped auto-refresh and cursor-follow, a workspace index cache keyed by scope/dialect/config, and a non-blocking parser-worker timeout. `0.7.0` shipped on `2026-03-23`: Web Worker parsing (off-main-thread for large files) and architecture debt remediation (pure computation extraction, fake DOM testing, integration test coverage) are now part of the released baseline. --- ## Contributing Contributions are welcome! 1. **Fork** the repository 2. **Create** a feature branch (`git checkout -b feature/amazing-feature`) 3. **Commit** your changes (`git commit -m 'Add amazing feature'`) 4. **Push** to the branch (`git push origin feature/amazing-feature`) 5. **Open** a Pull Request ### Reporting Issues Found a bug or have a feature request? [Open an issue](https://github.com/buva7687/sql-crack/issues) with: - Clear description of the problem/feature - Steps to reproduce (for bugs) - SQL query example (if applicable) - VS Code and extension version --- ## License MIT License — see [LICENSE](LICENSE) for details. --- ## Acknowledgments - [JSON Crack](https://jsoncrack.com/) — Visual inspiration - [node-sql-parser](https://github.com/taozhi8833998/node-sql-parser) — SQL parsing - [dagre](https://github.com/dagrejs/dagre) — Graph layout - [jsPDF](https://github.com/parallax/jsPDF) — PDF export generation ---Made with SQL for the SQL community