# Using Quadrant [← README](../README.md) ## Bar - **Segments**: CPU, GPU, memory, drives and network each pair a Nerd Font glyph (or `C`/`G`/`M`/`D`/`N` with `barLabels letter`) with a live value. Network shows compact `↓`/`↑` byte rates, down first. Vertical bars stack the segments and drop the glyphs. `barLabels none` hides labels. Each segment toggles independently from its tab's **in bar** switch or the settings view; unchecking every segment leaves a compact system-monitor glyph. - **Left- or middle-click a segment** to open its tab, switch to it, or close the panel when that tab is already showing. Left- or middle-click the slot padding or icon-only fallback to toggle the panel on the last-used tab. **Right-click** opens btop on either target. **Scroll** over the slot to switch tabs while the panel is open. Hovering a segment shows its tooltip. - **GPU** is dedicated cards only; integrated graphics live on the CPU tab. When no dedicated card is detected the GPU slot shows **Drives** instead (`diskFallbackWithoutGpu`). A separate drives segment is off by default. - **Colour** (`barPalette`): for percentage segments, `theme` uses the urgent colour at 90 % until the value drops below 80 %; `heat` ramps from muted through accent to urgent; `vivid` uses a fixed metric hue until the same hot threshold switches it to urgent. Network rates use the foreground in `theme`, the muted floor colour in `heat`, and a fixed network hue in `vivid`. Network rates never trigger hot colouring. ## Panel Tabs combine hardware identity, graphs, stats, and top processes. Hiding a bar segment leaves its panel tab available. The GPU tab appears only when a dedicated card is selected and available. | Key | Action | | --- | --- | | `←` `→` or `1`–`N` | switch tab (`N` = visible tabs; GPU is omitted without a dedicated card) | | `↑` `↓` | move the cursor through the process rows (hover does the same; the row's tooltip shows the pid and a detail) | | uppercase `H` | every graph: last hour ↔ last minute (clicking the graph header or scrolling over the graph does the same) | | `S` | settings view (gear in the header) | | `R` | re-read system and disk identity and refresh the active tab | | `Esc` | close settings, then the panel | | `Tab` | keeps its Quattro meaning: switch to the adjacent bar panel | These shortcuts apply while a metric tab is visible. In settings, use the controls and close the view with the gear or `Esc`. The shell also maps lowercase `h` / `l` to tab navigation and `j` / `k` to process-row navigation; use uppercase `H` for history. The last-used tab survives closing and reopening the panel within the running shell. The history-window choice also stays until changed; closing the panel closes the settings view and clears the process cursor. ## Graphs and processes Click the graph's time/average/peak note, scroll over a graph, or press uppercase `H` to switch every graph between 60 s and 1 h. Hovering a graph shows the readings at that point. The header reports the displayed CPU stack total, memory usage, GPU busy, drive **read** rate, or network **download** rate. In the hour view, peak means the highest 10 s bucket average, so short spikes can be lower than in the minute view. Click a process-list heading to cycle between the stable roster order, descending value, and name. CPU, GPU, Memory, and Drives sum rows with the same display name; a grouped row's tooltip uses the lowest PID in the group. Network keeps separate process rows plus **Other traffic**. CPU, Memory, Drives, and attributed Network rows keep sparklines of up to thirty samples while they remain in the roster. GPU and **Other traffic** rows have no sparkline. See [measurement limits](METRICS.md) for what each process value represents. ## IPC The shell must be running with Quadrant enabled. Tab names in IPC are `cpu`, `gpu`, `mem`, `disk`, and `net`; segment names are `cpu`, `gpu`, `memory`, `disk`, and `network`. Unknown or unavailable tabs are ignored. The `set` method takes its value as JSON text: ```sh quickshell ipc -p "$OMARCHY_PATH/shell" call dev.bvisagie.quadrant showTab gpu # cpu | gpu | mem | disk | net quickshell ipc -p "$OMARCHY_PATH/shell" call dev.bvisagie.quadrant settings quickshell ipc -p "$OMARCHY_PATH/shell" call dev.bvisagie.quadrant setBarSegment disk true quickshell ipc -p "$OMARCHY_PATH/shell" call dev.bvisagie.quadrant set processCount 8 quickshell ipc -p "$OMARCHY_PATH/shell" call dev.bvisagie.quadrant set networkInterface '"wg0"' omarchy-shell shell summon dev.bvisagie.quadrant '{}' # open on last-used tab omarchy-shell shell hide dev.bvisagie.quadrant ``` The plugin also exposes `open`, `close`, `show`, `hide`, and `toggle` IPC methods. See [Settings](SETTINGS.md) for typed values and validation. ## Screenshots These captures show the current panel across dark, light, and monochrome Omarchy themes. Click a screenshot to view the original at full size.

CPU
Core activity and process CPU.
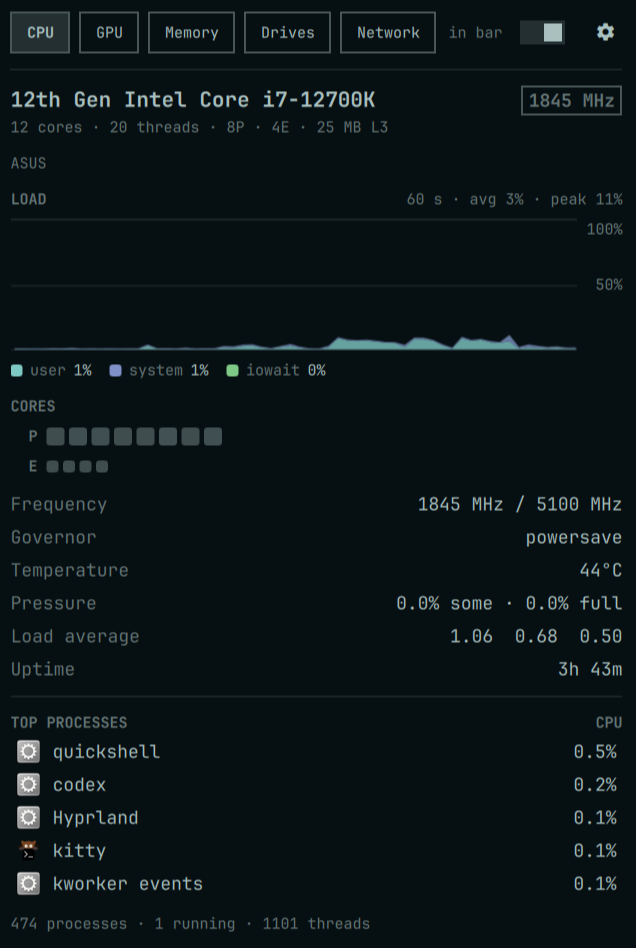
CPU tab showing an Intel Core i7-12700K, load history, physical cores, and top processes in a dark teal theme

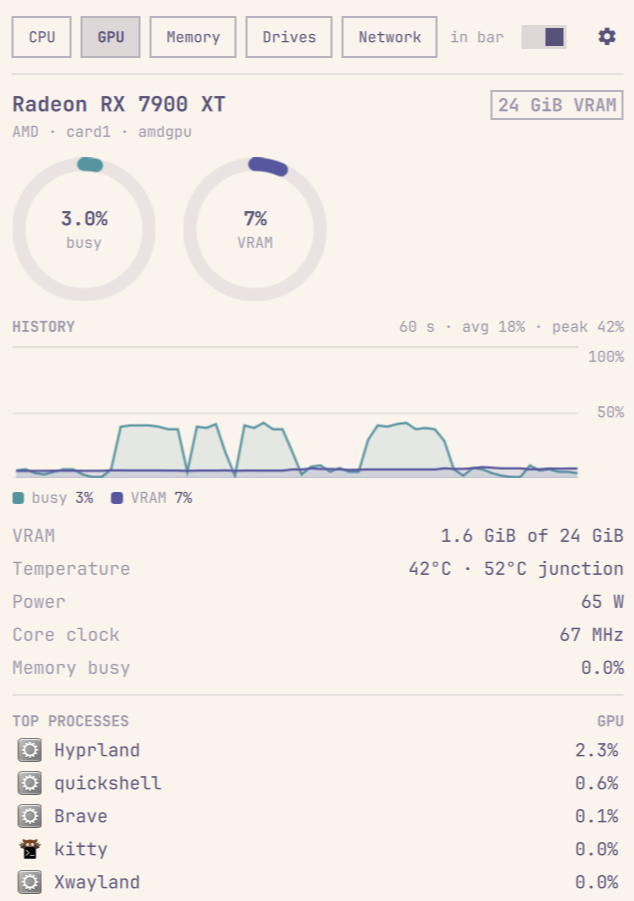
GPU
Dedicated GPU activity and VRAM.

GPU tab showing a Radeon RX 7900 XT, busy and VRAM gauges, history, and GPU processes in a light theme

Memory
RAM composition, pressure, and swap.
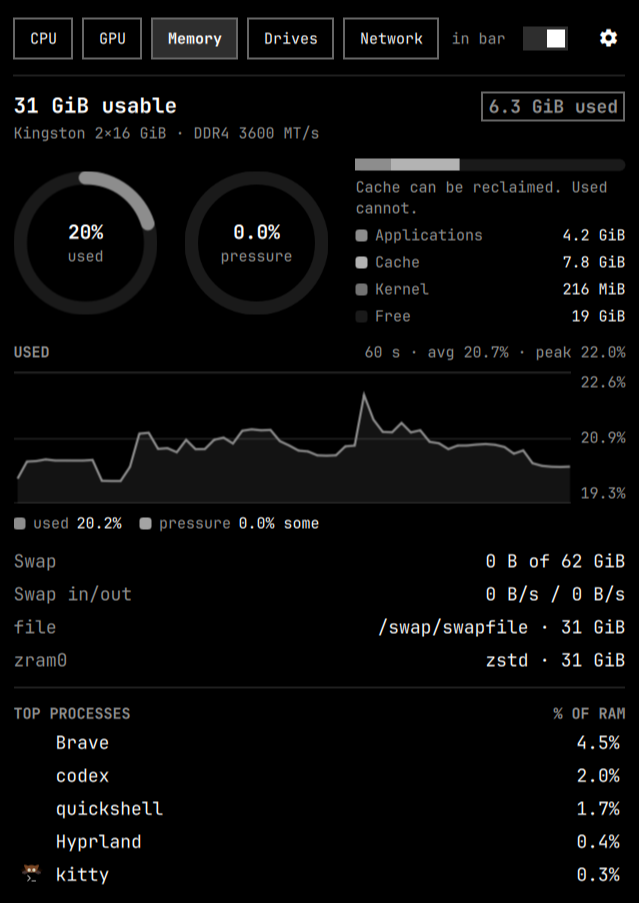
Memory tab showing used RAM, pressure, composition, memory history, swap, and process memory in a black monochrome theme

Drives
Disk selection, throughput, and mounts.
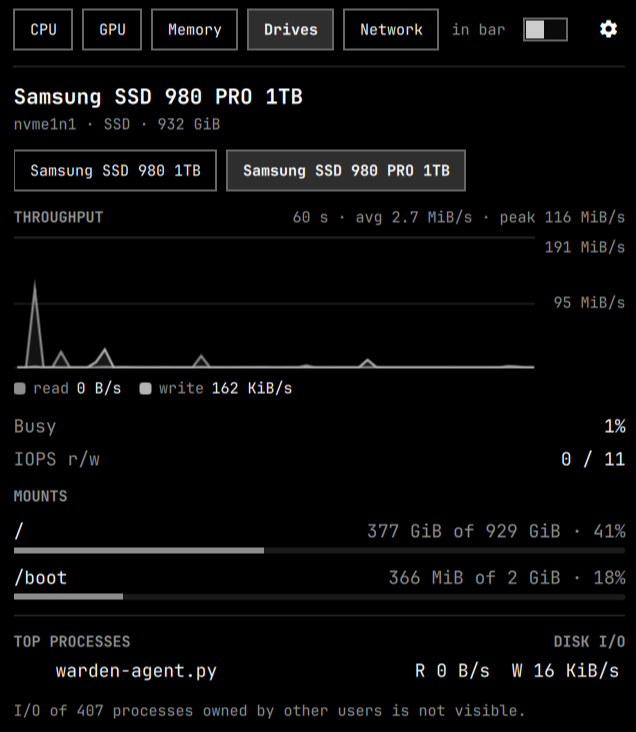
Drives tab showing a Samsung SSD, the disk picker, read and write throughput, mount usage, and process I/O
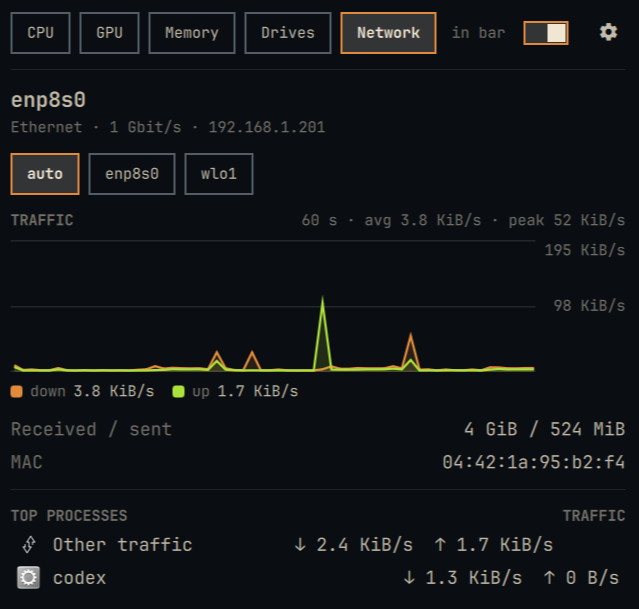
**Network** — interface selection, download/upload history, and TCP process attribution.

Network tab showing an Ethernet interface, interface picker, traffic graph, totals, and process traffic in a dark theme with orange and green accents

The [settings guide includes the full settings view](SETTINGS.md#settings-view).