{
"cells": [
{
"cell_type": "markdown",
"id": "trying-malawi",
"metadata": {},
"source": [
"## Final Product Using Tableau\n"
]
},
{
"cell_type": "markdown",
"id": "asian-radio",
"metadata": {},
"source": [
"The final step now required loading this information into Tableau to create graphical representations of this data. I wanted to put a partiuclar focus on the racial composition of these different neighborhoods, as well as look at popular professions. I was able to create a story with all three neighborhood spreadsheets, and included the original spreadsheet of 16,000 residents as a base for comparison. "
]
},
{
"cell_type": "markdown",
"id": "tight-enforcement",
"metadata": {},
"source": [
"The resulting story is below:"
]
},
{
"cell_type": "markdown",
"id": "45f97d42-1c30-47ea-bb5f-cd051b62e77d",
"metadata": {},
"source": [
" "
]
},
{
"cell_type": "markdown",
"id": "caceb5c7-d4a0-4a12-8275-007c7e94bfce",
"metadata": {},
"source": [
"[Visualizing Neighborhood Demographics](https://public.tableau.com/app/profile/henry.kemp/viz/CharlotteFInalProjectTableau/Story1)"
]
},
{
"cell_type": "markdown",
"id": "pointed-needle",
"metadata": {},
"source": [
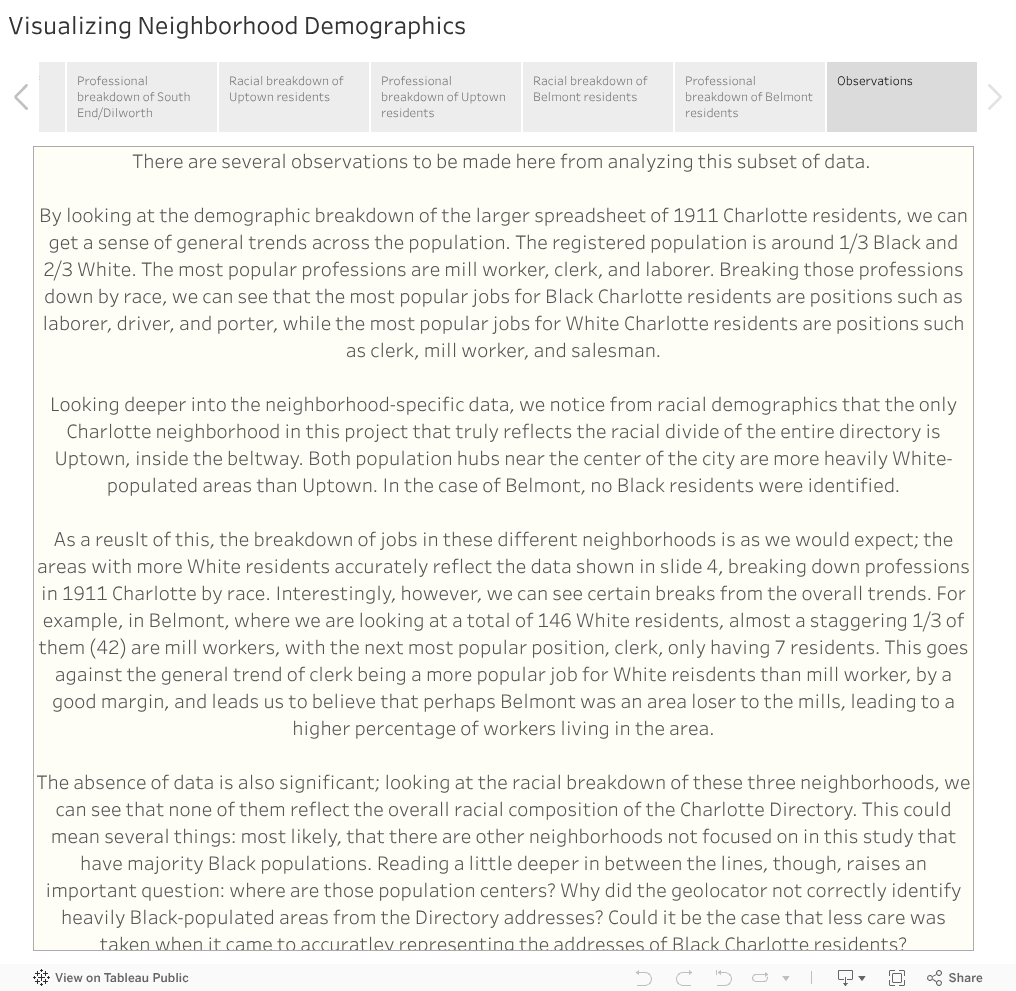
"Observations
\n",
"\n",
"I am copying some of the observations from the above Tableau Story to be highlighted here:\n",
"\n",
"By looking at the demographic breakdown of the larger spreadsheet of 1911 Charlotte residents, we can get a sense of general trends across the population. The registered population is around 1/3 Black and 2/3 White. The most popular professions are mill worker, clerk, and laborer. Breaking those professions down by race, we can see that the most popular jobs for Black Charlotte residents are positions such as laborer, driver, and porter, while the most popular jobs for White Charlotte residents are positions such as clerk, mill worker, and salesman.\n",
"\n",
"Looking deeper into the neighborhood-specific data, we notice from racial demographics that the only Charlotte neighborhood in this project that truly reflects the racial divide of the entire directory is Uptown, inside the beltway. Both population hubs near the center of the city are more heavily White-populated areas than Uptown. In the case of Belmont, no Black residents were identified.\n",
"\n",
"As a reuslt of this, the breakdown of jobs in these different neighborhoods is as we would expect; the areas with more White residents accurately reflect the data shown in slide 4, breaking down professions in 1911 Charlotte by race. Interestingly, however, we can see certain breaks from the overall trends. For example, in Belmont, where we are looking at a total of 146 White residents, almost a staggering 1/3 of them (42) are mill workers, with the next most popular position, clerk, only having 7 residents. This goes against the general trend of clerk being a more popular job for White reisdents than mill worker, by a good margin, and leads us to believe that perhaps Belmont was an area loser to the mills, leading to a higher percentage of workers living in the area.\n",
"\n",
"The absence of data is also significant; looking at the racial breakdown of these three neighborhoods, we can see that none of them reflect the overall racial composition of the Charlotte Directory. This could mean several things: most likely, that there are other neighborhoods not focused on in this study that have majority Black populations. Reading a little deeper in between the lines, though, raises an important question: where are those population centers? Why did the geolocator not correctly identify heavily Black-populated areas from the Directory addresses? Could it be the case that less care was taken when it came to accuratley representing the addresses of Black Charlotte residents?\n",
"\n"
]
},
{
"cell_type": "markdown",
"id": "younger-girlfriend",
"metadata": {},
"source": [
"Limitations
\n",
"\n",
"There are several limitations to the scope of this project. First and foremost, the conclusions drawn from the geocoded data should not be taken as the entire picture, merely that of a somewhat random sampling of the total data. Ultimately, the QGIS geocoding tool was only able to identify latitude and longitude coordinates for around 2,500 total entries of the original 16,000 listed, around 16% of the data. While the ability of the tool to identify some addresses and not others is unknown, this experiment still should not be seen as a true \"random sample\" of the Charlotte Directory data, as it is very possible that the results are skewed.\n",
"\n",
"Another drawback is in the Tableau demographic presentation; I did not manually go through OpenRefine and clean up any field other than Address for the original step of the project. Therefore, there are several graphical representations that are certainly off by small number. For instance, where certain jobs are spelled differently in the data, they are represented graphically as two different professions, and therefore detract from the overall distribution count. Ultimately, I realized that even without performing this step, the presented data sufficiently represented the Charlotte neighborhoods' demographic information, as exact numbers are not required to show general trends. However, the fact that these are not truly representative of an accurate count is something to keep in mind."
]
},
{
"cell_type": "markdown",
"id": "excellent-decrease",
"metadata": {},
"source": [
"Thinking Forward
\n",
"\n",
"I think that this project could certainly be carried forward, given more time. I already touched on the hopeful ability of a different geocoding tool to retrieve latitude and longitude coordinates for more residents in the Charlotte directory; I think it would also be valuable information to take a look at more areas of Charlotte in greater detail. More data would allow me, for instance, to split up the area inside the beltway into different regions, or to gather more information about residents living outside of the scope of the map area that I chose to focus on, in the fringes of Charlotte. It would also be useful to be able to take these demographic results in conjuction with the analysis of a redlining map, to see if it aligns with historical marginilization of Black communities."
]
},
{
"cell_type": "markdown",
"id": "neutral-genre",
"metadata": {},
"source": [
"Return: [Title](9.VisualizingNeighborhoodDemographics.ipynb)"
]
}
],
"metadata": {
"kernelspec": {
"display_name": "Python 3 (ipykernel)",
"language": "python",
"name": "python3"
},
"language_info": {
"codemirror_mode": {
"name": "ipython",
"version": 3
},
"file_extension": ".py",
"mimetype": "text/x-python",
"name": "python",
"nbconvert_exporter": "python",
"pygments_lexer": "ipython3",
"version": "3.11.5"
}
},
"nbformat": 4,
"nbformat_minor": 5
}