### Thanks and appreciation to
- npm for making their data available to hack on
- [Chromatic](https://www.chromaticqa.com/) for providing component screenshot testing
- [Embed.ly](https://embed.ly/) for bringing npmcharts embeds to Medium and Reddit
- All the open source projects that have linked their READMEs' download-count badges to npmcharts 🙏
### Instructions to set up project locally
1. Fork this repository.
2. Go to your forked copy of this repository. It will be here: `https://github.com//npmcharts.com`.
3. On your PC, open terminal and run: `git clone https://github.com//npmcharts.com.git`. A folder called `npmcharts.com` will be created.
4. Run `cd npmcharts.com` and then `yarn`. This will take some time as `puppeteer` will install chromium (150MB).
5. Now, `cd packages/server` and run `yarn` again.
6. Run `cd ../../` and then `npm start`. You are all set! The project will be running on `port 3896`.
### Testing
To test your code, open your browser and go to: http://localhost:3896/chart-image/vue.png. If everything is fine, you should see a chart(takes a few seconds to load; it is normal).
### Hidden features
A few things that might not be apparent just by looking at the site
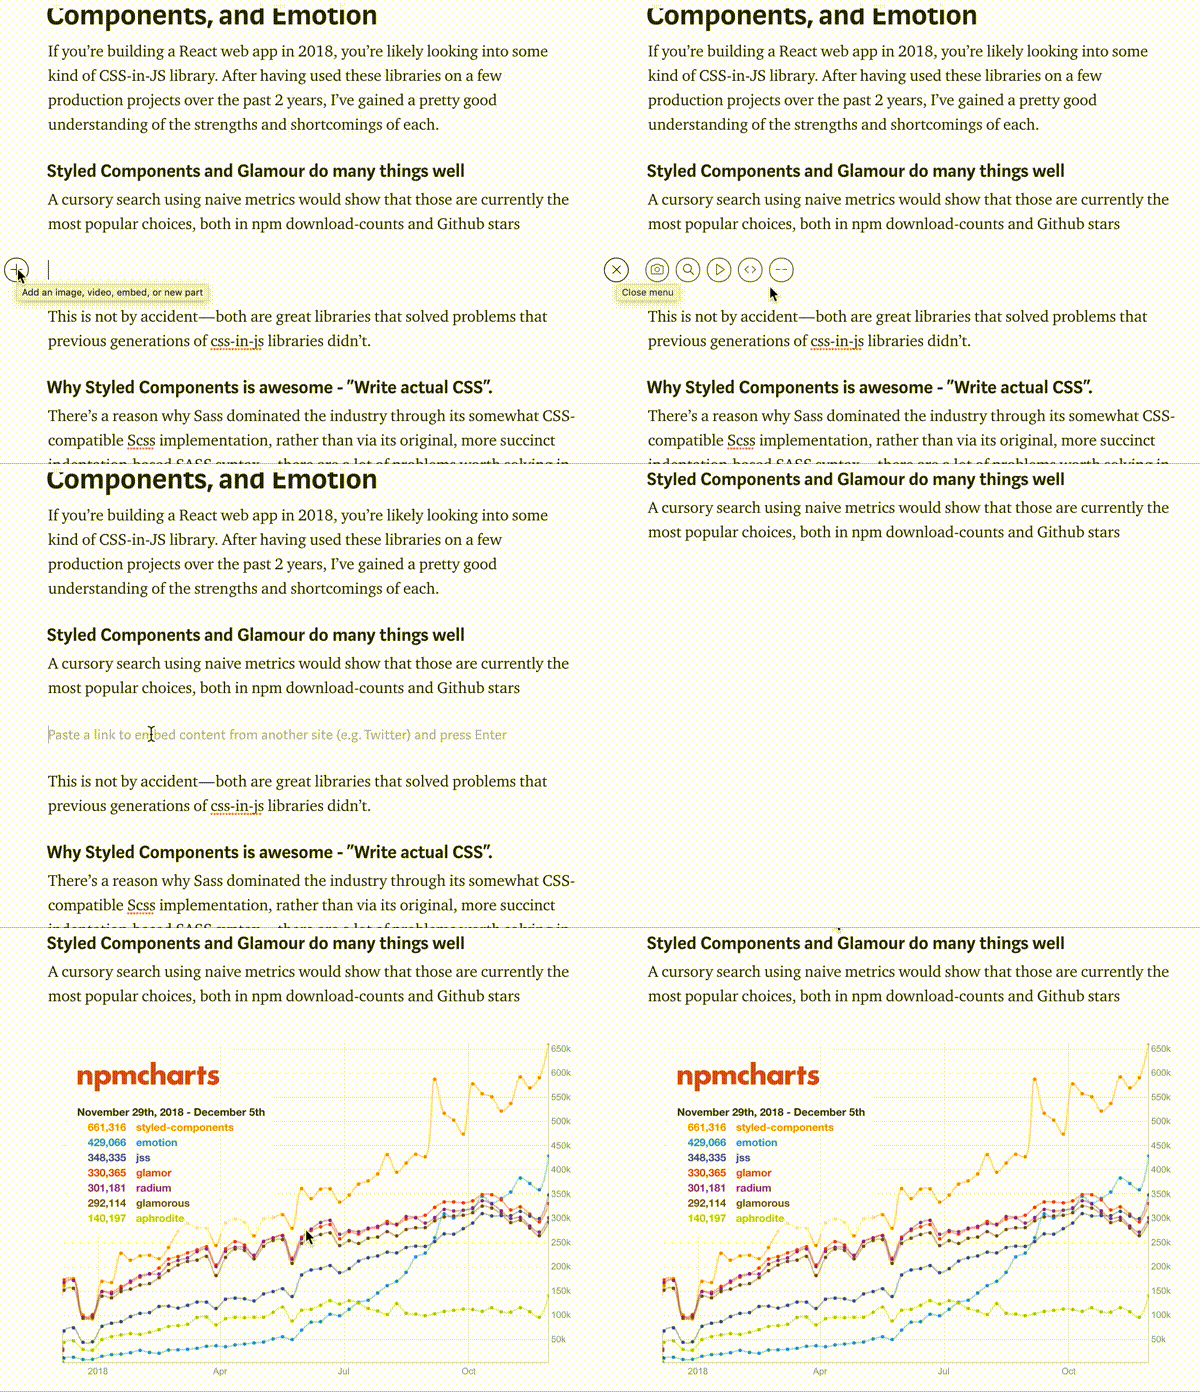
- Charts can be embedded in Medium articles
### Thanks and appreciation to
- npm for making their data available to hack on
- [Chromatic](https://www.chromaticqa.com/) for providing component screenshot testing
- [Embed.ly](https://embed.ly/) for bringing npmcharts embeds to Medium and Reddit
- All the open source projects that have linked their READMEs' download-count badges to npmcharts 🙏
### Instructions to set up project locally
1. Fork this repository.
2. Go to your forked copy of this repository. It will be here: `https://github.com//npmcharts.com`.
3. On your PC, open terminal and run: `git clone https://github.com//npmcharts.com.git`. A folder called `npmcharts.com` will be created.
4. Run `cd npmcharts.com` and then `yarn`. This will take some time as `puppeteer` will install chromium (150MB).
5. Now, `cd packages/server` and run `yarn` again.
6. Run `cd ../../` and then `npm start`. You are all set! The project will be running on `port 3896`.
### Testing
To test your code, open your browser and go to: http://localhost:3896/chart-image/vue.png. If everything is fine, you should see a chart(takes a few seconds to load; it is normal).
### Hidden features
A few things that might not be apparent just by looking at the site
- Charts can be embedded in Medium articles
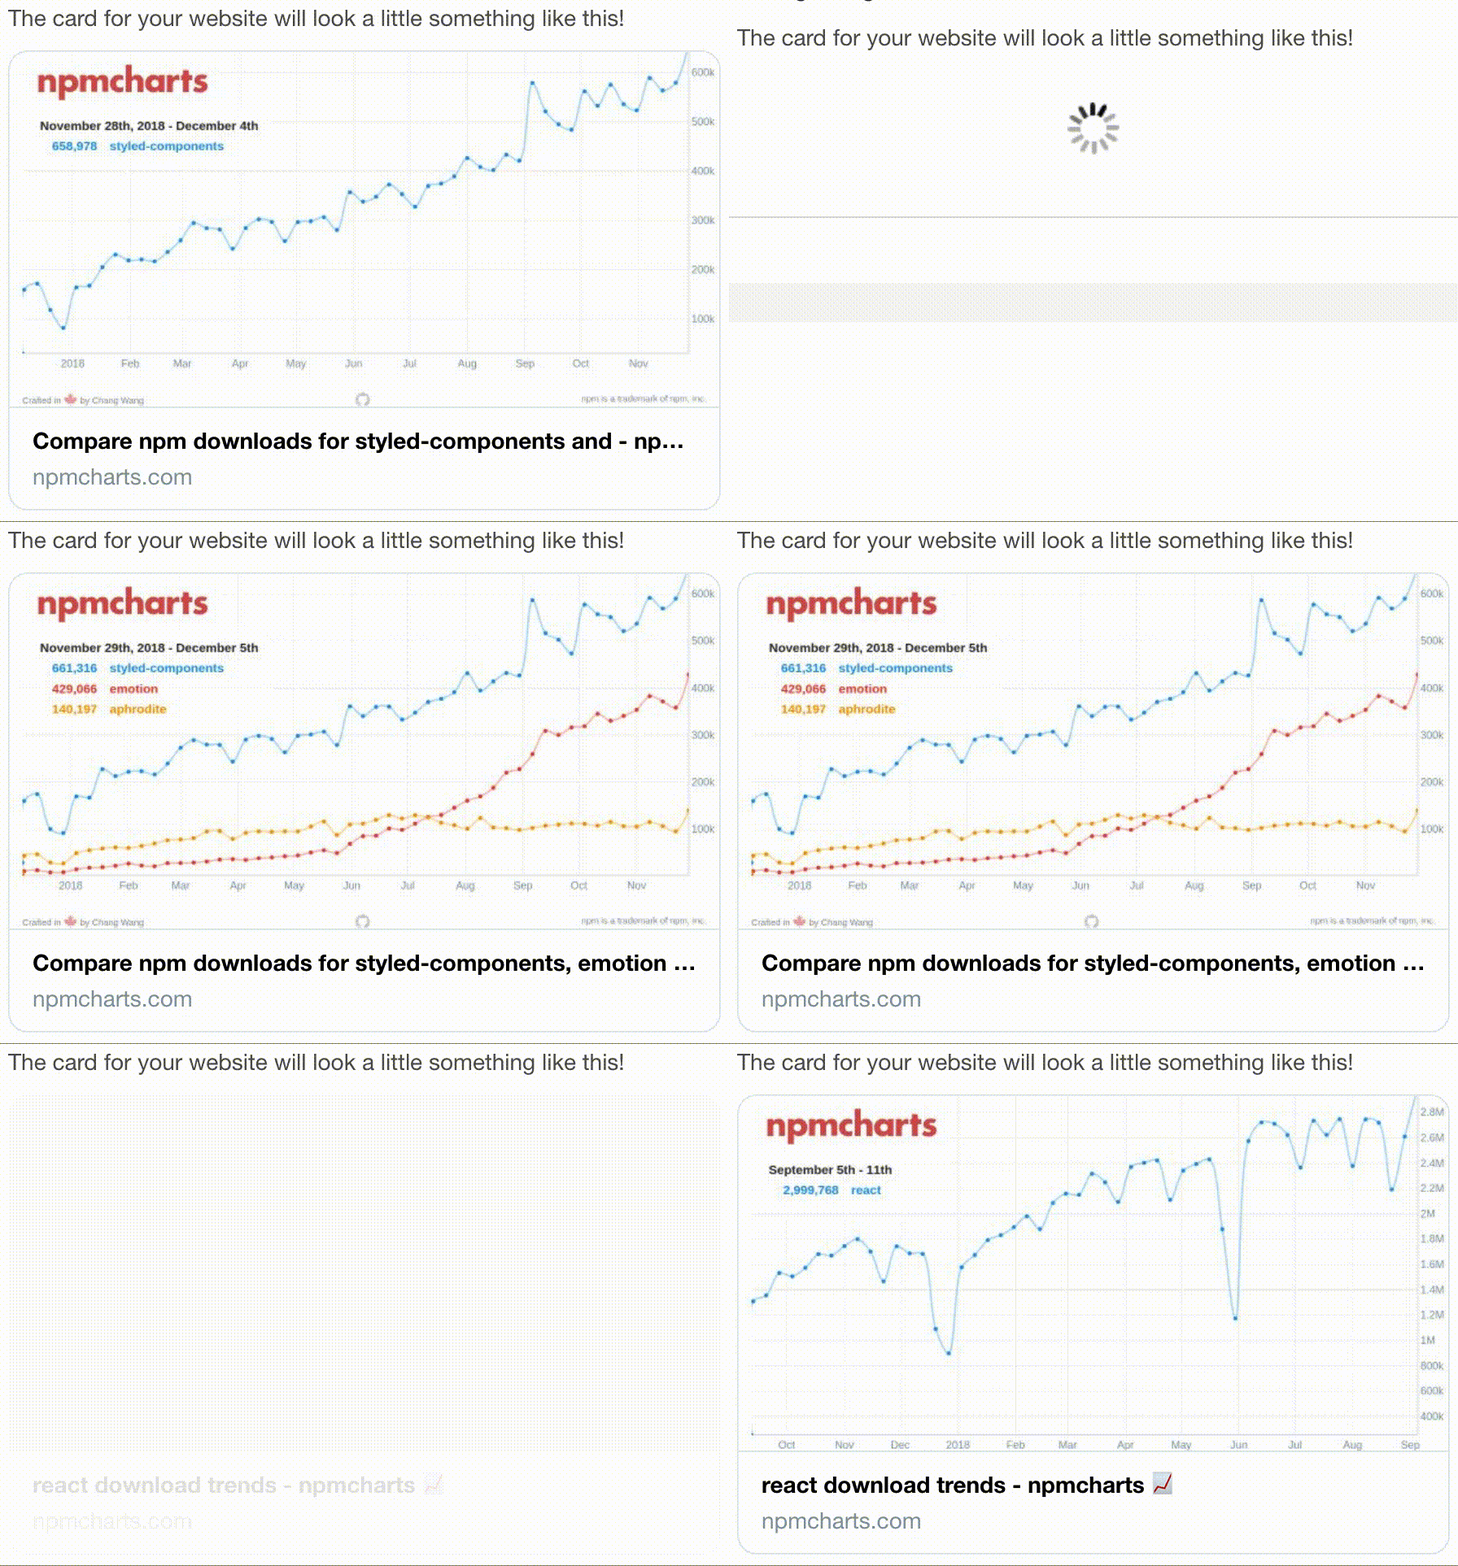
 - Tweets of a chart should contain previews of the actual chart
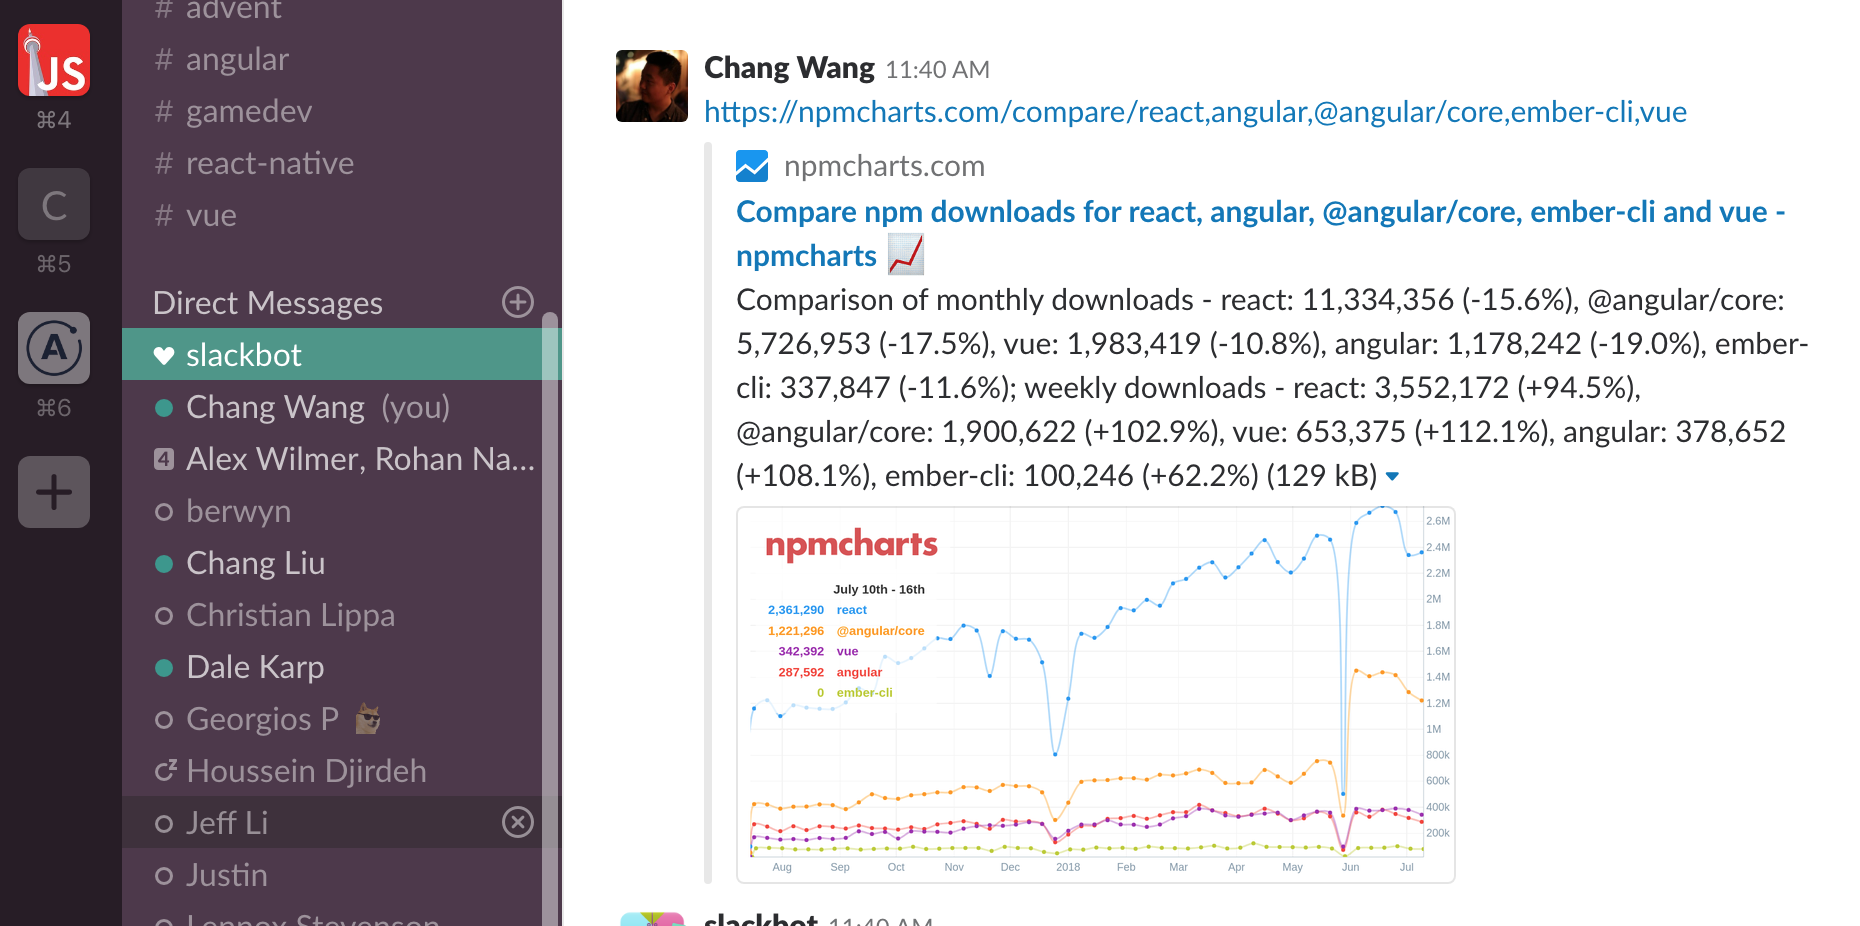
 - Same with slack