# Configuration schemas
For all charts, examples are either directly linked below, or can be found by browising the [example app endpoints](../example_app/endpoints.py) and [configs](../example_app/examples/).
*Sharing data on a single endpoint*
It is also possible to share data on a single endpoint, by effectively "namespacing" each chart. See [example shared data configuration](https://github.com/christabor/flask_jsondash/blob/master/example_app/examples/config/shared-data.json) and the [core config schema](config.md) under `modules:key`.
## Vega
Vega-Lite is a high-level grammar for interactive graphics. It provides a concise JSON syntax for supporting rapid generation of interactive multi-view visualizations. Visit [vegalite](https://vega.github.io/vega-lite/docs) for more.
### Examples
* [Dashboard configuration](../example_app/examples/config/vegalite-fixed.json)
* [Individual dashboard charts data](../example_app/examples/vegalite/)
### Overrides
Supported.
#### Vega-lite
Vega-lite is very robust and thus has it's own specification language. [You can view it here](https://vega.github.io/vega-lite/docs/spec.html).
## C3
C3js is a wrapper around D3js, that provides simple, out-of-the-box charts. Visit [c3js.org](http://c3js.org) for more.
### Examples
* [Dashboard configuration](../example_app/examples/config/fixedlayout-c3.json)
### Overrides
Supported.
#### Line chart
An object with each key corresponding to the line label, and a list of integer values.
```json
{
"line1": [1, 2, 10, 15],
"line2": [2, 30, 40, 55]
}
```
#### Bar chart
An object with each key corresponding to the line label, and a list of its values.
```json
{
"bar1": [1, 2, 30, 12, 100],
"bar2": [2, 4, 12, 50, 80],
}
```
#### Timeseries
An object with each key corresponding to the line label, and a list of its values. A `dates` key must be specified, with a list of dates.
```json
{
"dates": ["2016-08-22", "2016-09-01", "2016-09-11", "2016-09-21"],
"line1": [1, 2, 3, 4],
"line2": [2, 10, 3, 10],
"line3": [2, 10, 20, 40]
}
```
#### Step
An object with each key corresponding to the line label, and a list of integer values.
```json
{
"bar1": [1, 2, 30, 12, 100],
"bar2": [2, 4, 12, 50, 80],
}
```
#### Pie
An object with each key corresponding to the line label, and an an integer value.
```json
{
"data d": 16,
"data e": 77,
"data b": 87,
"data c": 41,
"data a": 15
}
```
#### Area
An object with each key corresponding to the line label, and a list of integer values.
```json
{
"bar1": [1, 2, 30, 12, 100],
"bar2": [2, 4, 12, 50, 80],
}
```
#### Donut
An object with each key corresponding to the line label, and an an integer value.
```json
{
"data d": 16,
"data e": 77,
"data b": 87,
"data c": 41,
"data a": 15
}
```
#### Spline
An object with each key corresponding to the line label, and a list of its values.
```json
{
"bar1": [1, 2, 30, 12, 100],
"bar2": [2, 4, 12, 50, 80],
}
```
#### Gauge
An object with each a single key called `data` and an integer value corresponding to the current gauge value.
```json
{
"data": 40
}
```
#### Scatter
An object with each key corresponding to the line label, and a list of integer values.
```json
{
"bar1": [1, 2, 30, 12, 100],
"bar2": [2, 4, 12, 50, 80],
}
```
#### Area spline
An object with each key corresponding to the line label, and a list of integer values.
```json
{
"bar1": [1, 2, 30, 12, 100],
"bar2": [2, 4, 12, 50, 80],
}
```
## WordCloud
D3-cloud is a 3rd-party module that leverages d3 to create word clouds. Visit [https://github.com/jasondavies/d3-cloud](https://github.com/jasondavies/d3-cloud) for more.
### Examples
* [Dashboard configuration](../example_app/examples/config/kitchensink.json)
### Overrides
Not Supported.
#### Word Cloud
A list of objects with `text` and `size` keys denoting the word and relative size, respectively.
```json
{
"text": "foo", "size": 10,
"text": "bar", "size": 20,
"text": "baz", "size": 100,
}
```
## Plotly
Plotly is an extremely diverse, powerful and now open source charting library that supports a wide range of formats, including webGL and 3d charting/visualization. See [https://plot.ly/](https://plot.ly/) for more.
### Examples
* [Dashboard configuration](../example_app/examples/config/plotly.json)
* [Individual dashboard charts data](../example_app/examples/plotly/)
### Overrides
Supported.
#### Basic
All values are specified using **JSON** configuration specified by the API. See [https://plot.ly/javascript/](https://plot.ly/javascript/) for more.
Usually, the format is at the very least, something like the below json. You can also see more examples that have been tested with jsondash in the [plotly json configs directory](../example_app/examples/plotly). Typically, you can format it exactly as recommended by Plotly API, except converted to JSON format (most javascript can be converted 1:1 using `JSON.stringify` for example).
This means configuration that uses javascript functions are not accepted; these would need to be pre-computed on the server side instead, and then the results dumped to JSON.
```json
{
"data": [],
"layout": {}
}
```
## D3
D3js is a powerful SVG based "dynamic document" drawing library that can create just about any imaginable visualization. As such, only a subset of commonly used types are represented here, with specific schema requirements to fulfill each chart type.
If you are familiar with d3 and want more customization, you'll need to use the **basic -> iframe** or **basic -> embed** option instead in order to write your own javascript.
Visit [d3js.org](http://d3js.org) for more.
### Examples
* [Dashboard configuration](../example_app/examples/config/fixedlayout-d3.json)
#### Dendrogram
A recursive json config that uses `name`, `size`, and `children` as its main keys of arbitrary depth. Additional keys can be added as needed. The `size` key is required to determine sizing of each element (relative to the set, not pixel values).
```json
{
"name": "chartname",
"children": [
{
"name": "childelements",
"size": 10,
"children": []
}
]
}
```
#### Radial Dendrogram
A recursive json config that uses `name`, `size`, and `children` as its main keys of arbitrary depth. Additional keys can be added as needed. The `size` key is required to determine sizing of each element (relative to the set, not pixel values).
```json
{
"name": "chartname",
"children": [
{
"name": "childelements",
"size": 10,
"children": []
}
]
}
```
#### Treemap
A recursive json config that uses `name`, `size`, and `children` as its main keys of arbitrary depth. Additional keys can be added as needed. The `size` key is required to determine sizing of each element (relative to the set, not pixel values).
```json
{
"name": "chartname",
"children": [
{
"name": "childelements",
"size": 10,
"children": []
}
]
}
```
#### Voronoi
An array of arrays, where each array element contains 2 items: the x, y coordinates for a given point.
```json
[
[2, 10], [100, 30], [300, 10], [320, 101]
]
```
#### Circlepack
A recursive json config that uses `name`, `size`, and `children` as its main keys of arbitrary depth. Additional keys can be added as needed. The `size` key is required to determine sizing of each element (relative to the set, not pixel values).
```json
{
"name": "chartname",
"children": [
{
"name": "childelements",
"size": 10,
"children": []
}
]
}
```
## Basic
One-off, simple, ad-hoc displays.
### Overrides
Not supported (not relevant).
#### Custom
No schema; you can serve whatever kind of page you want. Similar to an iframe, except this will load the source directly into the page. **Note**: some unintended side effects of your dashboard may occur (such as css style overrides), so YMMV. Alternatively, you can use the iframe option.
#### Iframe
No schema; you can load whatever page you want. This will not affect the dashboard, unlike the *custom* option, but you will have limited access to the contents of the iframe (typically not a concern.)
#### Image
No schema; Just drop in an image url.
##### Examples
* [Dashboard configuration](../example_app/examples/config/images.json)
#### Number (singlenum)
Any number, positive or negative. Prefixes, such as currencies, are also allowed (there is no real limit to the string, but it is typically shown as a number, and styled accordingly).
```json
{"data": "$12,300"}
```
```json
{"data": "-12,300"}
```
```json
{"data": 2302}
```
You can also override the color and/or disable negative/positive formatting like so:
```json
{"data": 12, "color": "purple", "noformat": "true"}
```
Disabling `noformat` is important if you are not using a numerical value, as it might incorrectly guess color and/or formatting when it doesn't make sense.
#### Number Group
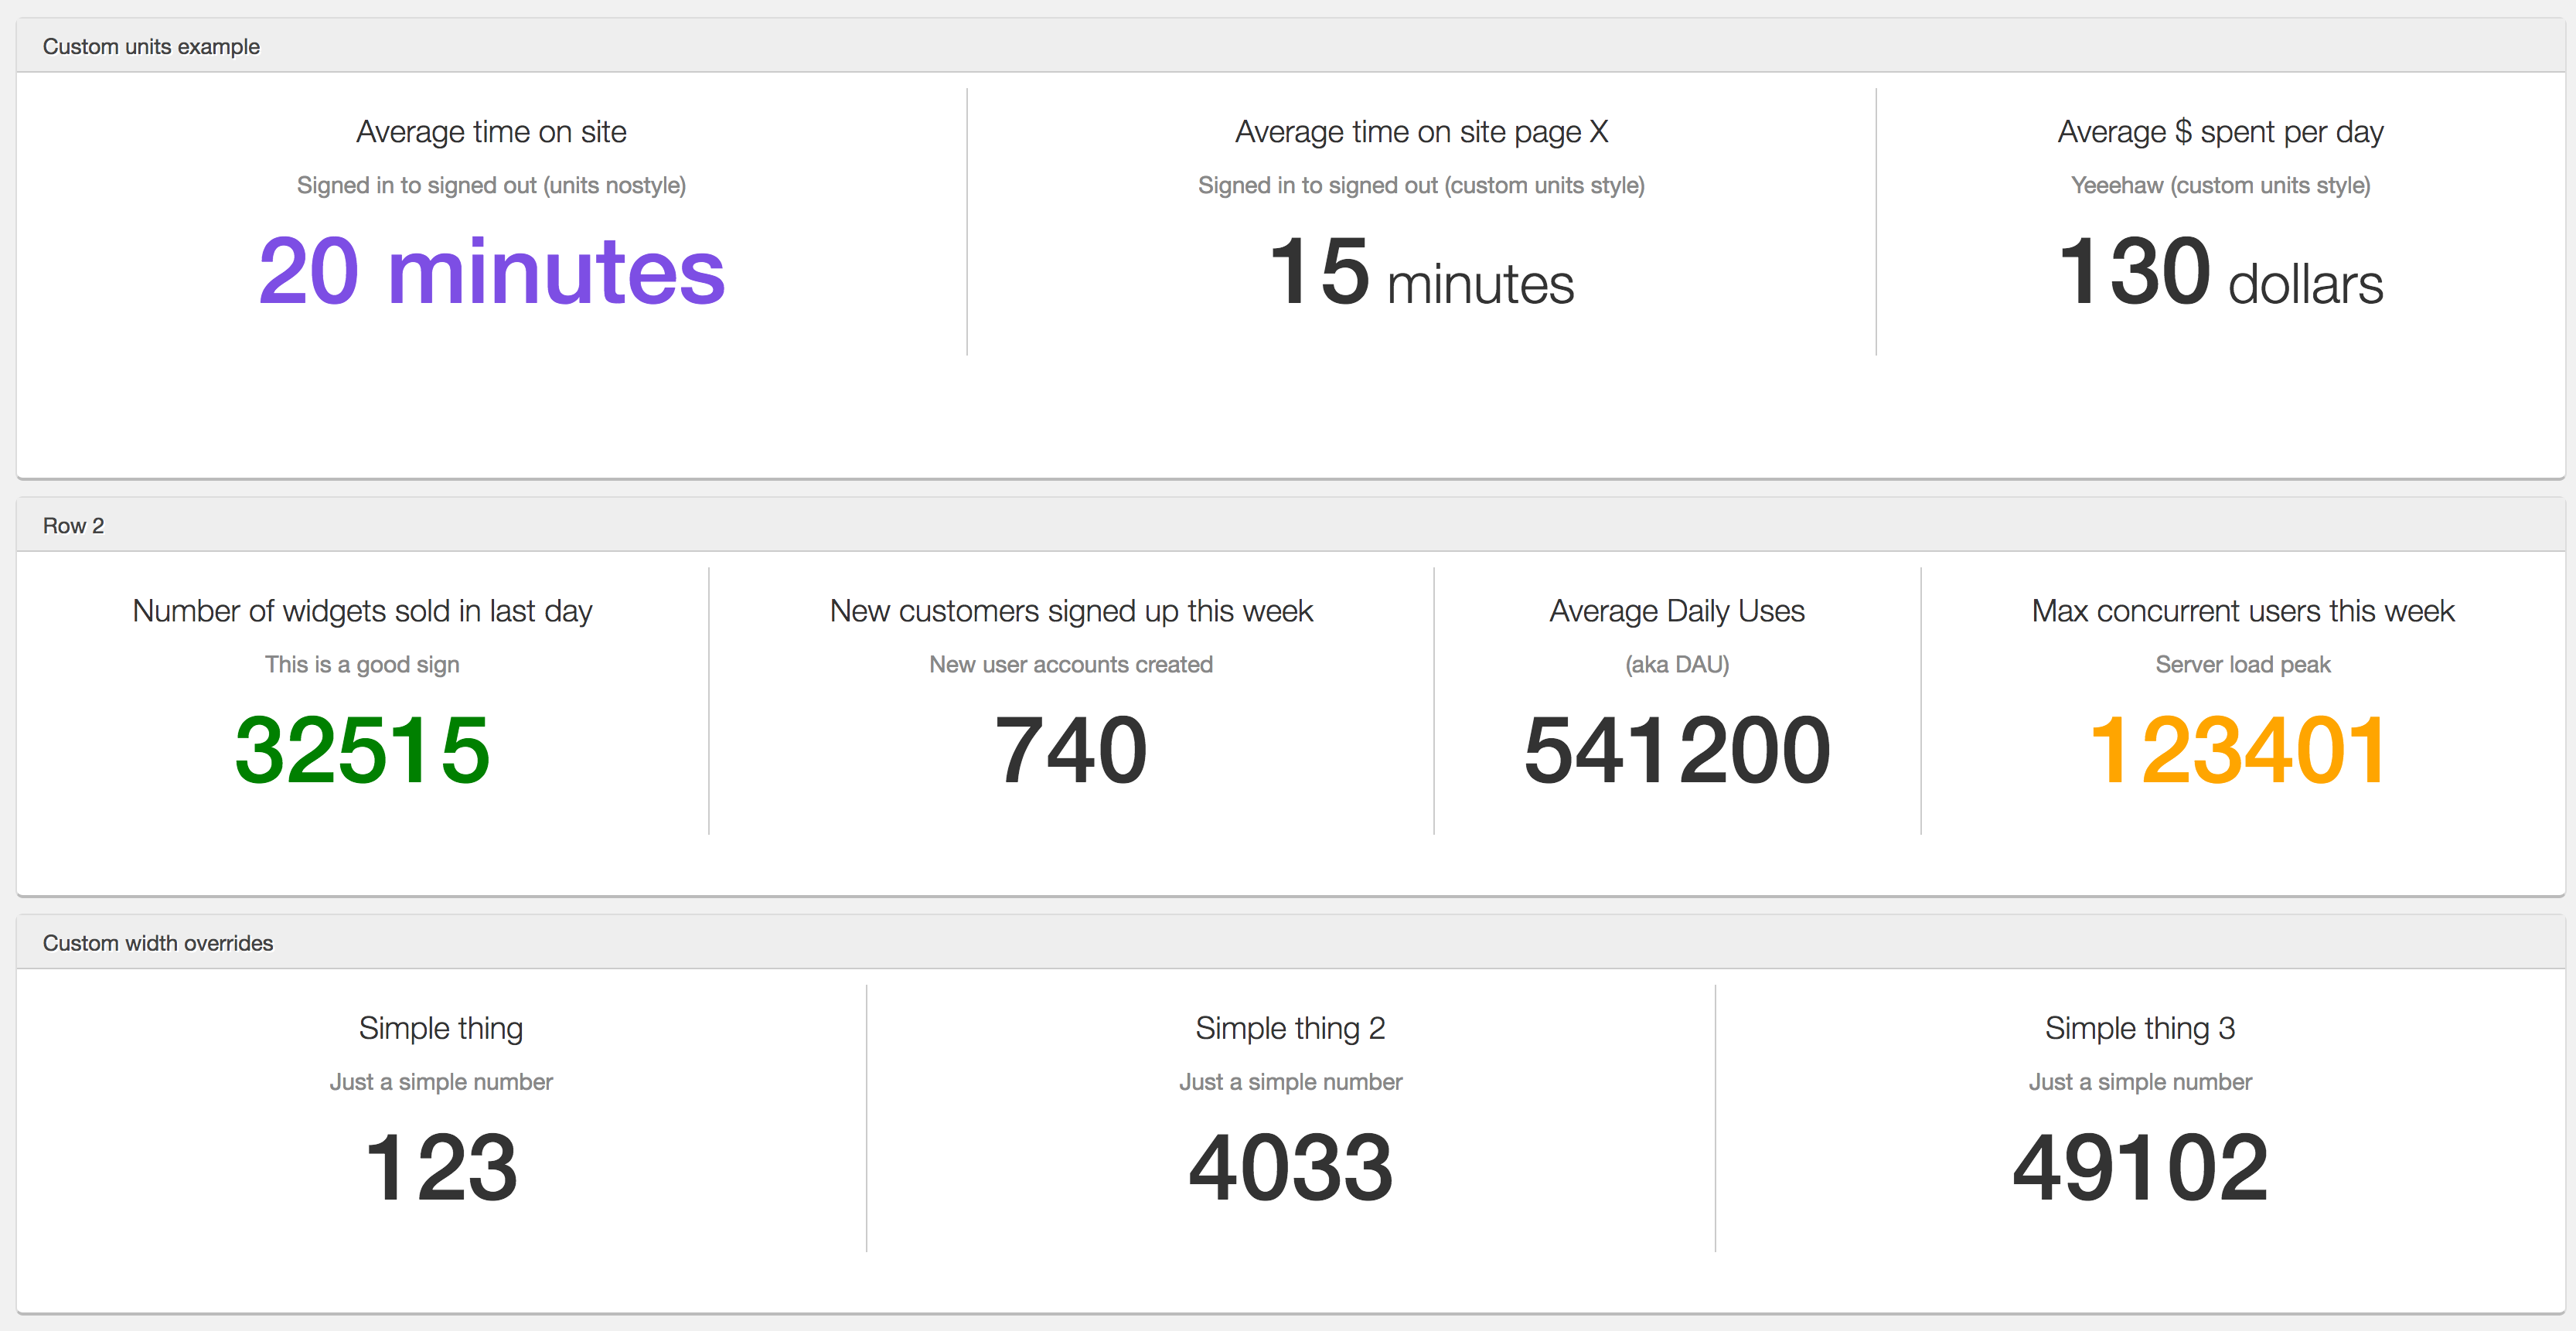
Just like the single number option above, a number group has the same options (`color` and `noformat`), and general format, but supports multiple columns for each number (so you can build multiple big display of aggregate values in a single chart):
```json
[
{
"title": "Number of widgets sold in last day",
"description": "This is a good sign",
"data": 32515.0,
"color": "green",
},
{
"title": "New customers signed up this week",
"description": "New user accounts created",
"data": 740,
},
{
"title": "Average Daily Users",
"description": "(aka DAU)",
"data": 541200,
},
{
"title": "Max concurrent users this week",
"description": "Server load peak",
"data": 123401,
"color": "orange",
"noformat": true,
},
]
```
You can also override the column width for each item, via `"width": "30%"`.
**units**
While you can just add optional units within the `data` field value, If you want to specify units separately for nicer styling, you can use the `"units": "..."` field and it will be styled nicely for you (see below).
##### Examples
* [Dashboard configuration](../example_app/examples/config/numbergroups.json)
##### Screenshots
#### YouTube
Takes the html embed code from youtube. For example:
```html
```
This will be serialized for JSON and deserialized when rendering.
## Graph
A graph is an abstract structure that uses nodes and edges to represent relationships. The actual implementation here utilizes the graphviz digraph (directed graph) DOT specification.
### Examples
* [Dashboard configuration](../example_app/examples/config/digraph.json)
The graph/digraph format is like the following simple example:
```
digraph {
a -> b;
b -> a;
a -> c;
b -> c;
c -> c;
}
```
Which must be encoded as json like so:
```json
{
"graph": "..."
}
```
Where `...` is the digraph string. You can find the [dot specificiation here](http://www.graphviz.org/content/dot-language) and the actual [javascript implementation here](https://github.com/cpettitt/graphlib/wiki/API-Reference).
### Overrides
Not supported/relevant.
## Cytoscape
Cytoscape is a graph theory / network library for analysis and visualisation. Visit [cytoscape website](http://js.cytoscape.org/) for more.
### Examples
* [Dashboard configuration](../example_app/examples/config/cytoscape.json)
* [Individual dashboard charts data](../example_app/examples/cytoscape/)
### Overrides
Supported.
#### Cytoscape (core layouts)
Cytoscape supports third-party layout extensions to the core library, but only the core layouts are available in jsondash. See some examples in the [example configurations directory](../example_app/examples/cytoscape).
**other notes**
In all configurations, there is no need to specify a DOM selector, since this will be populated during initialization. Also, this does not serialize, so it would never be included in the payload anyway.
## SigmaJS
Sigma is a JavaScript library dedicated to graph drawing. It makes easy to publish networks on Web pages, and allows developers to integrate network exploration in rich Web applications. Visit [sigmajs website](http://sigmajs.org/) for more.
### Examples
* [Dashboard configuration](../example_app/examples/config/sigma.json)
* [Individual dashboard charts data](../example_app/examples/sigma/)
### Overrides
Supported.
#### Sigma
Supports all sigma graphs that are renderable via **json**, and do not need custom javascript to add nodes, interactivity or styles. This means you must pass in your json data to the endpoints' `dataSource` field. SigmaJS supports Gephi format via a separate extension, but you will need to convert this to json before returning it to your endpoint, as the Gephi plugin is not integrated here.
**other notes**
In all configurations, there is no need to specify a DOM selector, since this will be populated during initialization. Also, this does not serialize, so it would never be included in the payload anyway.
## Datatables
### Overrides
Supported.
#### Datatables standard
A table with automatic styling, sorting, filtering and pagination. Format is a list of objects, where values can be any key and value, but all elements in the list **must** have matching key names. Also take note of the outside brackets. All objects must be wrapped in `[]`.
```json
[
{
"name": "foo",
"age": 30
},
{
"name": "bar",
"age": 20
}
]
```
## Timeline
An interactive timeline creator.
### Overrides
Not supported.
#### Timeline standard
A timeline using timeline.js. Format requirements are [available here](https://github.com/christabor/flask_jsondash/blob/master/examples/timeline3.json).
## VennJS
VennJS is a wrapper for d3js that provides an easy to use api for Venn and Euler diagrams. Visit [https://github.com/benfred/venn.js](https://github.com/benfred/venn.js) for more.
### Overrides
Not supported.
#### VennJS standard
A list of objects with keys `sets`, and `size`, where `set` is a list of set names, and `size` is relative size of the circle.
```json
[
{"sets": ["A"], "size": 12},
{"sets": ["B"], "size": 12},
{"sets": ["A", "B"], "size": 2},
]
```
## FlameGraph
From Brendan Gregg, originator of flame graph software: "Flame graphs are a visualization of profiled software, allowing the most frequent code-paths to be identified quickly and accurately."
### Overrides
Supported.
Format should be similar to d3 hierarchical layouts, like:
```json
{
"children": [
{
"name": "...",
"value": 10
},
{
"name": "...",
"value": 30,
"children": [...]
}
]
}
```
### Examples
* [Dashboard configuration](../example_app/examples/config/flamegraph.json)
* [Individual dashboard charts data](../example_app/examples/flamegraph/)
## Sparklines
Sparklines are "mini" charts that can be used inline. They most often make sense as complementing a larger context, for example, a paragraph of text. See [http://omnipotent.net/jquery.sparkline/](http://omnipotent.net/jquery.sparkline/) for more.
### Overrides
Not supported.
#### Sparklines line chart
An array of arrays, where each element contains two integers, representing x/y positions.
```json
[
[1, 2], [2, 10], [10, 30]
]
```
#### Sparklines bar chart
An array of arrays, where each element contains two integers, representing x/y positions.
```json
[
[1, 2], [2, 10], [10, 30]
]
```
#### Sparklines tristate chart
...
#### Sparklines discrete chart
An array of integers representing up and down positions.
```json
[
[20, 40, 30, 10]
]
```
#### Sparklines bullet chart
...
#### Sparklines pie chart
An array of integers, representing percentages.
```json
[
[20, 40, 30, 10]
]
```
#### Sparklines box chart
...
 #### YouTube
Takes the html embed code from youtube. For example:
```html
```
This will be serialized for JSON and deserialized when rendering.
## Graph
A graph is an abstract structure that uses nodes and edges to represent relationships. The actual implementation here utilizes the graphviz digraph (directed graph) DOT specification.
### Examples
* [Dashboard configuration](../example_app/examples/config/digraph.json)
The graph/digraph format is like the following simple example:
```
digraph {
a -> b;
b -> a;
a -> c;
b -> c;
c -> c;
}
```
Which must be encoded as json like so:
```json
{
"graph": "..."
}
```
Where `...` is the digraph string. You can find the [dot specificiation here](http://www.graphviz.org/content/dot-language) and the actual [javascript implementation here](https://github.com/cpettitt/graphlib/wiki/API-Reference).
### Overrides
Not supported/relevant.
## Cytoscape
Cytoscape is a graph theory / network library for analysis and visualisation. Visit [cytoscape website](http://js.cytoscape.org/) for more.
### Examples
* [Dashboard configuration](../example_app/examples/config/cytoscape.json)
* [Individual dashboard charts data](../example_app/examples/cytoscape/)
### Overrides
Supported.
#### Cytoscape (core layouts)
Cytoscape supports third-party layout extensions to the core library, but only the core layouts are available in jsondash. See some examples in the [example configurations directory](../example_app/examples/cytoscape).
**other notes**
In all configurations, there is no need to specify a DOM selector, since this will be populated during initialization. Also, this does not serialize, so it would never be included in the payload anyway.
## SigmaJS
Sigma is a JavaScript library dedicated to graph drawing. It makes easy to publish networks on Web pages, and allows developers to integrate network exploration in rich Web applications. Visit [sigmajs website](http://sigmajs.org/) for more.
### Examples
* [Dashboard configuration](../example_app/examples/config/sigma.json)
* [Individual dashboard charts data](../example_app/examples/sigma/)
### Overrides
Supported.
#### Sigma
Supports all sigma graphs that are renderable via **json**, and do not need custom javascript to add nodes, interactivity or styles. This means you must pass in your json data to the endpoints' `dataSource` field. SigmaJS supports Gephi format via a separate extension, but you will need to convert this to json before returning it to your endpoint, as the Gephi plugin is not integrated here.
**other notes**
In all configurations, there is no need to specify a DOM selector, since this will be populated during initialization. Also, this does not serialize, so it would never be included in the payload anyway.
## Datatables
### Overrides
Supported.
#### Datatables standard
A table with automatic styling, sorting, filtering and pagination. Format is a list of objects, where values can be any key and value, but all elements in the list **must** have matching key names. Also take note of the outside brackets. All objects must be wrapped in `[]`.
```json
[
{
"name": "foo",
"age": 30
},
{
"name": "bar",
"age": 20
}
]
```
## Timeline
An interactive timeline creator.
### Overrides
Not supported.
#### Timeline standard
A timeline using timeline.js. Format requirements are [available here](https://github.com/christabor/flask_jsondash/blob/master/examples/timeline3.json).
## VennJS
VennJS is a wrapper for d3js that provides an easy to use api for Venn and Euler diagrams. Visit [https://github.com/benfred/venn.js](https://github.com/benfred/venn.js) for more.
### Overrides
Not supported.
#### VennJS standard
A list of objects with keys `sets`, and `size`, where `set` is a list of set names, and `size` is relative size of the circle.
```json
[
{"sets": ["A"], "size": 12},
{"sets": ["B"], "size": 12},
{"sets": ["A", "B"], "size": 2},
]
```
## FlameGraph
From Brendan Gregg, originator of flame graph software: "Flame graphs are a visualization of profiled software, allowing the most frequent code-paths to be identified quickly and accurately."
### Overrides
Supported.
Format should be similar to d3 hierarchical layouts, like:
```json
{
"children": [
{
"name": "...",
"value": 10
},
{
"name": "...",
"value": 30,
"children": [...]
}
]
}
```
### Examples
* [Dashboard configuration](../example_app/examples/config/flamegraph.json)
* [Individual dashboard charts data](../example_app/examples/flamegraph/)
## Sparklines
Sparklines are "mini" charts that can be used inline. They most often make sense as complementing a larger context, for example, a paragraph of text. See [http://omnipotent.net/jquery.sparkline/](http://omnipotent.net/jquery.sparkline/) for more.
### Overrides
Not supported.
#### Sparklines line chart
An array of arrays, where each element contains two integers, representing x/y positions.
```json
[
[1, 2], [2, 10], [10, 30]
]
```
#### Sparklines bar chart
An array of arrays, where each element contains two integers, representing x/y positions.
```json
[
[1, 2], [2, 10], [10, 30]
]
```
#### Sparklines tristate chart
...
#### Sparklines discrete chart
An array of integers representing up and down positions.
```json
[
[20, 40, 30, 10]
]
```
#### Sparklines bullet chart
...
#### Sparklines pie chart
An array of integers, representing percentages.
```json
[
[20, 40, 30, 10]
]
```
#### Sparklines box chart
...
#### YouTube
Takes the html embed code from youtube. For example:
```html
```
This will be serialized for JSON and deserialized when rendering.
## Graph
A graph is an abstract structure that uses nodes and edges to represent relationships. The actual implementation here utilizes the graphviz digraph (directed graph) DOT specification.
### Examples
* [Dashboard configuration](../example_app/examples/config/digraph.json)
The graph/digraph format is like the following simple example:
```
digraph {
a -> b;
b -> a;
a -> c;
b -> c;
c -> c;
}
```
Which must be encoded as json like so:
```json
{
"graph": "..."
}
```
Where `...` is the digraph string. You can find the [dot specificiation here](http://www.graphviz.org/content/dot-language) and the actual [javascript implementation here](https://github.com/cpettitt/graphlib/wiki/API-Reference).
### Overrides
Not supported/relevant.
## Cytoscape
Cytoscape is a graph theory / network library for analysis and visualisation. Visit [cytoscape website](http://js.cytoscape.org/) for more.
### Examples
* [Dashboard configuration](../example_app/examples/config/cytoscape.json)
* [Individual dashboard charts data](../example_app/examples/cytoscape/)
### Overrides
Supported.
#### Cytoscape (core layouts)
Cytoscape supports third-party layout extensions to the core library, but only the core layouts are available in jsondash. See some examples in the [example configurations directory](../example_app/examples/cytoscape).
**other notes**
In all configurations, there is no need to specify a DOM selector, since this will be populated during initialization. Also, this does not serialize, so it would never be included in the payload anyway.
## SigmaJS
Sigma is a JavaScript library dedicated to graph drawing. It makes easy to publish networks on Web pages, and allows developers to integrate network exploration in rich Web applications. Visit [sigmajs website](http://sigmajs.org/) for more.
### Examples
* [Dashboard configuration](../example_app/examples/config/sigma.json)
* [Individual dashboard charts data](../example_app/examples/sigma/)
### Overrides
Supported.
#### Sigma
Supports all sigma graphs that are renderable via **json**, and do not need custom javascript to add nodes, interactivity or styles. This means you must pass in your json data to the endpoints' `dataSource` field. SigmaJS supports Gephi format via a separate extension, but you will need to convert this to json before returning it to your endpoint, as the Gephi plugin is not integrated here.
**other notes**
In all configurations, there is no need to specify a DOM selector, since this will be populated during initialization. Also, this does not serialize, so it would never be included in the payload anyway.
## Datatables
### Overrides
Supported.
#### Datatables standard
A table with automatic styling, sorting, filtering and pagination. Format is a list of objects, where values can be any key and value, but all elements in the list **must** have matching key names. Also take note of the outside brackets. All objects must be wrapped in `[]`.
```json
[
{
"name": "foo",
"age": 30
},
{
"name": "bar",
"age": 20
}
]
```
## Timeline
An interactive timeline creator.
### Overrides
Not supported.
#### Timeline standard
A timeline using timeline.js. Format requirements are [available here](https://github.com/christabor/flask_jsondash/blob/master/examples/timeline3.json).
## VennJS
VennJS is a wrapper for d3js that provides an easy to use api for Venn and Euler diagrams. Visit [https://github.com/benfred/venn.js](https://github.com/benfred/venn.js) for more.
### Overrides
Not supported.
#### VennJS standard
A list of objects with keys `sets`, and `size`, where `set` is a list of set names, and `size` is relative size of the circle.
```json
[
{"sets": ["A"], "size": 12},
{"sets": ["B"], "size": 12},
{"sets": ["A", "B"], "size": 2},
]
```
## FlameGraph
From Brendan Gregg, originator of flame graph software: "Flame graphs are a visualization of profiled software, allowing the most frequent code-paths to be identified quickly and accurately."
### Overrides
Supported.
Format should be similar to d3 hierarchical layouts, like:
```json
{
"children": [
{
"name": "...",
"value": 10
},
{
"name": "...",
"value": 30,
"children": [...]
}
]
}
```
### Examples
* [Dashboard configuration](../example_app/examples/config/flamegraph.json)
* [Individual dashboard charts data](../example_app/examples/flamegraph/)
## Sparklines
Sparklines are "mini" charts that can be used inline. They most often make sense as complementing a larger context, for example, a paragraph of text. See [http://omnipotent.net/jquery.sparkline/](http://omnipotent.net/jquery.sparkline/) for more.
### Overrides
Not supported.
#### Sparklines line chart
An array of arrays, where each element contains two integers, representing x/y positions.
```json
[
[1, 2], [2, 10], [10, 30]
]
```
#### Sparklines bar chart
An array of arrays, where each element contains two integers, representing x/y positions.
```json
[
[1, 2], [2, 10], [10, 30]
]
```
#### Sparklines tristate chart
...
#### Sparklines discrete chart
An array of integers representing up and down positions.
```json
[
[20, 40, 30, 10]
]
```
#### Sparklines bullet chart
...
#### Sparklines pie chart
An array of integers, representing percentages.
```json
[
[20, 40, 30, 10]
]
```
#### Sparklines box chart
...