Practice transforming and visualizing factors
library(tidyverse)
library(knitr)
library(rcfss)
theme_set(theme_minimal())

# load the data
data("gun_deaths")
gun_deaths
## # A tibble: 100,798 x 10
## id year month intent police sex age race place education
## <int> <int> <dbl> <chr> <int> <chr> <int> <chr> <chr> <fct>
## 1 1 2012 1. Suicide 0 M 34 Asia… Home BA+
## 2 2 2012 1. Suicide 0 F 21 White Stre… Some col…
## 3 3 2012 1. Suicide 0 M 60 White Othe… BA+
## 4 4 2012 2. Suicide 0 M 64 White Home BA+
## 5 5 2012 2. Suicide 0 M 31 White Othe… HS/GED
## 6 6 2012 2. Suicide 0 M 17 Nati… Home Less tha…
## 7 7 2012 2. Undetermined 0 M 48 White Home HS/GED
## 8 8 2012 3. Suicide 0 M 41 Nati… Home HS/GED
## 9 9 2012 2. Accidental 0 M 50 White Othe… Some col…
## 10 10 2012 2. Suicide 0 M NA Black Home <NA>
## # ... with 100,788 more rowsConvert month into a factor column
Click for the solution
month_levels <- c(
  "Jan", "Feb", "Mar", "Apr", "May", "Jun",
  "Jul", "Aug", "Sep", "Oct", "Nov", "Dec"
)

# or use the built-in constant
month.abb
## [1] "Jan" "Feb" "Mar" "Apr" "May" "Jun" "Jul" "Aug" "Sep" "Oct" "Nov"
## [12] "Dec"(gun_deaths <- gun_deaths %>%
mutate(month = factor(month, levels = 1:12, labels = month_levels)))## # A tibble: 100,798 x 10
## id year month intent police sex age
## <int> <int> <fctr> <chr> <int> <chr> <int>
## 1 1 2012 Jan Suicide 0 M 34
## 2 2 2012 Jan Suicide 0 F 21
## 3 3 2012 Jan Suicide 0 M 60
## 4 4 2012 Feb Suicide 0 M 64
## 5 5 2012 Feb Suicide 0 M 31
## 6 6 2012 Feb Suicide 0 M 17
## 7 7 2012 Feb Undetermined 0 M 48
## 8 8 2012 Mar Suicide 0 M 41
## 9 9 2012 Feb Accidental 0 M 50
## 10 10 2012 Feb Suicide 0 M NA
## # ... with 100,788 more rows, and 3 more variables: race <chr>,
## # place <chr>, education <fctr>Visualize the total gun deaths per month, in chronological order
Click for the solution
ggplot(gun_deaths, aes(month)) +
  geom_bar() +
  labs(title = "Gun Deaths in the United States (2012-2014)",
       x = "Month",
       y = "Number of gun deaths")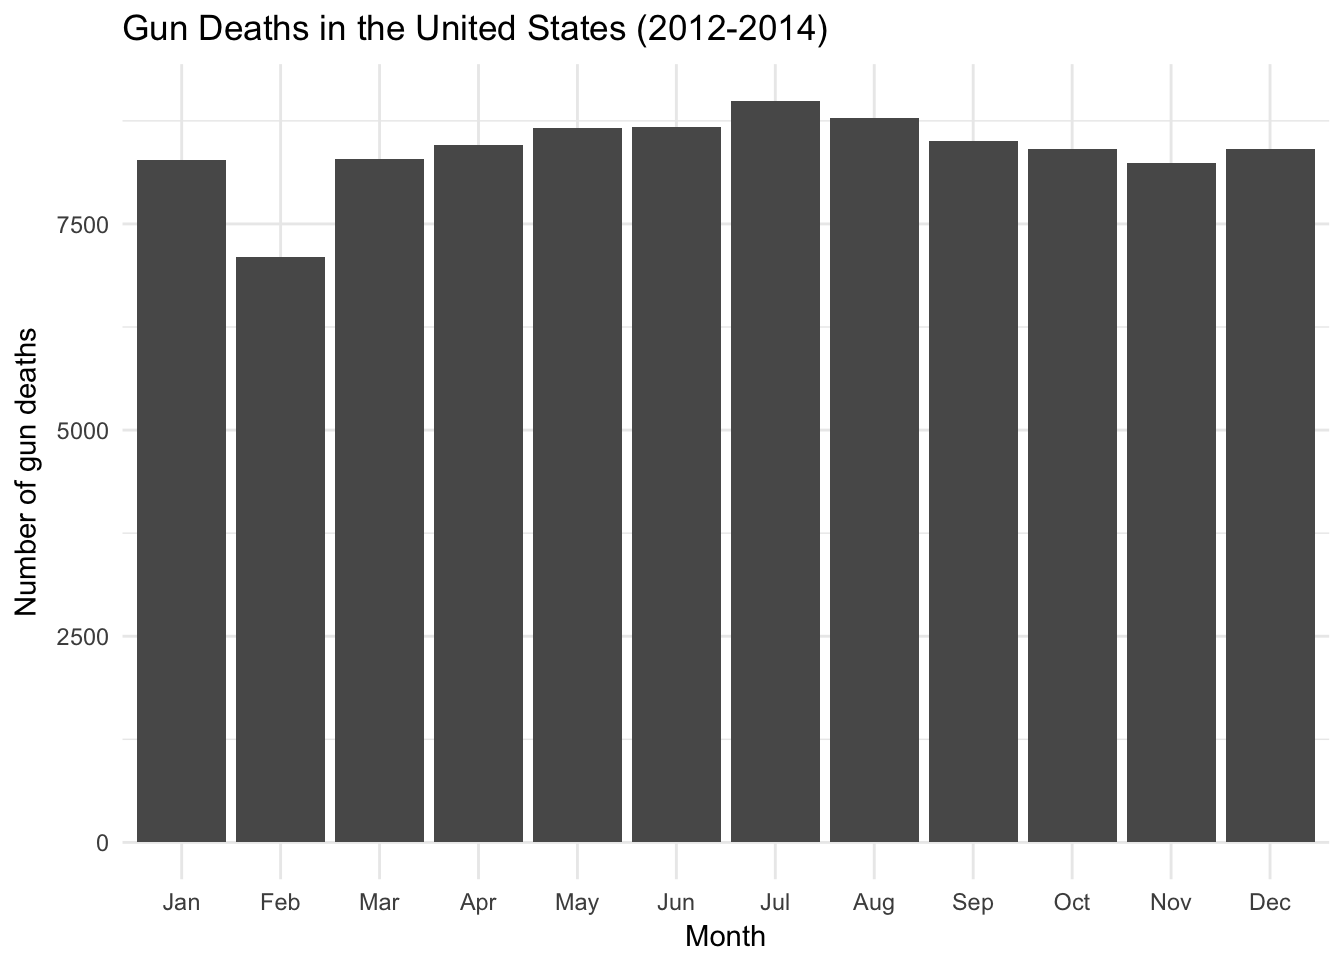
Visualize the total gun deaths per month, sorted from lowest to highest
Click for the solution
# with geom_col() and fct_reorder()
gun_deaths %>%
  count(month) %>%
  ggplot(aes(fct_reorder(month, n), n)) +
  geom_col() +
  labs(title = "Gun Deaths in the United States (2012-2014)",
       x = "Month",
       y = "Number of gun deaths")
# with geom_bar() and fct_infreq()
ggplot(gun_deaths, aes(month %>%
                         fct_infreq() %>%
                         fct_rev())) +
  geom_bar() +
  labs(title = "Gun Deaths in the United States (2012-2014)",
       x = "Month",
       y = "Number of gun deaths")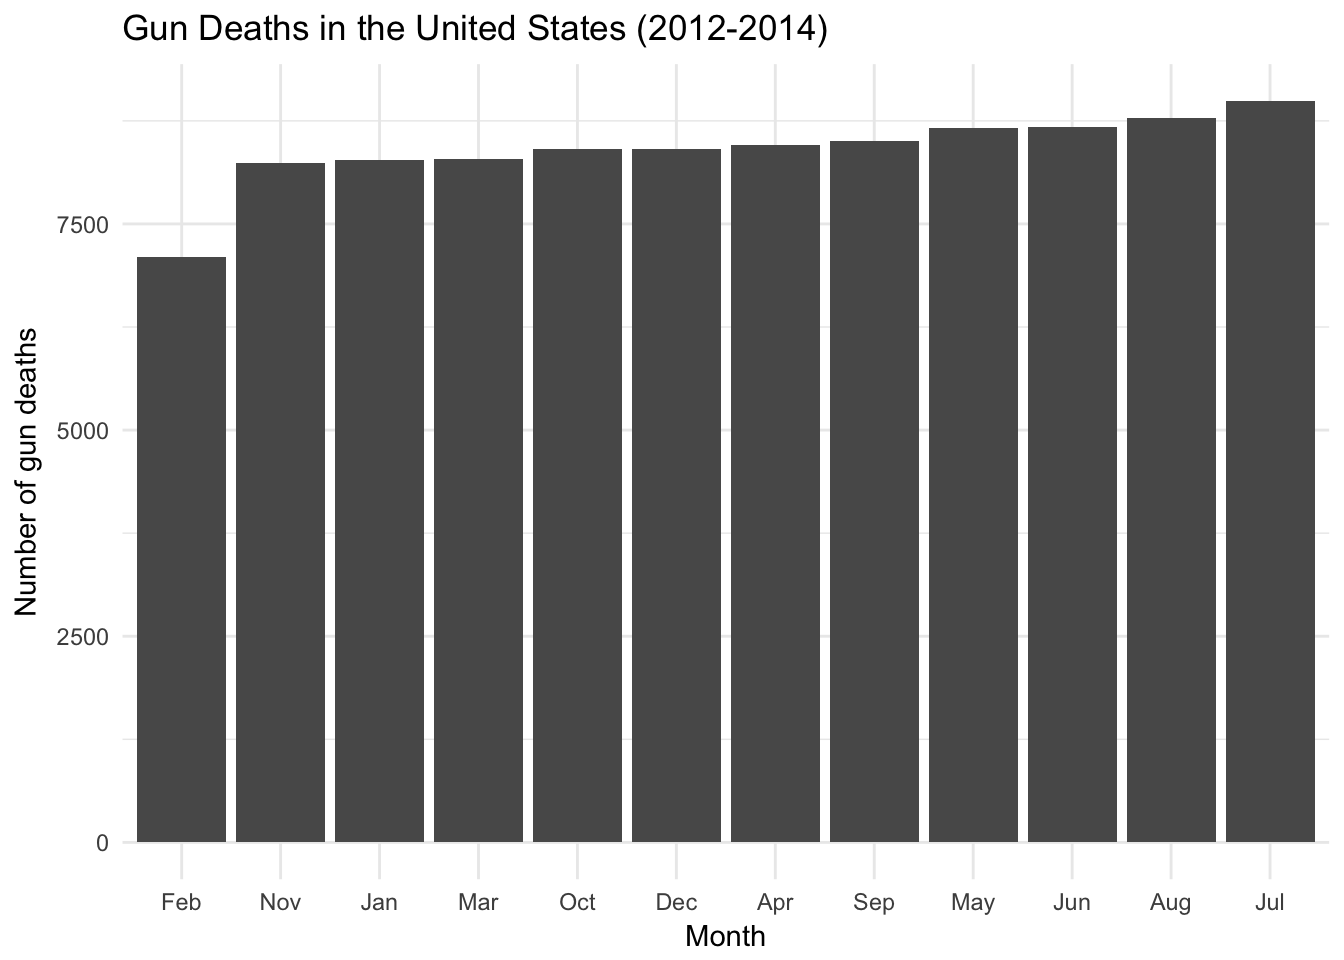
Visualize the frequency of intent of gun deaths using a bar chart, sorted from most to least frequent
Click for the solution
intent_levels <- c("Accidental", "Homicide", "Suicide", "Undetermined")

gun_deaths %>%
  filter(!is.na(intent)) %>%
  mutate(intent = parse_factor(intent, levels = intent_levels)) %>%
  ggplot(aes(intent %>%
               fct_infreq() %>%
               fct_rev())) +
  geom_bar() +
  labs(title = "Gun Deaths in the United States (2012-2014)",
       x = "Intent of death",
       y = "Number of gun deaths") +
  coord_flip()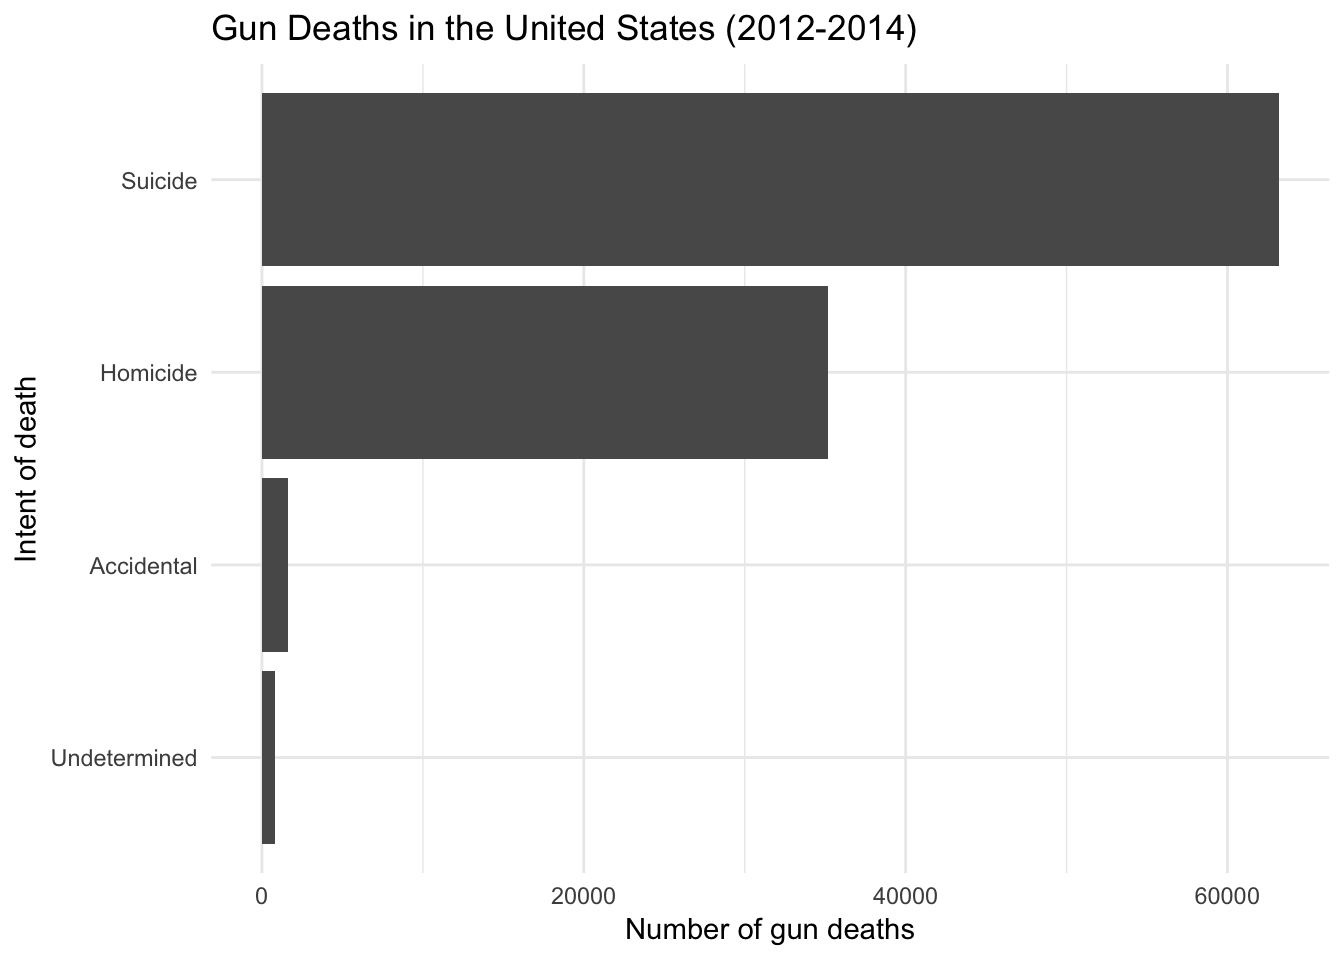
Visualize total gun deaths by season of the year using a bar chart.
Hint: do not use cut() to create the season column.
Click for the solution
gun_deaths %>%
  mutate(season = fct_collapse(month,
                               "Winter" = c("Jan", "Feb", "Mar"),
                               "Spring" = c("Apr", "May", "Jun"),
                               "Summer" = c("Jul", "Aug", "Sep"),
                               "Fall" = c("Oct", "Nov", "Dec"))) %>%
  ggplot(aes(season)) +
  geom_bar() +
  labs(title = "Gun Deaths in the United States (2012-2014)",
       x = "Season",
       y = "Number of gun deaths")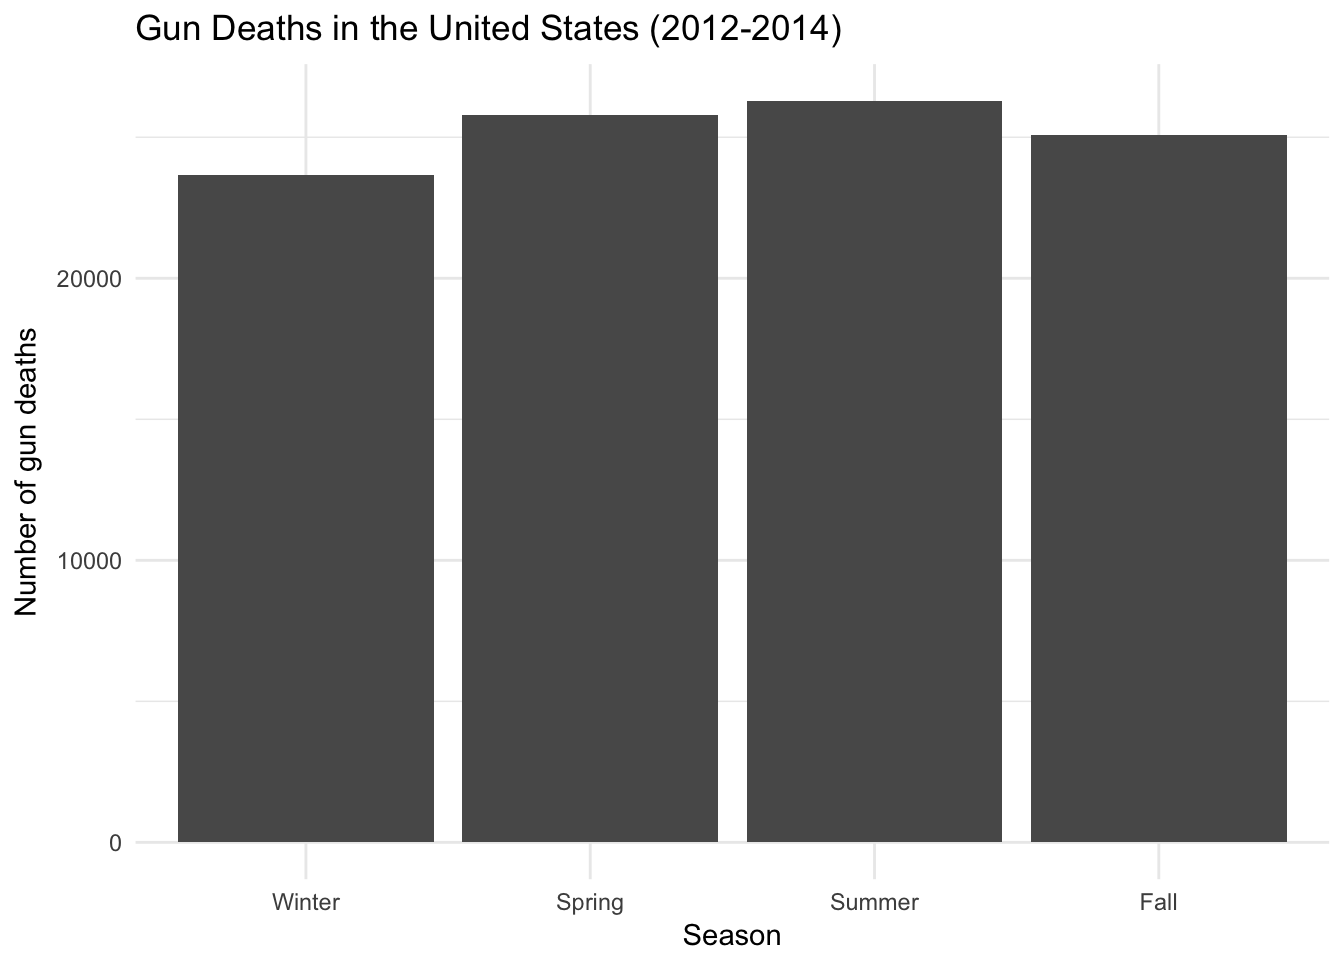
Session Info
devtools::session_info()## Session info -------------------------------------------------------------## setting value
## version R version 3.4.3 (2017-11-30)
## system x86_64, darwin15.6.0
## ui X11
## language (EN)
## collate en_US.UTF-8
## tz America/Chicago
## date 2018-03-19## Packages -----------------------------------------------------------------## package * version date source
## assertthat 0.2.0 2017-04-11 CRAN (R 3.4.0)
## backports 1.1.2 2017-12-13 CRAN (R 3.4.3)
## base * 3.4.3 2017-12-07 local
## bindr 0.1.1 2018-03-13 CRAN (R 3.4.3)
## bindrcpp 0.2 2017-06-17 CRAN (R 3.4.0)
## broom 0.4.3 2017-11-20 CRAN (R 3.4.1)
## cellranger 1.1.0 2016-07-27 CRAN (R 3.4.0)
## cli 1.0.0 2017-11-05 CRAN (R 3.4.2)
## colorspace 1.3-2 2016-12-14 CRAN (R 3.4.0)
## compiler 3.4.3 2017-12-07 local
## crayon 1.3.4 2017-10-03 Github (gaborcsardi/crayon@b5221ab)
## datasets * 3.4.3 2017-12-07 local
## devtools 1.13.5 2018-02-18 CRAN (R 3.4.3)
## digest 0.6.15 2018-01-28 CRAN (R 3.4.3)
## dplyr * 0.7.4.9000 2017-10-03 Github (tidyverse/dplyr@1a0730a)
## evaluate 0.10.1 2017-06-24 CRAN (R 3.4.1)
## forcats * 0.3.0 2018-02-19 CRAN (R 3.4.3)
## foreign 0.8-69 2017-06-22 CRAN (R 3.4.3)
## ggplot2 * 2.2.1 2016-12-30 CRAN (R 3.4.0)
## glue 1.2.0 2017-10-29 CRAN (R 3.4.2)
## graphics * 3.4.3 2017-12-07 local
## grDevices * 3.4.3 2017-12-07 local
## grid 3.4.3 2017-12-07 local
## gtable 0.2.0 2016-02-26 CRAN (R 3.4.0)
## haven 1.1.1 2018-01-18 CRAN (R 3.4.3)
## hms 0.4.2 2018-03-10 CRAN (R 3.4.3)
## htmltools 0.3.6 2017-04-28 CRAN (R 3.4.0)
## httr 1.3.1 2017-08-20 CRAN (R 3.4.1)
## jsonlite 1.5 2017-06-01 CRAN (R 3.4.0)
## knitr * 1.20 2018-02-20 CRAN (R 3.4.3)
## lattice 0.20-35 2017-03-25 CRAN (R 3.4.3)
## lazyeval 0.2.1 2017-10-29 CRAN (R 3.4.2)
## lubridate 1.7.3 2018-02-27 CRAN (R 3.4.3)
## magrittr 1.5 2014-11-22 CRAN (R 3.4.0)
## memoise 1.1.0 2017-04-21 CRAN (R 3.4.0)
## methods * 3.4.3 2017-12-07 local
## mnormt 1.5-5 2016-10-15 CRAN (R 3.4.0)
## modelr 0.1.1 2017-08-10 local
## munsell 0.4.3 2016-02-13 CRAN (R 3.4.0)
## nlme 3.1-131.1 2018-02-16 CRAN (R 3.4.3)
## parallel 3.4.3 2017-12-07 local
## pillar 1.2.1 2018-02-27 CRAN (R 3.4.3)
## pkgconfig 2.0.1 2017-03-21 CRAN (R 3.4.0)
## plyr 1.8.4 2016-06-08 CRAN (R 3.4.0)
## psych 1.7.8 2017-09-09 CRAN (R 3.4.1)
## purrr * 0.2.4 2017-10-18 CRAN (R 3.4.2)
## R6 2.2.2 2017-06-17 CRAN (R 3.4.0)
## rcfss * 0.1.5 2017-07-31 local
## Rcpp 0.12.15 2018-01-20 CRAN (R 3.4.3)
## readr * 1.1.1 2017-05-16 CRAN (R 3.4.0)
## readxl 1.0.0 2017-04-18 CRAN (R 3.4.0)
## reshape2 1.4.3 2017-12-11 CRAN (R 3.4.3)
## rlang 0.2.0 2018-02-20 cran (@0.2.0)
## rmarkdown 1.9 2018-03-01 CRAN (R 3.4.3)
## rprojroot 1.3-2 2018-01-03 CRAN (R 3.4.3)
## rstudioapi 0.7 2017-09-07 CRAN (R 3.4.1)
## rvest 0.3.2 2016-06-17 CRAN (R 3.4.0)
## scales 0.5.0 2017-08-24 cran (@0.5.0)
## stats * 3.4.3 2017-12-07 local
## stringi 1.1.7 2018-03-12 CRAN (R 3.4.3)
## stringr * 1.3.0 2018-02-19 CRAN (R 3.4.3)
## tibble * 1.4.2 2018-01-22 CRAN (R 3.4.3)
## tidyr * 0.8.0 2018-01-29 CRAN (R 3.4.3)
## tidyverse * 1.2.1 2017-11-14 CRAN (R 3.4.2)
## tools 3.4.3 2017-12-07 local
## utf8 1.1.3 2018-01-03 CRAN (R 3.4.3)
## utils * 3.4.3 2017-12-07 local
## withr 2.1.1 2017-12-19 CRAN (R 3.4.3)
## xml2 1.2.0 2018-01-24 CRAN (R 3.4.3)
## yaml 2.1.18 2018-03-08 CRAN (R 3.4.4)This work is licensed under the CC BY-NC 4.0 Creative Commons License.