Why R?
Open-source
R is open-source software, which means using it is completely free. Second, open-source software is developed collaboratively, meaning the source code is open to public inspection, modification, and improvement.
Popular
R is widely used in the physical and social sciences, as well as in government, non-profits, and the private sector.
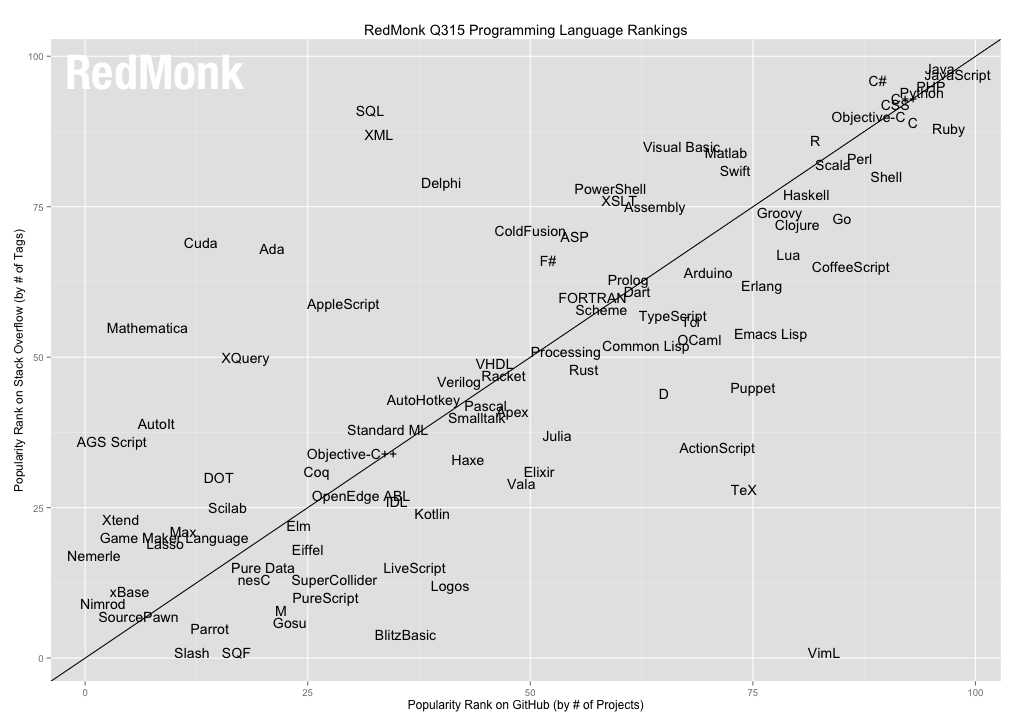
Many developers and social scientists write programs in R. As a result, there is also a large support community available to help troubleshoot problematic code. As seen in the Redmonk programming language rankings (which compare languages’ appearances on Github [usage] and StackOverflow [support]), R appears near the top of both rankings.
Lack of point-and-click interface
R, like any computing language, relies on programmatic execution of functions. That is, to do anything you must write code. This differs from popular statistical software such as Stata or SPSS which at their core utilize a command language but overlay them with drop-down menus that enable a point-and-click interface. While much easier to operate, there are several downsides to this approach - mainly that it makes it impossible to reproduce one’s analysis.
Things R does well
- Statistical analysis - R was written by statisticians, so it is designed first and foremost as a language for statistical analysis.
- Data visualization - while the base R
graphicspackage is comprehensive and powerful, additional libraries such asggplot2andlatticemake R the go-to language for power data visualization approaches.
Things R does not do as well
- Speed - while by no means a slug, R is not written to be a fast, speedy language. Depending on the complexity of the task and the size of your data, you may find R taking a long time to execute your program.
Why are we not using Python?
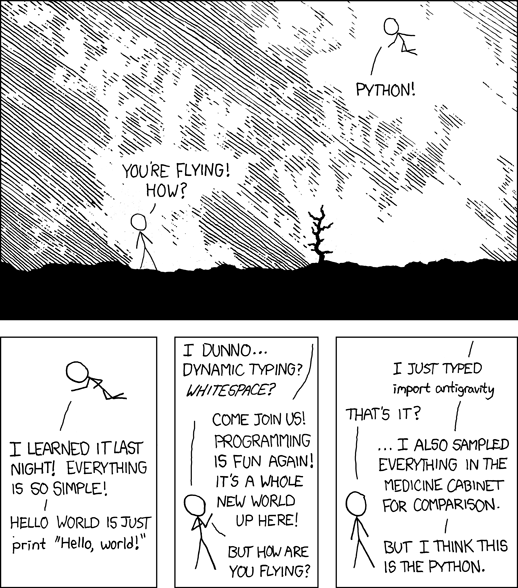
Python was developed in the 1990s as a general-purpose programming language. It emphasizes simplicity over complexity in both its syntax and core functions. As a result, code written in Python is (relatively) easy to read and follow as compared to more complex languages like Perl or Java. As you can see in the above references, Python is just as, if not more, popular than R. It does many things well, like R, but is perhaps better in some aspects:
- General computation - since Python is a general computational language, it is more versatile at non-statistical tasks and is a bit more popular outside the statistics community.
- Speed - because it is a general computing language, Python is optimized to be fast (assuming you write your code optimally). As your data becomes larger or more complex, you might find Python to be faster than R for your analytical needs.
- Workflow - since Python is a general-purpose language, you can build entire applications using it. R, not so much.
That said, there are also things it does not do as well as R:
- Visualizations - visual graphics libraries in Python are increasing in number and quality (see
matplotlib,pygal, andseaborn), but are still behind R in terms of comprehensiveness and ease of use. Of course, once you wish to create interactive and advanced information visualizations, you can also used more specialized software such as Tableau or D3. - Add-on libraries - previously Python was criticized for its lack of libraries to perform statistical analysis and data manipulation, especially relative to the plethora of libraries for R. In recent years Python has begun to catch up with libraries for scientific computing (
numpy), data analysis (pandas), and machine learning (scikit-learn).
This course could be taught exclusively in Python (as it was in previous incarnations) or a combination of R and Python (as it was in fall 2016). From my past experience, I think the best introduction to computer programming focuses on a single language. Learning two languages simultaneously is extremely difficult. It is better to stick with a single language and syntax. Once you complete this course, you will have the basic skills necessary to learn Python on your own.
Acknowledgements
- This page is derived in part from “R vs Python for Data Science: The Winner is …”.
This work is licensed under the CC BY-NC 4.0 Creative Commons License.

