中文 · English
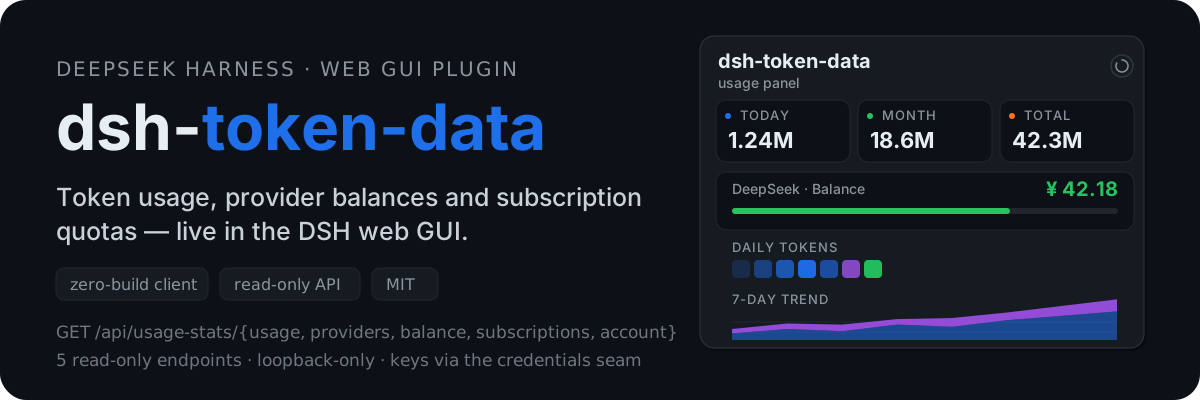





**dsh-token-data** is a [DeepSeek Harness](https://github.com/deepseek-ai/deepseek-harness) (DSH) plugin that puts a live token-usage dashboard inside the `dsh web` GUI. Click the sidebar footer badge to open a floating panel with your per-day token burn, provider balances and subscription quota windows - no tab-switching between provider dashboards, no spreadsheet bookkeeping.
## What you get
| You want to know | The panel shows |
| --- | --- |
| How many tokens did I burn today / this month? | Hero summary cards + a Codex-style **daily heatmap** |
| Where are the tokens going? | **Per-day, per-model** breakdown with a 7-day stacked trend chart |
| Is my DeepSeek balance about to run out? | **Provider balances** (DeepSeek, OpenRouter, Moonshot/Kimi, Z.ai ...) |
| How much of my subscription window is left? | **Quota windows** for OpenCode Go, Z.ai, Kimi and MiniMax token plans |
| Is my prompt cache actually helping? | **Cache hit rate** per day, right next to the totals |
## Why it is different
- **Tracks DSH 0.2** - usage is read from `sessionPersistence` (`list` / `open` / `read`) instead of the deprecated synchronous `Session` event readers, provider connection facts come from the live `settings.describe()` projection, and the browser bundle imports no harness Client package (icons are drawn inline), so a renamed primitives icon can no longer crash the panel.
- **Zero build step** - the browser bundle is a hand-written `__ModuleLoader__` module (no bundler, no npm install for consumers); the server is plain ESM. Clone, add, restart.
- **Read-only, loopback-only API** - five `GET` endpoints behind a peer-socket loopback fence; nothing is ever written to your sessions.
- **Keys stay in the credentials seam** - provider API keys are resolved through the harness credentials service at request time. The plugin stores nothing.
- **Incremental aggregation** - per-session fold state is cached (`/storages/usage-stats-cache.json`) behind a stable artifact key (size + event count); steady-state cost stays O(new events) no matter how large the logs grow (measured: ~0.2 s for 121 local sessions).
- **Resilient panel** - network/timeout/HTTP errors get friendly localized messages, transient failures retry with backoff, and the last good payload is kept so a hiccup never blanks the panel.
- **Locale-aware formatting** - 亿/万 for zh/ja, K/M/B for en, and every color comes from a light/dark theme token.
## Supported providers
| Provider | Balance | Subscription / quota |
| --- | --- | --- |
| DeepSeek | `GET /user/balance` (CNY) | - |
| OpenRouter | `GET /api/v1/credits` (management key) | - |
| Moonshot / Kimi | `GET /v1/users/me/balance` | Kimi coding usage |
| Z.ai (GLM) | `GET /api/paas/v4/balance` | Coding Plan quota windows |
| OpenCode Go | - | Undocumented usage endpoint + workspace-dashboard fallback |
| MiniMax | - | Token-plan remains (global / CN) |
| Anything else | Generic `new-api` / `sub2api` / `general` adapters, plus declarative JSON-Pointer config | |
Providers without a public balance API show an explicit **no public balance interface** state instead of a guessed number.
## Install
**Prerequisites:** a working DSH (`dsh web` runs), Node.js >= 20.
### Option A - install from npm (recommended)
```bash
dsh plugin --profile web add dsh-token-data
```
### Option B - clone and add (review the source / contribute)
```bash
git clone https://github.com/dawsondx/dsh-token-data.git
cd dsh-token-data
dsh plugin --profile web add \
--ignore-scripts --config.auto-install-peers=false \
.
```
### Option C - add directly from GitHub (no npm needed)
```bash
dsh plugin --profile web add \
--ignore-scripts --config.auto-install-peers=false \
github:dawsondx/dsh-token-data
```
### Option D - local development
```bash
dsh plugin --profile web add link:C:/path/to/dsh-token-data
```
Restart `dsh web` after installing. The panel opens from the footer badge in the sidebar; use the profile's `cordis.patch.yml` to configure monitors (example below).
## Configuration
The plugin is a [DSH profile bundle](https://github.com/deepseek-ai/deepseek-harness) (`dsh.bundle.patch`), mounting the internal plugin id `usage-stats`. Attach monitors and per-provider options in your web profile's `cordis.patch.yml`:
```yaml
- id: usage-stats
config:
monitors:
deepseek-official:
adapter: deepseek-balance
allowPrivateNetwork: true # allow local proxy (TUN/fake-ip) resolution
minimax-cn:
adapter: minimax-token-plan
region: cn # MiniMax CN account
```
## How it works
```mermaid
flowchart LR
S[session event logs] --> F[incremental fold
per-day / per-model]
F --> C[(usage-stats cache
DSH_HOME/storages)]
C --> E[5 read-only loopback endpoints]
E --> P[web panel
heatmap - balances - quotas]
K[credentials seam] -. resolve keys at request time .-> E
```
The server registers five exact routes under `/api`, so they take precedence over the connection plugin's `/api` prefix handler. Aggregation is anchored on `sessionPersistence`: `list()` reports every stored session's log artifact and `open(id, "read")` + `read(offset)` returns only the events after the folded prefix. A session whose artifact did not change (same size and event count) is skipped for that whole round, so steady-state cost is independent of the total log volume.
Folding matches the harness's own `token-meter` projection: a sample rides `assistant/message`'s `data.usage` or, when absent, the last `usage` chunk of that event's `stream`, and `assistant/attempt` (a failed or retried attempt) counts too. A repeated `(turn, step)` **replaces** the earlier value instead of adding to it, and `llm/retry-started` clears the slot so the retried attempt accumulates. A forked session counts only its own events (after `inheritedEventCount`), so an ancestor's usage is never counted twice. Legacy artifacts the backend refuses to open are remembered and excluded from the totals behind a single aggregated warning, so they never slow every refresh down.
| Endpoint | Purpose |
| --- | --- |
| `GET /api/usage-stats/usage` | Per-day token usage across every session |
| `GET /api/usage-stats/providers` | Configured providers + balance schemes |
| `GET /api/usage-stats/balance?provider=` | Balance for one provider |
| `GET /api/usage-stats/subscriptions` | OpenCode Go + Z.ai quota windows |
| `GET /api/usage-stats/account` | Unified account snapshot for one provider |
## Security
- **Read-only** - every endpoint is `GET`; nothing is written to your sessions or logs.
- **Loopback-only** - the peer-socket address (not the client-controlled `Host` header) must be a loopback interface; the `Host` header is only a secondary check.
- **No key storage** - credentials are resolved through the harness credentials seam at request time; account snapshots redact sensitive headers (`authorization`, `cookie`, `api-key`, ...).
- **Bounded upstream calls** - 15 s timeouts and 1 MB response caps on provider requests.
## Development
```bash
npm run check # node --check on every lib file
npm test # pure-function assertions for the fold (replace / retry / attribution)
```
`lib/usage.js` and `lib/balance.js` are pure modules (no cordis imports) - the folding and balance parsing can be unit-tested and validated against real logs outside the harness. The browser half has no build step: edit `lib/client.js` and refresh the page (the harness client-hmr re-serves the bundle when the file changes). The Host half (`lib/index.js`) belongs to the Node module graph, so changing it requires a `dsh web` restart.
## Acknowledgments
- [dsh-usage-stats](https://github.com/Ychris12138/dsh-usage-stats) (MIT, © 2026 dsh-usage-stats contributors) - the base this project grew out of: the internal plugin id `usage-stats` and the API routes are kept for compatibility, while the package name and the front-end bundle are new.
- [cc-switch](https://github.com/farion1231/cc-switch) (MIT) - inspiration for the stats-panel UI (hero summary cards, SVG stacked trend chart, tabular numerals) and the `formatTokensShort` locale-aware formatting logic (亿/万 for zh/ja, K/M/B for en).
## License
[MIT](./LICENSE) © dawsondx