# Lonboard
[![PyPI][pypi_badge]][pypi_link]
[![Conda Version][conda_version_badge]][conda_version]
[![PyPI - Downloads][pypi-img]][pypi-link]
[![Binder][binder_badge]][binder_jupyterlab_url]
[![open_in_colab][colab_badge]][colab_notebook_link]
[pypi_badge]: https://badge.fury.io/py/lonboard.svg
[pypi_link]: https://pypi.org/project/lonboard/
[binder_badge]: https://mybinder.org/badge_logo.svg
[binder_jupyterlab_url]: https://mybinder.org/v2/gh/developmentseed/lonboard/HEAD?urlpath=lab/tree/examples/
[colab_badge]: https://colab.research.google.com/assets/colab-badge.svg
[colab_notebook_link]: https://colab.research.google.com/github/developmentseed/lonboard/blob/main
[conda_version_badge]: https://img.shields.io/conda/vn/conda-forge/lonboard.svg
[conda_version]: https://anaconda.org/conda-forge/lonboard
[pypi-img]: https://static.pepy.tech/badge/lonboard
[pypi-link]: https://pypi.org/project/lonboard/

Fast, interactive geospatial data visualization in Jupyter.
Building on cutting-edge technologies like [GeoArrow](https://github.com/geoarrow/geoarrow) and [GeoParquet](https://github.com/opengeospatial/geoparquet) in conjunction with [GPU-based map rendering](https://deck.gl/), Lonboard aims to enable visualizing large geospatial datasets interactively through a simple interface.
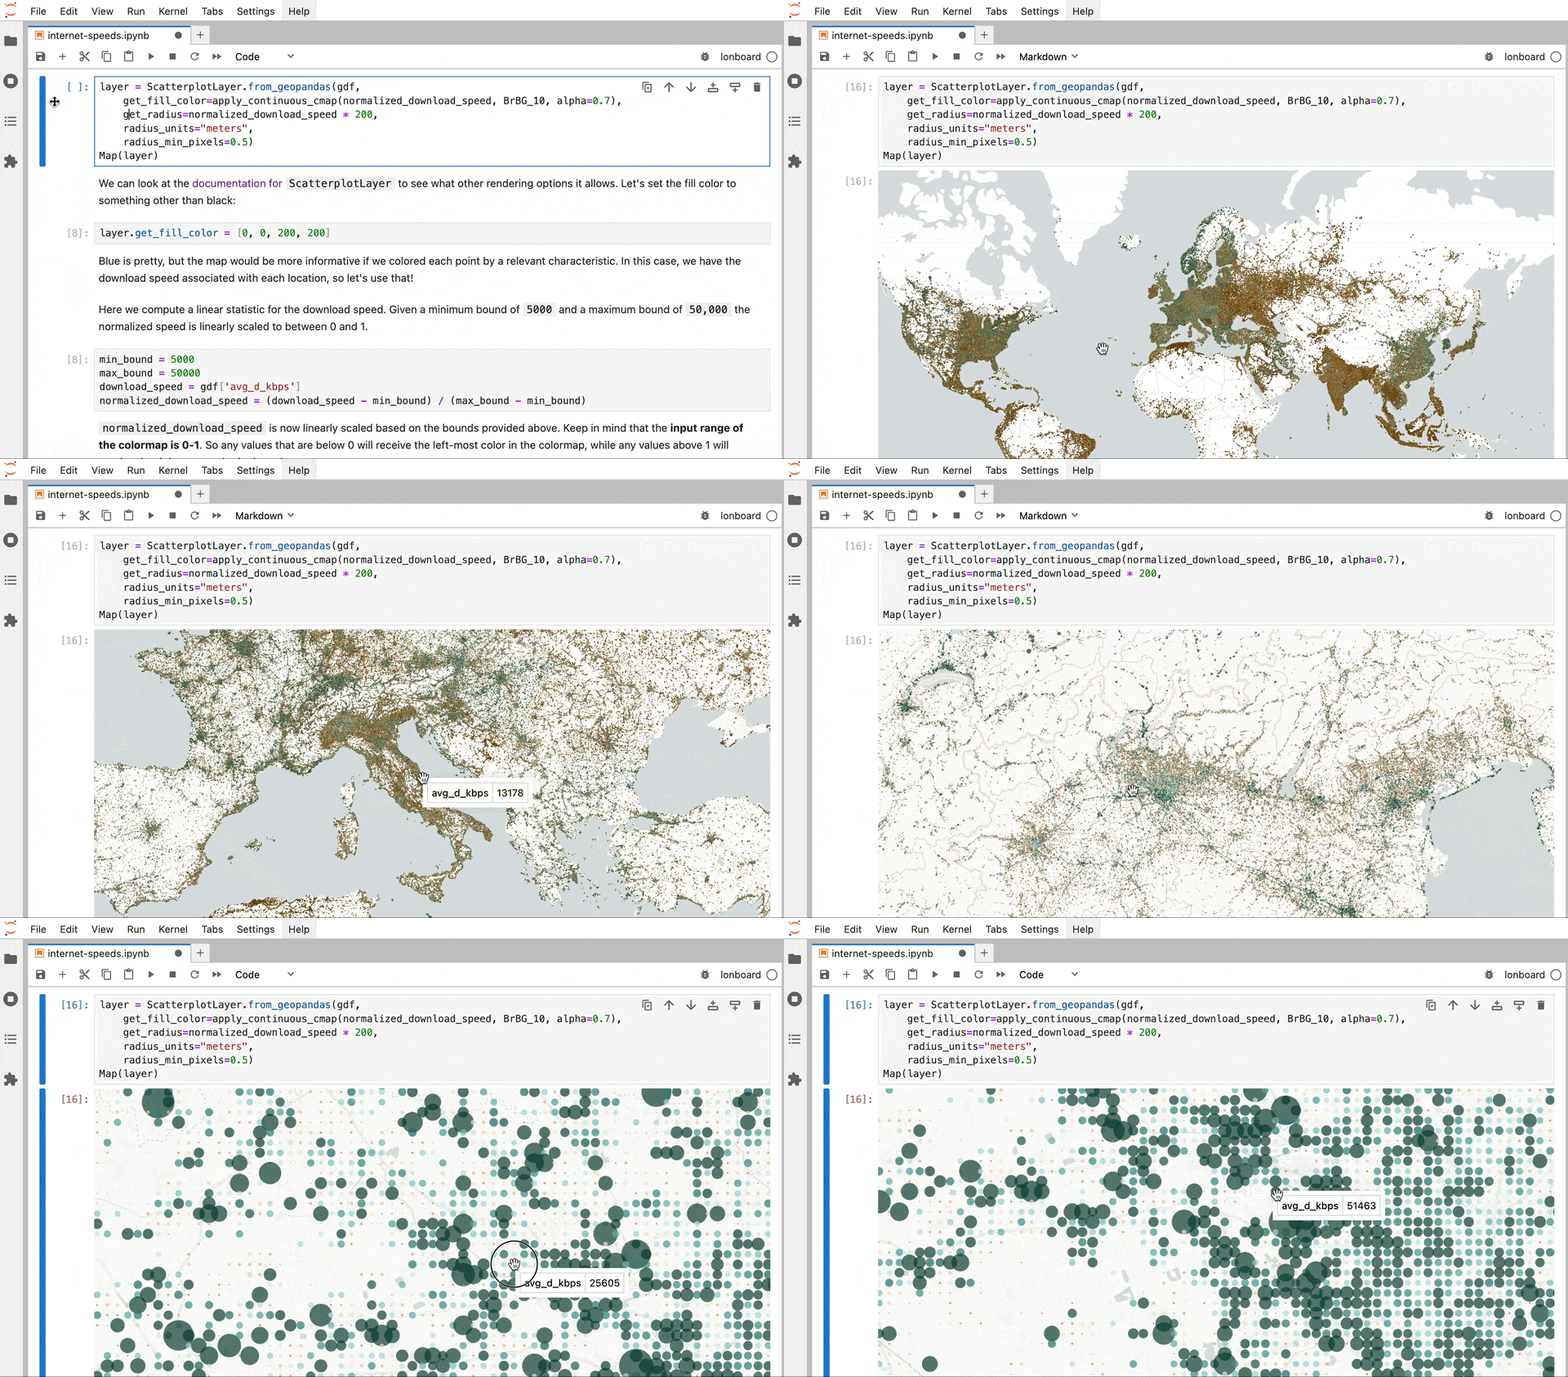
3 million points rendered from a GeoPandas GeoDataFrame in JupyterLab. Example notebook.
## Install
To install Lonboard using pip:
```
pip install lonboard
```
Lonboard is on [conda-forge](https://anaconda.org/conda-forge/lonboard) and can be installed using [conda](https://docs.conda.io), [mamba](https://mamba.readthedocs.io/), or [pixi](https://pixi.sh/). To install Lonboard using conda:
```
conda install -c conda-forge lonboard
```
To install from source, refer to the [developer documentation](https://github.com/developmentseed/lonboard/blob/main/DEVELOP.md).
## Get Started
For the simplest rendering, pass geospatial data into the top-level [`viz` function](https://developmentseed.org/lonboard/latest/api/viz/#lonboard.viz.viz).
```py
import geopandas as gpd
from lonboard import viz
gdf = gpd.GeoDataFrame(...)
viz(gdf)
```
Under the hood, this delegates to a [`ScatterplotLayer`](https://developmentseed.org/lonboard/latest/api/layers/scatterplot-layer/), [`PathLayer`](https://developmentseed.org/lonboard/latest/api/layers/path-layer/), or [`PolygonLayer`](https://developmentseed.org/lonboard/latest/api/layers/polygon-layer/). Refer to the [documentation](https://developmentseed.org/lonboard/) and [examples](https://developmentseed.org/lonboard/latest/examples/internet-speeds/) for more control over rendering.
## Documentation
Refer to the documentation at [developmentseed.org/lonboard](https://developmentseed.org/lonboard/).
## Why the name?
This is a new binding to the [deck.gl](https://deck.gl) geospatial data visualization library. A "deck" is the part of a skateboard you ride on. What's a fast, geospatial skateboard? A lonboard.
_Illustration by [Gus Becker]._
[Gus Becker]: https://gusbus.space/