# 使用Prometheus监控告警
DolphinDB提供了三种方式进行性能监控:
* 使用内置函数,如[`getperf`](https://www.dolphindb.cn/cn/help/FunctionsandCommands/FunctionReferences/g/getPerf.html),[`getClusterPerf`](https://www.dolphindb.cn/cn/help/FunctionsandCommands/FunctionReferences/g/getClusterPerf.html)和[`getJobStat`](https://www.dolphindb.cn/cn/help/FunctionsandCommands/FunctionReferences/g/getJobStat.html);
* Web界面;
* 通过第三方系统的API,如Prometheus, Grafana等。
前两种方式的使用说明详见[用户手册](https://www.dolphindb.cn/cn/help/SystemManagement/PerformanceMonitoring.html),本文以使用Prometheus监控DolphinDB为例来详细说明第三种方法。
本文以监控系统平均负载为例,安装配置 Prometheus 和其 Alertmanager 组件,然后接入邮件报警,演示系统负载高时自动邮件报警的功能。用户可以参照此文,根据自己的实际需求来实现具体的运维方案。
- [1. Prometheus metrics](#1-prometheus-metrics)
- [2. 下载Prometheus](#2-下载prometheus)
- [3.安装及配置](#3安装及配置)
- [3.1 Prometheus安装及配置](#31-prometheus安装及配置)
- [3.2 Alertmanager安装及配置](#32-alertmanager安装及配置)
- [3.3 启动Prometheus和Alertmanager](#33-启动prometheus和alertmanager)
- [4. 监控展示](#4-监控展示)
## 1. Prometheus metrics
DolphinDB为需要监控的服务产生相应的metrics(指标),Prometheus Server可以直接使用。DolphinDB目前支持的metrics如下所示:
|指标| 类型| 含义|
|----|----|----|
|cpuUsage | Gauge |DolphinDB进程占用CPU的百分比(单位:无)|
|memoryUsed| Gauge | 节点使用的内存(单位:字节)|
|memoryAlloc | Gauge |节点中DolphinDB当前内存池的容量(单位:字节)|
|diskCapacity| Gauge |磁盘容量(单位:字节)|
|diskFreeSpace| Gauge |磁盘剩余空间(单位:字节)|
|lastMinuteWriteVolume| Gauge |前一分钟写磁盘容量(单位:字节)|
|lastMinuteReadVolume| Gauge |前一分钟读磁盘容量(单位:字节)|
|lastMinuteNetworkRecv | Gauge |前一分钟网络接收字节数(单位:字节) |
|lastMinuteNetworkSend| Gauge |前一分钟网络发送字节数(单位:字节)|
|diskReadRate| Gauge |磁盘读速率(单位:字节/秒)|
|diskWriteRate| Gauge |磁盘写速率(单位:字节/秒)|
|networkSendRate| Gauge |网络发送速率(单位:字节/秒)|
|networkRecvRate | Gauge |网络接收速率(单位:字节/秒)|
|cumMsgLatency| Gauge |流数据订阅节点所有已接收的消息的平均延时(单位:纳秒)|
|lastMsgLatency | Gauge |流数据订阅节点最后收到的消息的延时(单位:纳秒)|
|maxLast10QueryTime | Gauge |前10个完成的查询执行所耗费时间的最大值(单位:纳秒) |
|medLast10QueryTime | Gauge |前10个完成的查询执行所耗费时间的中间值(单位:纳秒) |
|medLast100QueryTime | Gauge |前100个完成的查询执行所耗费时间的中间值(单位:纳秒)|
|maxLast100QueryTime | Gauge |前100个完成的查询执行所耗费时间的最大值(单位:纳秒 |
|maxRunningQueryTime | Gauge |当前正在执行的查询的耗费时间的最大值(单位:纳秒)|
|avgLoad | Gauge |平均负载(单位:无)|
|jobLoad| Gauge |作业负载(单位:无)|
|runningJobs | Gauge |正在执行中的作业和任务数(单位:无)|
|queuedJobs| Gauge |队列中的作业和任务数(单位:无)|
|connectionNum| Guage | 节点连接数|
metric 有两种查看方式:
1. 通过 Prometheus Server 进行查看;
2. 选择要查看的 ip:port,进入对应的网址 `http://ip:port/metrics` 进行查看。例如,本机单节点监听在8848端口的 DolphinDB,可以进入网址 `http://127.0.0.1:8848/metrics` 查看相关数据。
## 2. 下载Prometheus
本例的测试环境为已安装Ubuntu 16.04 LTS 的台式机,使用2.26.0版本的Prometheus 和0.21.0版本的Alertmanager。
从Prometheus官网下载Prometheus和Alertmanager,下载链接为:[https://prometheus.io/download/](https://prometheus.io/download/)。相关文档可参阅[官方帮助](https://prometheus.io/docs/prometheus/latest/getting_started/)。
DolphinDB有以下三种部署方式:
1. 通过Docker容器部署运行DolphinDB;
2. 利用K8S等工具部署DolphinDB的相关组件;
3. 直接部署 DolphinDB。
注:部署DolphinDB的相关文档可查阅:[DolphinDB教程](https://gitee.com/dolphindb/Tutorials_CN/blob/master/README.md#/dolphindb/Tutorials_CN/blob/master/dolphindb_user_guide.md)
## 3.安装及配置
### 3.1 Prometheus安装及配置
* 解压缩安装包
解压缩之后,目录文件如下所示:
```
demo@zhiyu:~/prometheus-2.26.0.linux-amd64$ ls
console_libraries consoles data LICENSE NOTICE prometheus prometheus.yml promtool
```
* 修改prometheus.yml
其中,上述目录下的prometheus.yml就是配置文件,修改后配置如下:
```
global:
scrape_interval: 15s
evaluation_interval: 15s
alerting:
alertmanagers:
- static_configs:
- targets:
- 127.0.0.1:9093
rule_files:
- "./avgLoadMonitor.yml"
scrape_configs:
- job_name: 'DolphinDB'
static_configs:
- targets: ['115.239.209.122:8080','115.239.209.122:25667']
```
其中,`alerting`部分的`targets`部分,指向Alertmanager的地址。
`rule_files`部分定义了预警规则,其中`avgLoadMonitor.yml`需要另外创建,下文将介绍如何配置。
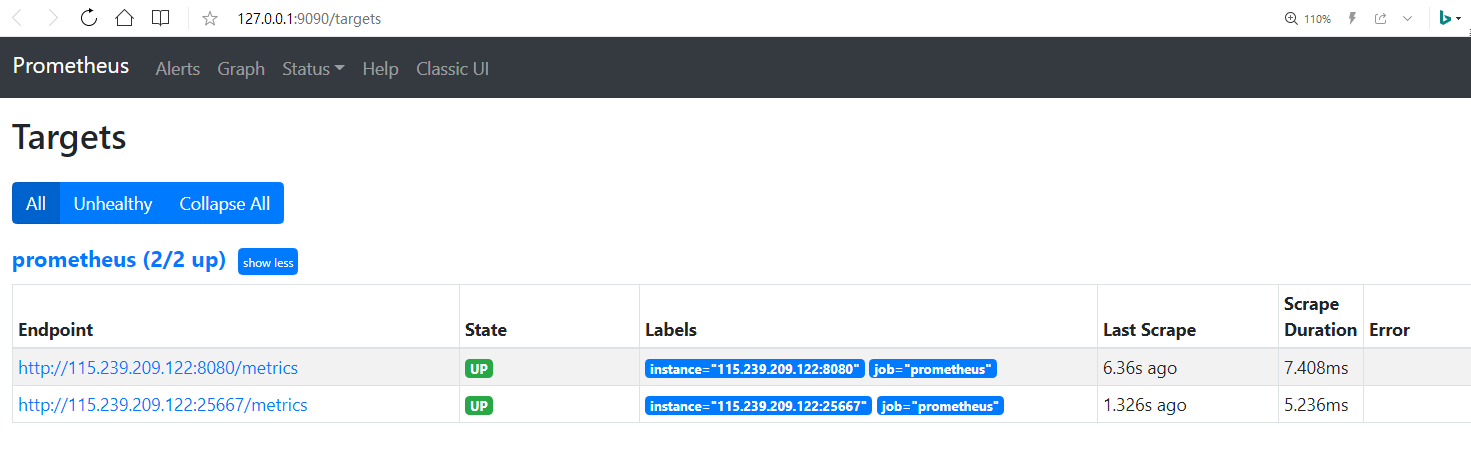
`scrape_configs`部分中的targets指向待监控的DolphinDB的节点地址。本例中添加了2个DolphinDB节点,IP 地址为115.239.209.122,监控端口为8080和25667。若用户在实际操作中想要添加其他节点,按照`“IP:PORT”`的格式添加在`targets`中。
* 创建avgLoadMonitor.yml文件
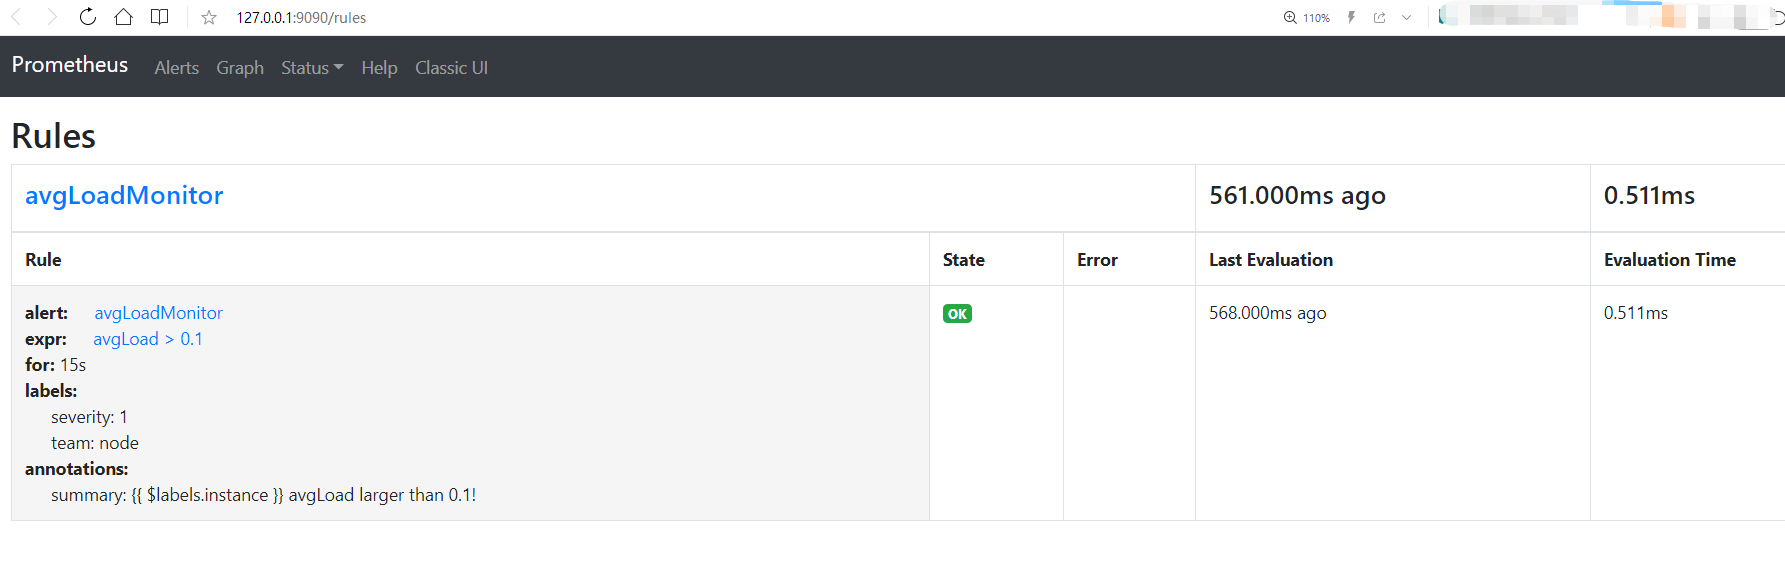
配置avgLoadMonitor.yml的内容如下所示:
```
groups:
- name: avgLoadMonitor
rules:
- alert: avgLoadMonitor
expr: avgLoad > 0.1
for: 15s
labels:
severity: 1
team: node
annotations:
summary: "{{ $labels.instance }} avgLoad larger than 0.1!"
```
本例中使用的指标是avgLoad(DolphinDB提供的一个指标),报警条件为avgLoad> 0.1。用户可根据实际需要,指定指标和报警条件。
### 3.2 Alertmanager安装及配置
* 解压缩安装包
解压后,目录文件如下所示:
```
demo@zhiyu:~/alertmanager-0.21.0.linux-amd64$ ls
alertmanager alertmanager.yml amtool LICENSE NOTICE
```
示例中,alertmanager.yml是配置文件,报警通知渠道可以是电子邮箱、钉钉、企业微信等。
当预警规则被触发时,Prometheus会根据其配置文件中的`alerting`部分,推送信息给Alertmanager,Alertmanager将向已配置的渠道发送报警消息。
* 配置alertmanager.yml
本例演示的报警渠道为QQ邮箱。修改 alertmanager.yml 如下:
```
global:
resolve_timeout: 5m
smtp_from: 'xxxx@qq.com'
smtp_smarthost: 'smtp.qq.com:465'
smtp_auth_username: 'xxxx@qq.com'
smtp_auth_password: 'yyyy'
smtp_require_tls: false
smtp_hello: 'qq.com'
route:
group_by: ['alertname']
group_wait: 5s
group_interval: 5s
repeat_interval: 5m
receiver: 'email'
receivers:
- name: 'email'
email_configs:
- to: 'xxxx@qq.com'
send_resolved: true
inhibit_rules:
- source_match:
severity: 'critical'
target_match:
severity: 'warning'
equal: ['alertname', 'dev', 'instance']
```
>注:xxxx@qq.com请替换为实际邮箱地址;
> 邮箱需要开启SMTP功能,smtp_auth_password: 'yyyy'中的yyyy替换为第三方登录邮箱的授权码。
以qq邮箱为例,获取授权码的具体步骤可参考链接:[获取授权码](https://service.mail.qq.com/cgi-bin/help?subtype=1&id=28&no=1001256)
### 3.3 启动Prometheus和Alertmanager
* 启动Prometheus命令如下:
```
demo@zhiyu:~/prometheus-2.26.0.linux-amd64$ nohup ./prometheus --config.file=prometheus.yml &
```
prometheus默认绑定在9090端口,可以通过前端Web访问,本例使用的地址为127.0.0.1:9090。
* 启动Alertmanager命令如下:
```
demo@zhiyu:~/alertmanager-0.21.0.linux-amd64$ nohup ./alertmanager --config.file=alertmanager.yml &
```
AlertManger默认绑定在9093端口,访问地址是`http://127.0.0.1:9093`,当 Prometheus 中触发报警规则,在该地址中可以看到推送信息,然后提交给具体的渠道处理,从而实现报警。本例中,当负载超过0.1时,邮箱会收到报警邮件。
完成启动后,意味着DolphinDB的指标监控和报警也已完成。
## 4. 监控展示
Prometheus 内置简易的Web控制台,可以查询指标、配置信息等,示例如下:
* 访问http://127.0.0.1:9090/targets 查看被监控的节点:
 * 访问http://127.0.0.1:9090/rules 查看监控报警规则:
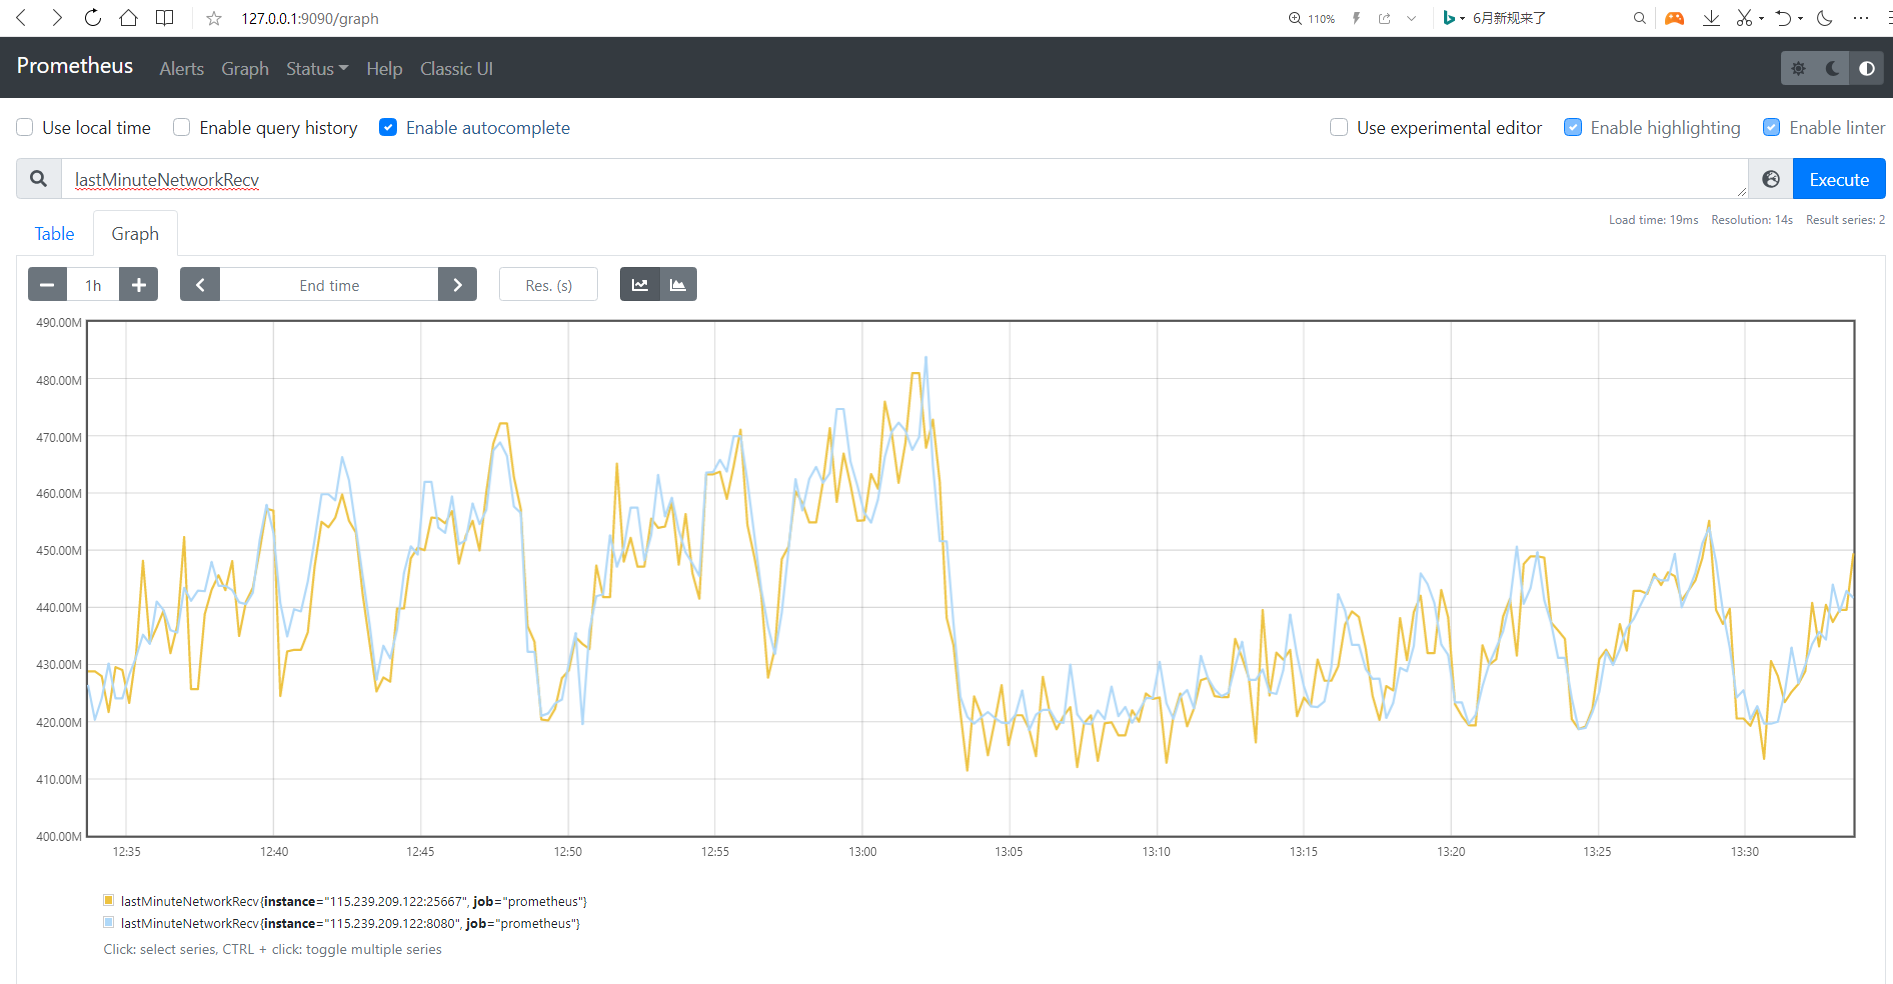
 * 访问http://127.0.0.1:9090/graph 在输入框中输入指标如 *lastMinuteNetworkRecv*,查看对应指标的图形展示:
 在实际工作中,经常将Prometheus作为Grafana的数据源,使用Grafana查看指标或者创建仪表盘。DolphinDB已经实现了Grafana的服务端和客户端的接口,具体配置可以参考[grafana教程](../../grafana-datasource/blob/master/README_CN.md)。