# Codex Usage Tracker
Local-first dashboard, Codex plugin, and companion skill for understanding where your Codex tokens and usage credits are going.
[](https://github.com/douglasmonsky/codex-usage-tracker/actions/workflows/ci.yml)
[](https://pypi.org/project/codex-usage-tracking/)
[](https://pepy.tech/projects/codex-usage-tracking)

[](LICENSE)
> **Unofficial project:** Codex Usage Tracker is an independent open-source project. It is not made by, affiliated with, endorsed by, sponsored by, or supported by OpenAI. OpenAI and Codex are trademarks of OpenAI; this project only reads local log files from your machine.
Codex Usage Tracker reads the JSONL logs already written by Codex, indexes aggregate usage counters plus local content/tool/command/file-event evidence into SQLite, and gives you a dashboard, CLI, and MCP tools for investigating real usage patterns. The content index stays on your machine; CSV exports, generated dashboard HTML, support bundles, and shareable reports omit indexed content by default. Use `refresh --aggregate-only` or `rebuild-index --aggregate-only` when you want the older aggregate-only SQLite posture.
Cloned Codex tasks can copy historical usage rows into a new local log. The tracker preserves those physical rows for provenance but excludes only strict, high-confidence fingerprint matches from default dashboard, API, MCP, summary, recommendation, allowance, and export totals. New calls made inside the clone remain billable. Inspect the exclusion count with `codex-usage-tracker dedupe-diagnostics --json`, MCP `usage_dedupe_diagnostics()`, or `/api/diagnostics/dedupe`.
Built for developers using Codex locally who want to know which threads, models, subagents, and long chats are driving usage without uploading logs anywhere. The public PyPI package is [`codex-usage-tracking`](https://pypi.org/project/codex-usage-tracking/), and it installs the `codex-usage-tracker` command.
After install, you get a localhost dashboard, a local SQLite usage index, CLI reports, MCP tools, and a companion Codex skill for asking questions like "what drove my usage this week?"
## Quick Install
```bash
python -m pip install --user pipx
python -m pipx ensurepath
pipx install codex-usage-tracking
codex-usage-tracker setup
codex-usage-tracker serve-dashboard --open
```
Use your normal Python launcher for your platform: `python3` is common on macOS/Linux, and `py` may be preferable on Windows. On macOS with Homebrew, `brew install pipx` is also fine.
If `codex-usage-tracker` is not found after installing with pipx, open a new terminal or add the binary directory printed by `pipx ensurepath` to your `PATH`.
First install? Start with the [First Five Minutes guide](docs/first-five-minutes.md) for setup, verification, empty-dashboard checks, and safe issue diagnostics.
`serve-dashboard` refreshes active-session usage before opening the React dashboard by default. The legacy dashboard remains available at `/dashboard.html` on the same localhost server. Use `--no-refresh` only when you intentionally want to inspect the cached local index.
Package naming: the PyPI distribution is `codex-usage-tracking`; the installed command is `codex-usage-tracker`; the GitHub repository remains `douglasmonsky/codex-usage-tracker`. The `codex-usage-tracker` PyPI name is not this project, so avoid similarly named packages when following these docs.
Source install for development or branch testing:
```bash
pipx install "git+https://github.com/douglasmonsky/codex-usage-tracker.git"
```
`setup` installs or refreshes the local Codex plugin wrapper, initializes local config templates when needed, refreshes the local usage index, runs `codex-usage-tracker doctor`, and tells you whether Codex needs a restart for plugin discovery.
Want Codex to do it for you? Paste: `Install codex-usage-tracking with pipx, run codex-usage-tracker setup, and open the Codex Usage Tracker dashboard.`
## Talk To Your Usage Data
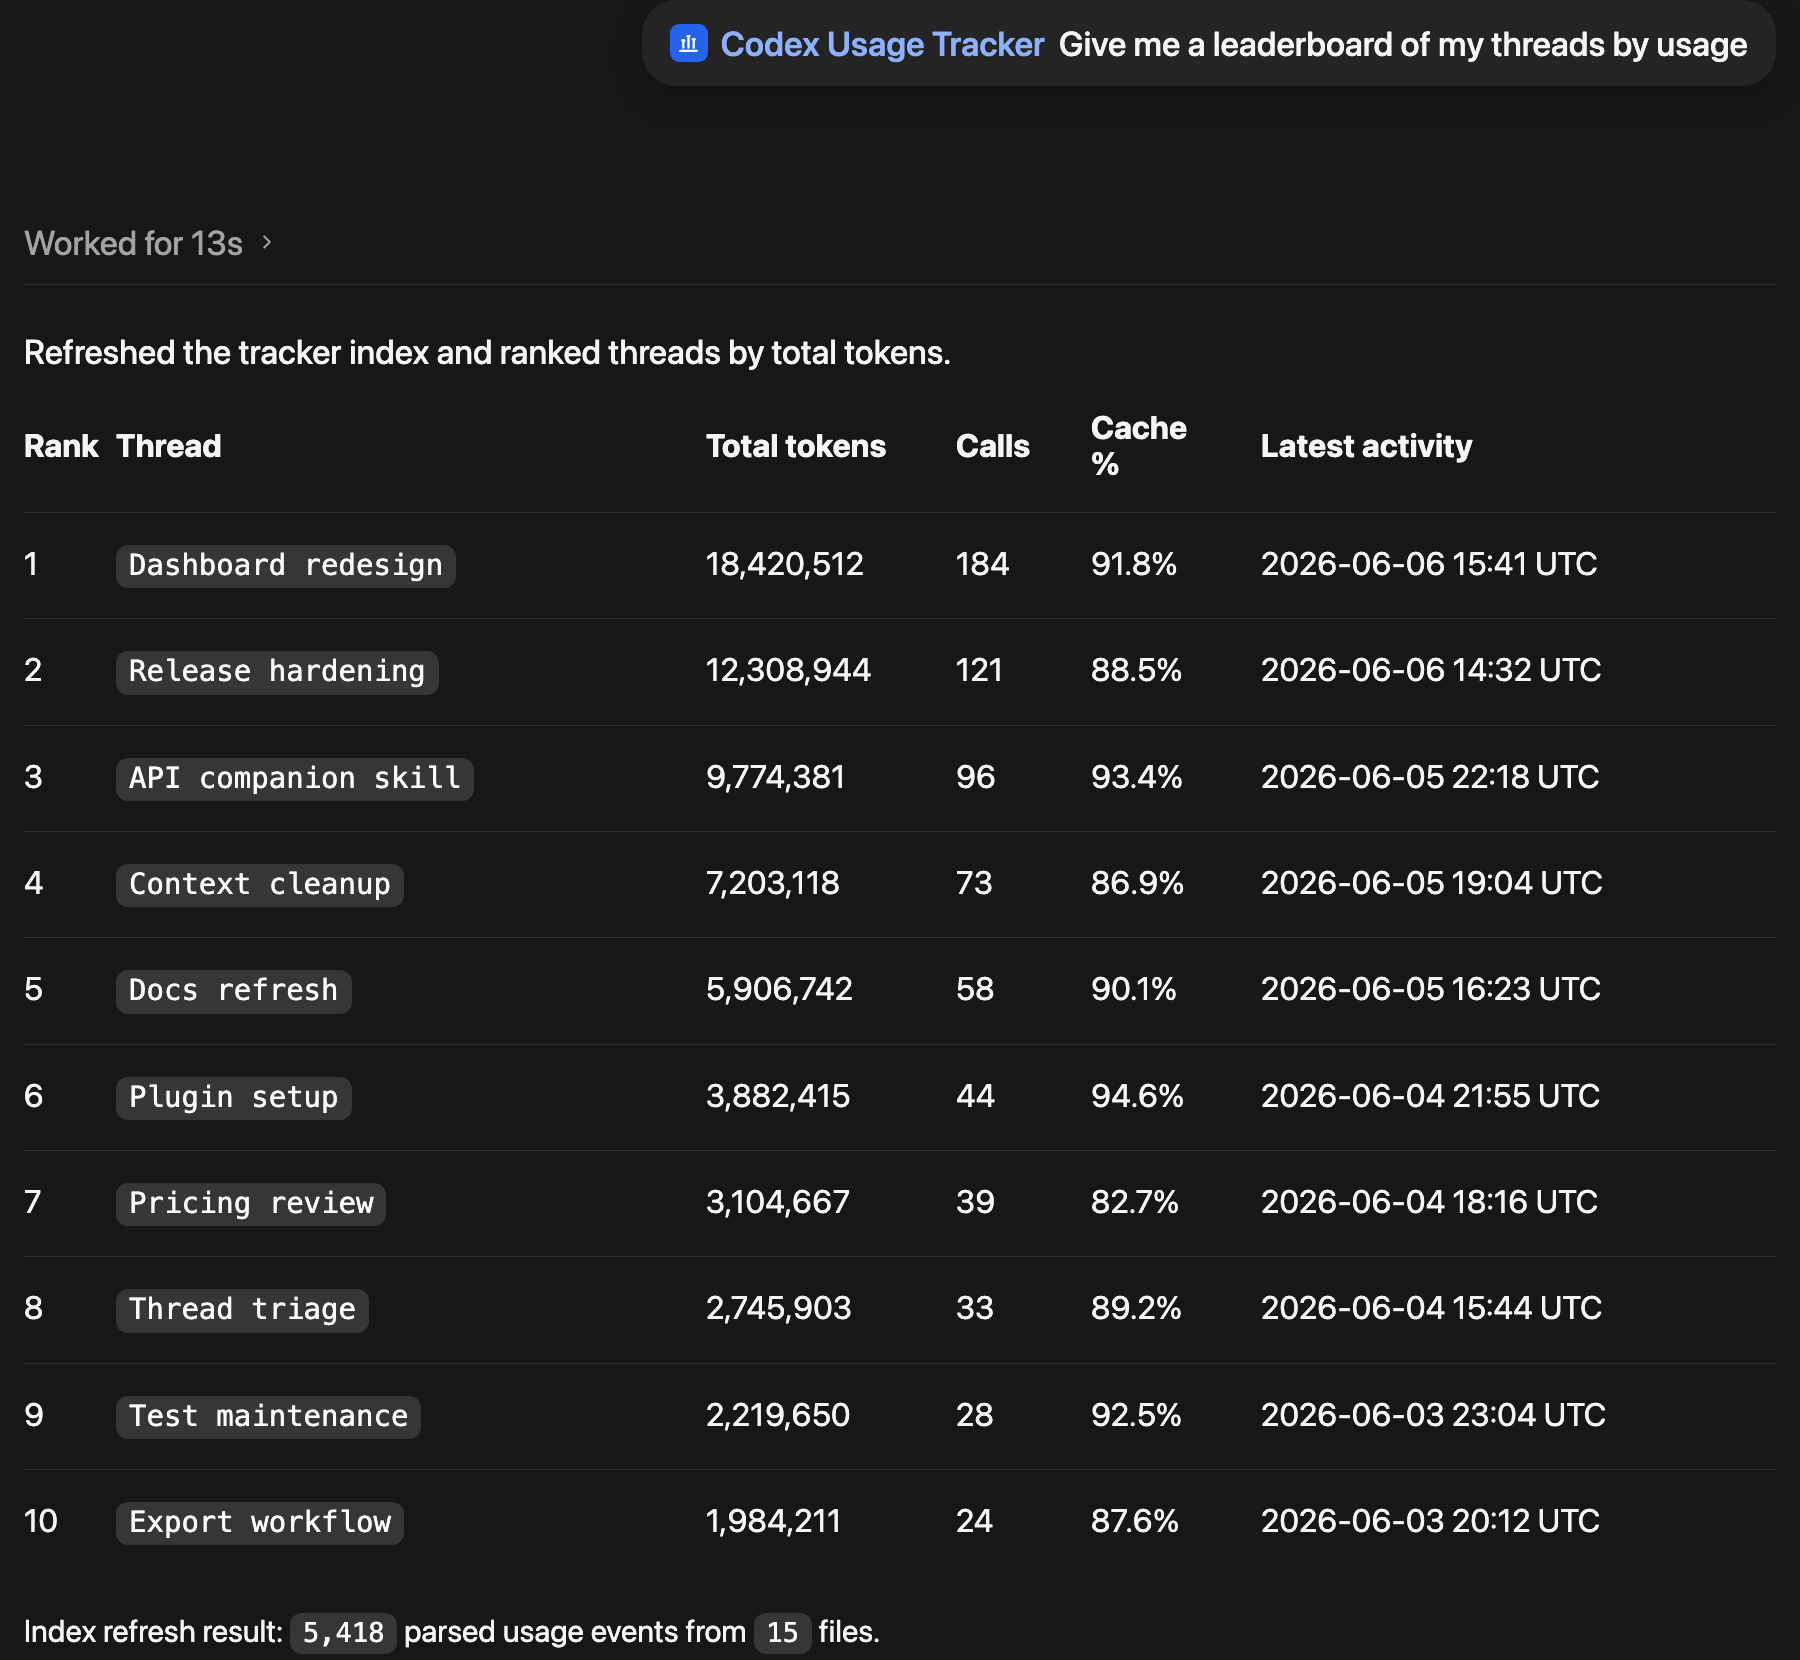
The dashboard shows the evidence; the companion plugin and skills make it conversational. After `setup` and a Codex restart, ask Codex to refresh the local usage index, call MCP tools, and explain what is driving usage. Shareable reports stay aggregate-first and omit indexed content unless an explicit local content tool/export is added for that purpose.
Good starter prompts:
```text
Look through my usage for token waste and recommend what I should change.
Find high-context, low-cache calls worth opening in the investigator.
Which threads are draining the most, and what would reduce that next time?
Compare model and effort usage, then suggest safer defaults.
Open the dashboard and filter Calls to the rows behind your recommendation.
```
The companion skill treats waste discovery as diagnosis plus remediation: it can point to Calls, Threads, Call Investigator, Diagnostics Notebook, Allowance Intelligence, Headroom when available, or a custom local command/skill/report preset Codex can build to stop repeating the same waste pattern.
Example conversation docs:
- [Token Waste Review](docs/examples/token-waste-conversation.md)
- [Remediation Planning](docs/examples/remediation-conversation.md)
## Dashboard Preview
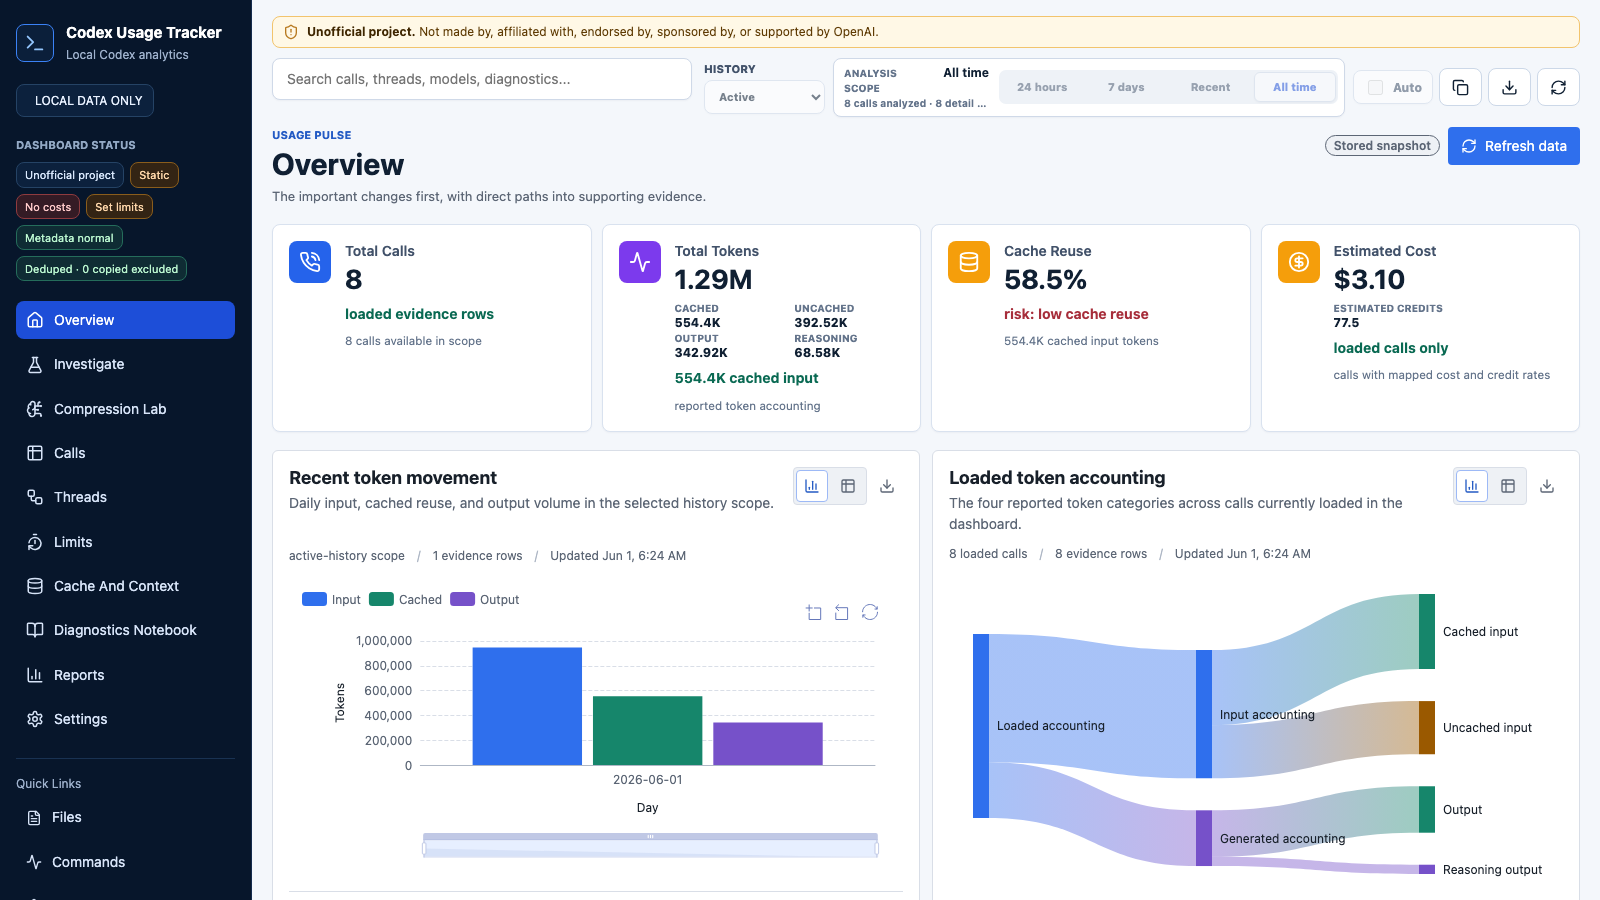
Overview is the dashboard landing workspace: it shows recent aggregate usage, weekly remaining usage context, row loading controls, and charts that open on recent dates.
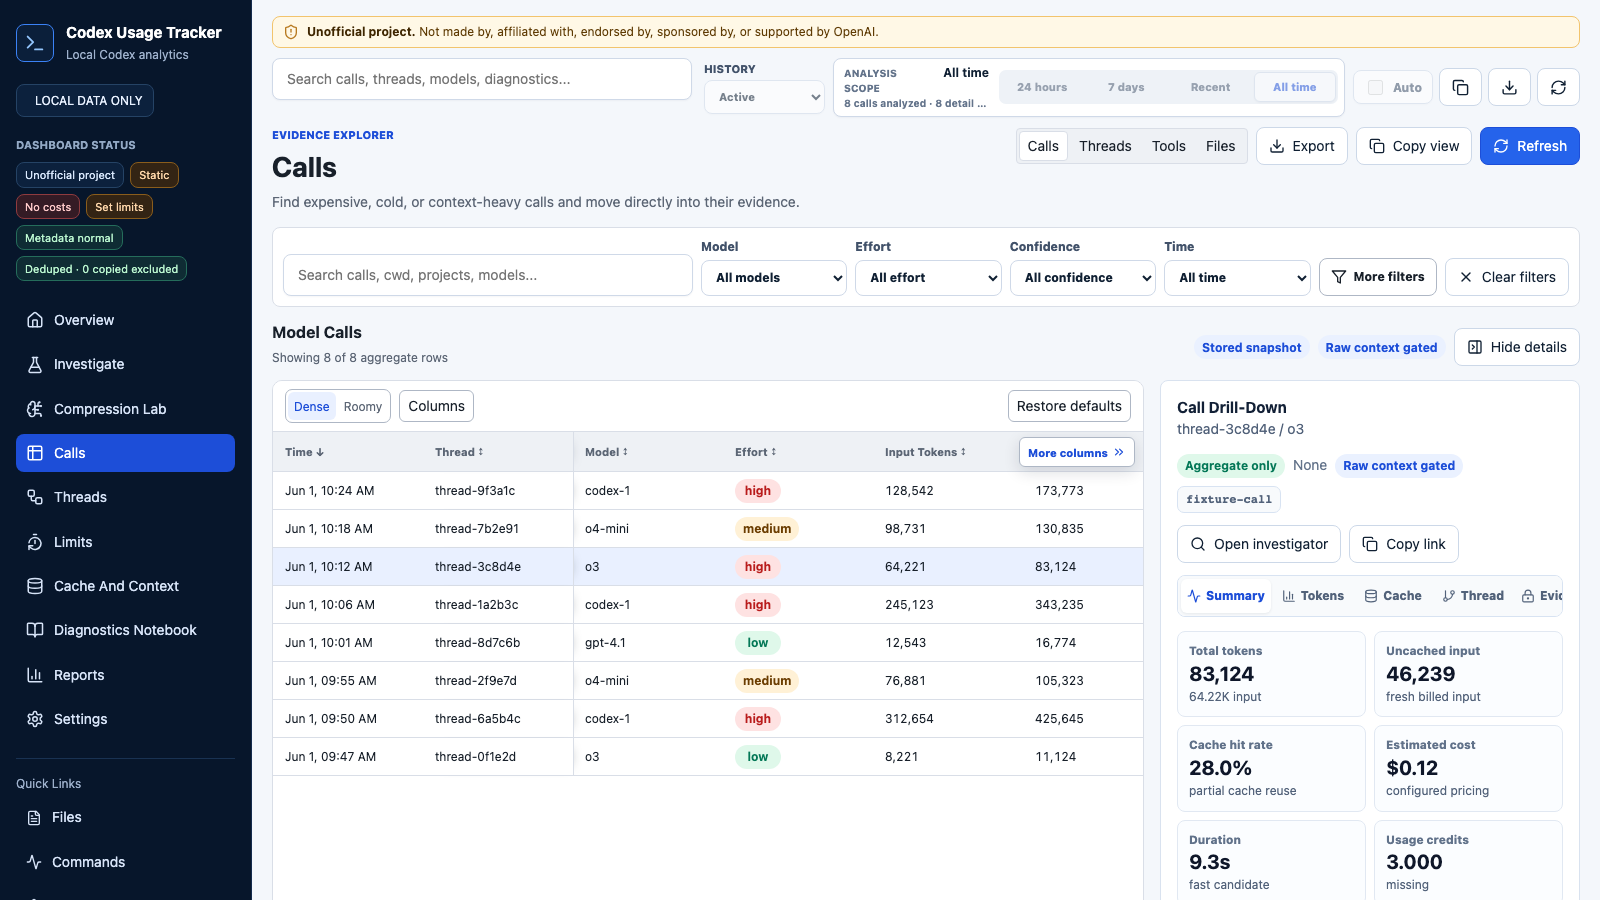
Calls is the high-density investigation surface: filter, sort, inspect details, and export the exact aggregate rows you are looking at.
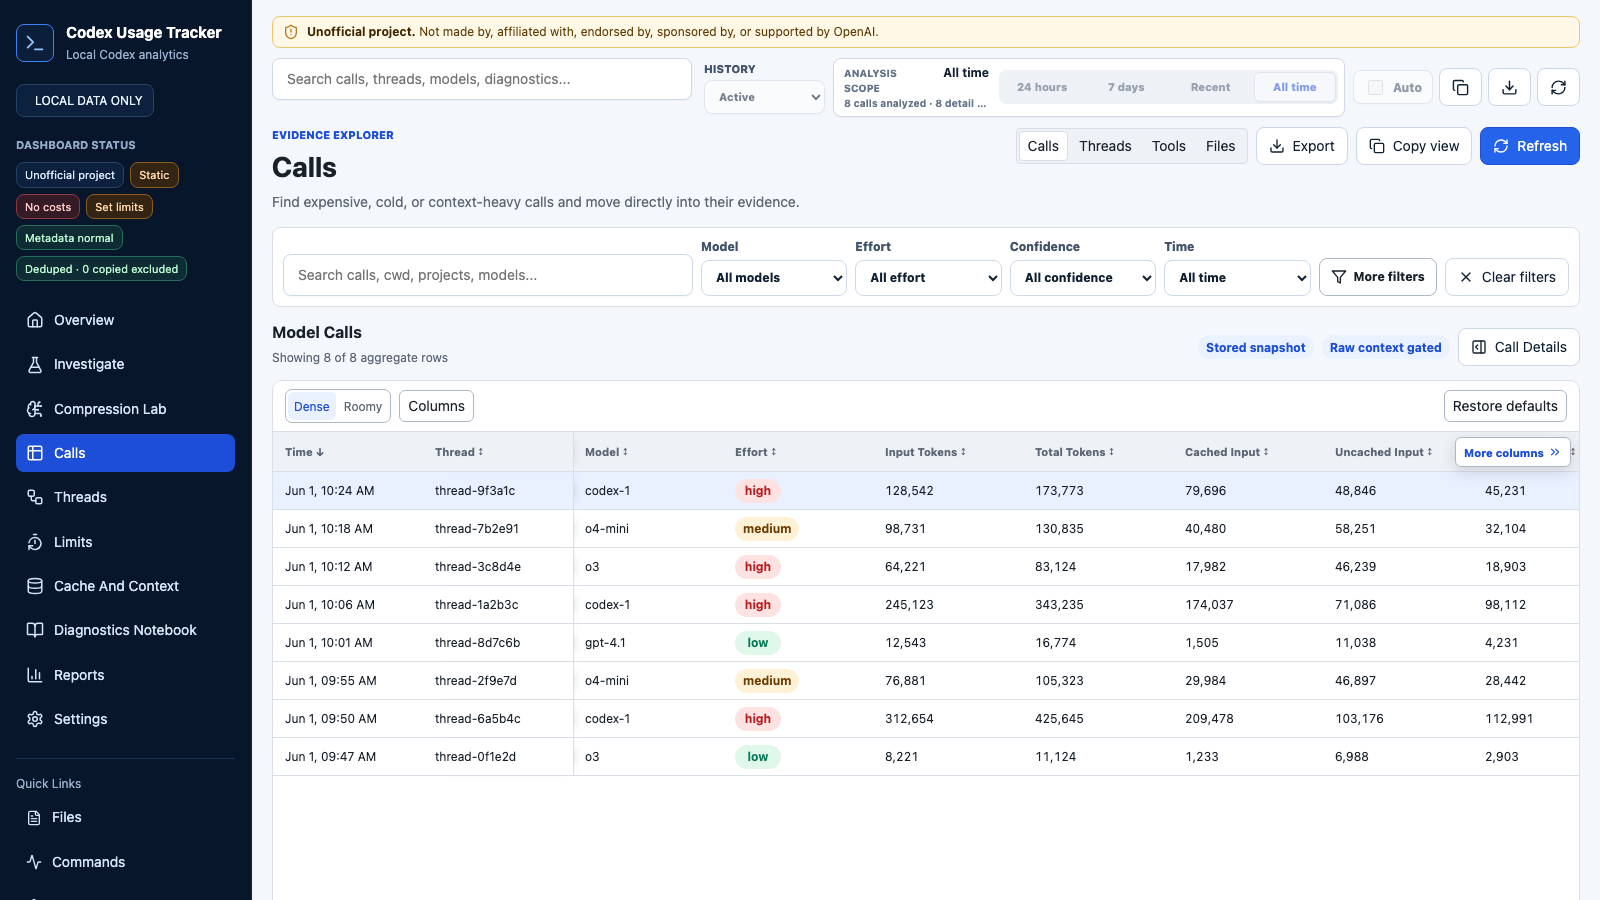
The details rail stays beside the model-call table, so you can inspect aggregate call accounting before opening a full investigator route.
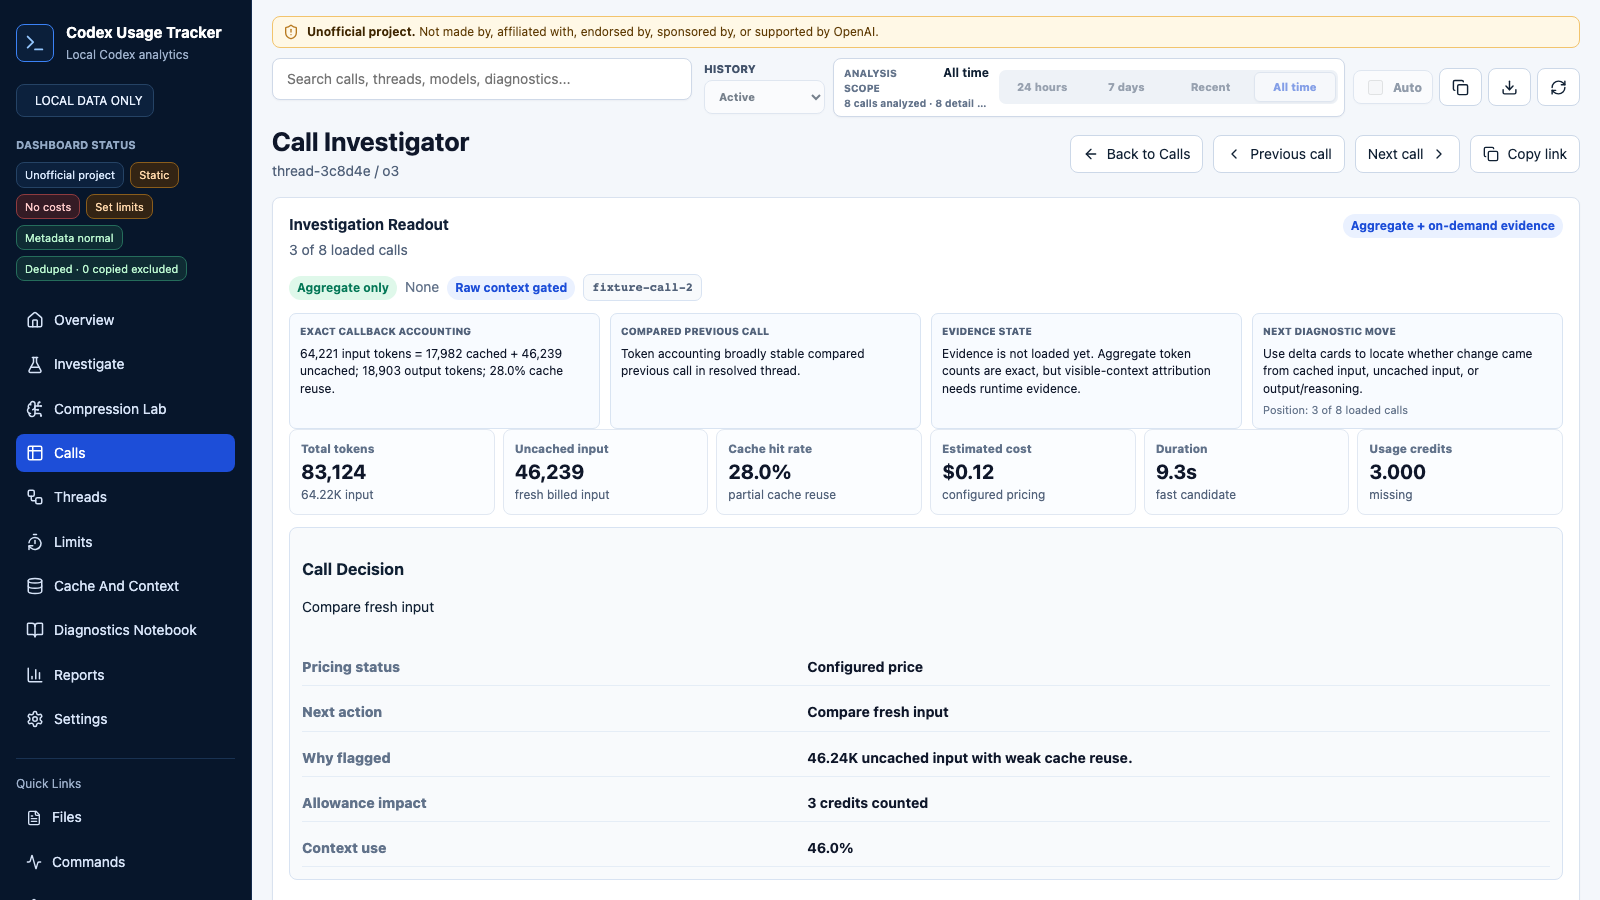
Click a call row to open the dedicated investigator for exact token accounting, cache/accounting deltas, local serialized evidence buckets, and runtime-only evidence controls.
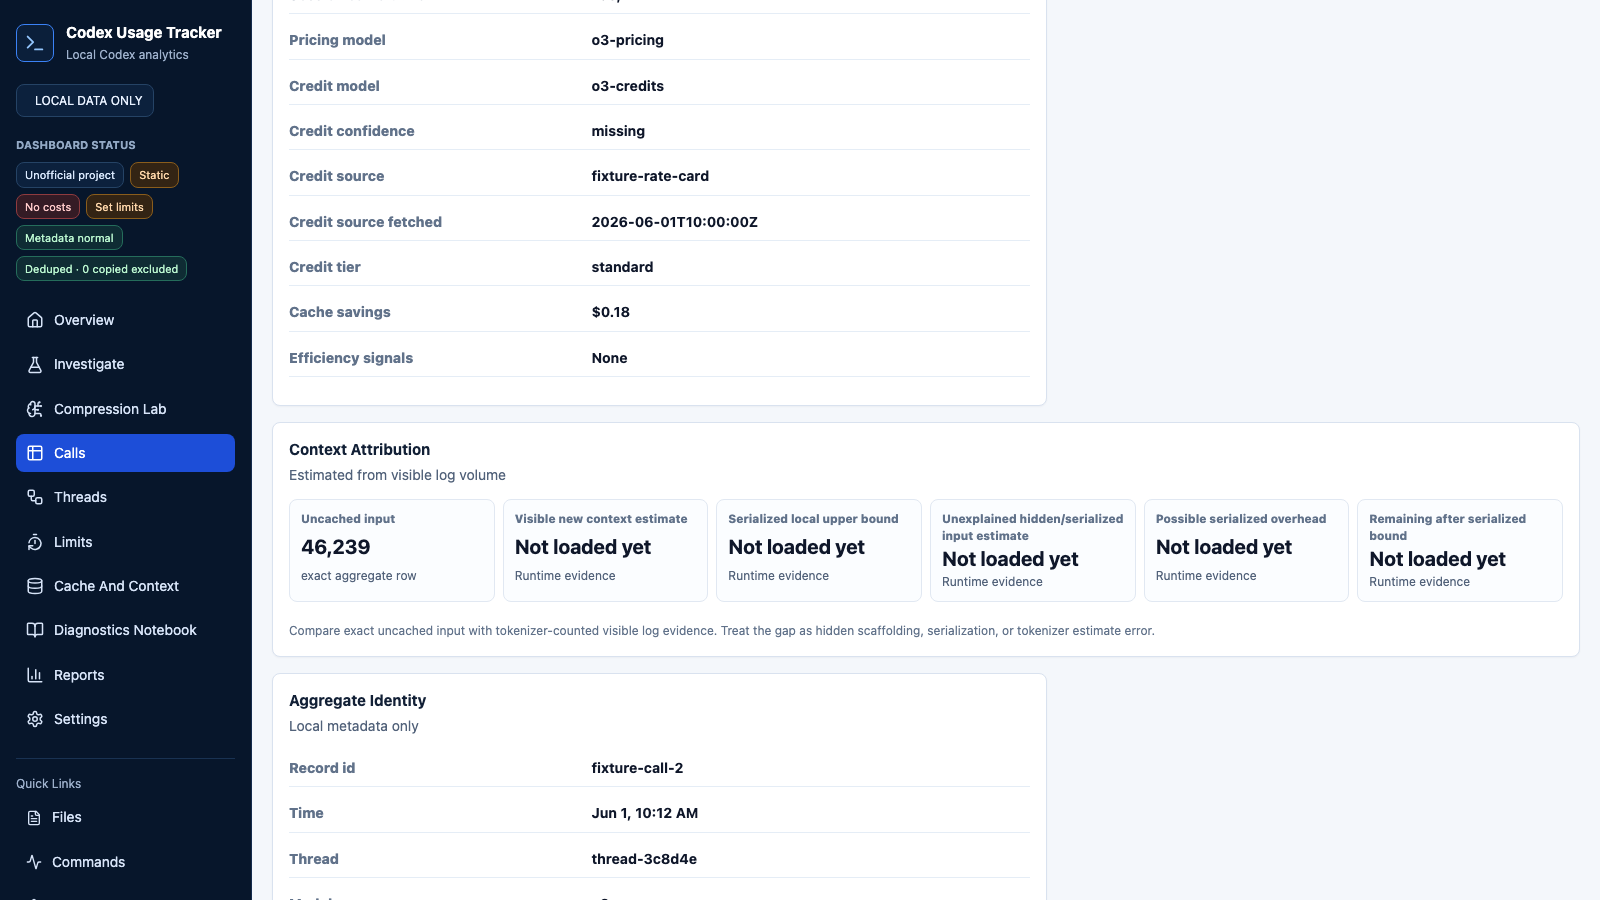
The lower investigator view keeps local JSONL context gated behind explicit localhost actions; raw context is not embedded in generated dashboard HTML.
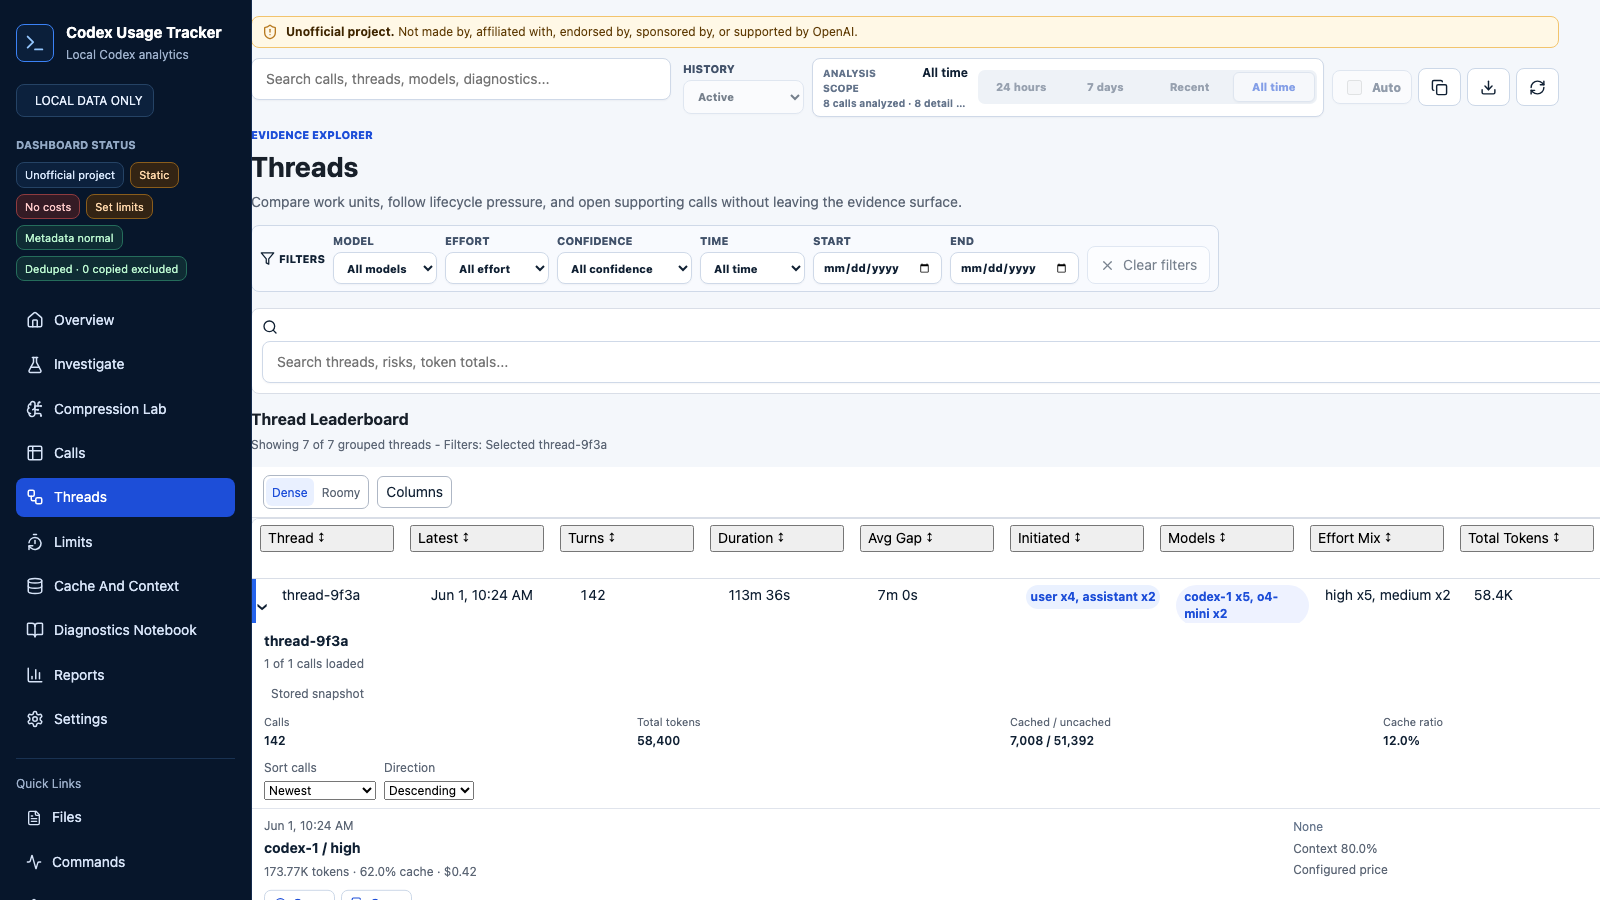
Threads view groups related calls so long chats, subagents, and auto-review passes are easier to reason about as one work session.
Diagnostics Notebook surfaces on-demand snapshot reports for usage drain, tool output, commands, Git interactions, file reads, file modifications, read productivity, and concentration without tying them to the normal live refresh loop.
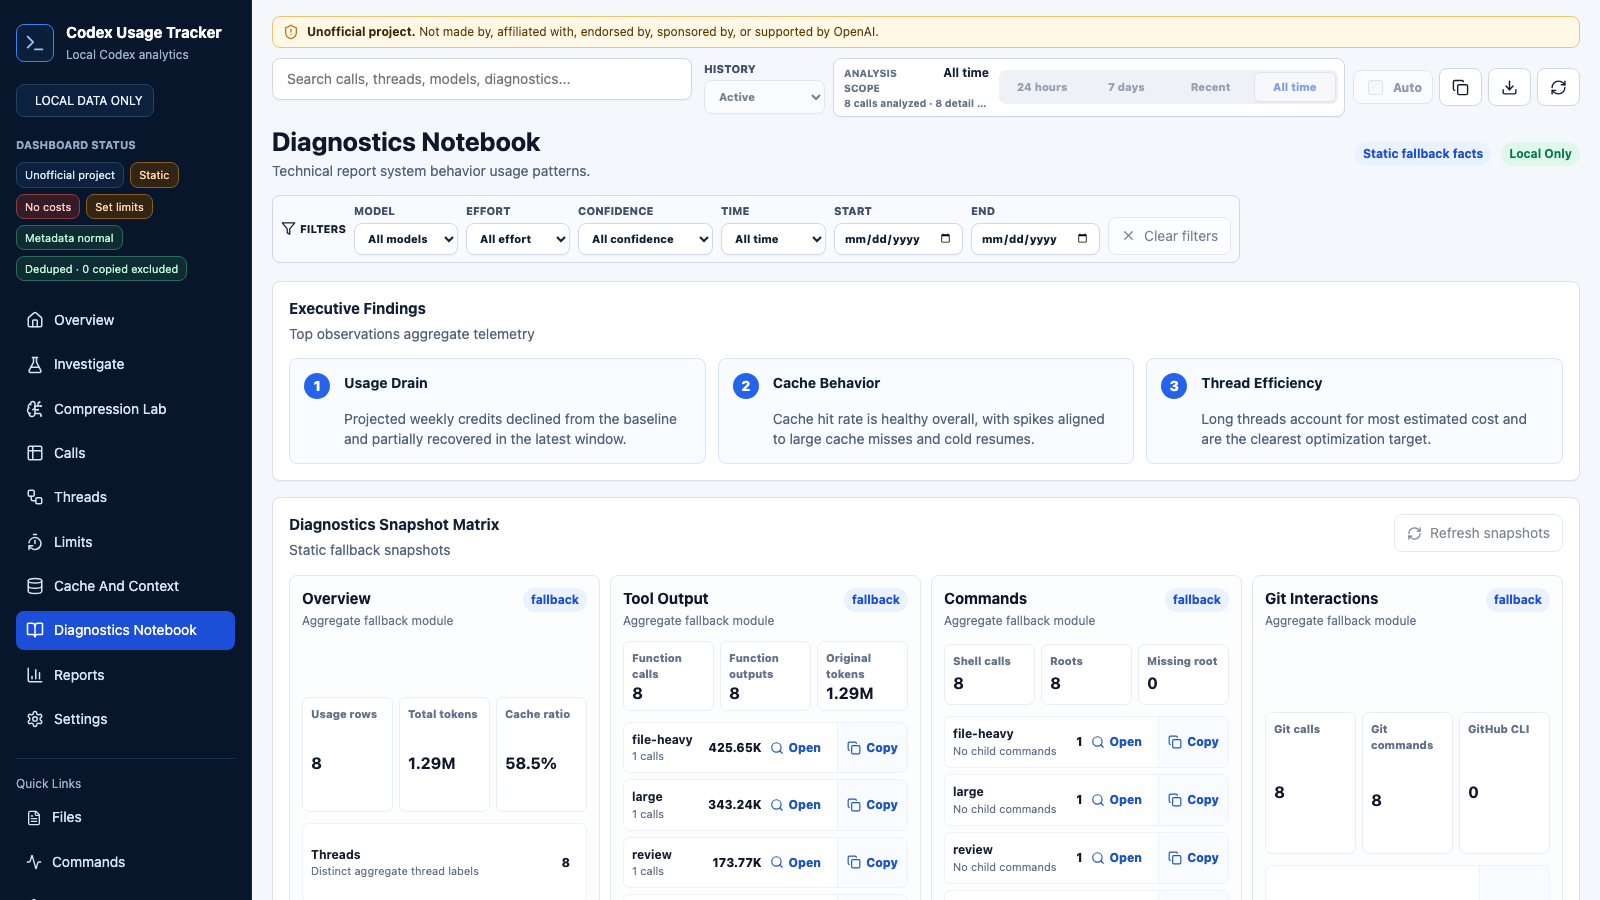
Dashboard screenshots use synthetic aggregate fixture data, and companion prompt/chat previews are synthetic. They do not contain prompts, local logs, assistant responses, real tool output, real thread names, real usage totals, or real Codex session content. See the [Dashboard Guide](docs/dashboard-guide.md) for the full walkthrough.
If this helped you track Codex usage, starring the repo helps others find it. Issues and feature requests are welcome.
## Companion Skill And Plugin
The dashboard is the core product surface. The Codex plugin and companion usage skills let Codex refresh local aggregates, call MCP tools, and explain usage patterns conversationally after plugin discovery. Setup and tool details: [MCP And Codex Skills](docs/mcp.md).


If you only want plugin registration after installing the package:
```bash
codex-usage-tracker install-plugin
```
More install paths: [Install Guide](docs/install.md).
## Platform Support
The core app is not macOS-only. The CLI, SQLite index, dashboard generator, and localhost server are Python-based and CI-tested on Ubuntu for Python 3.10-3.14. The installed-package Docker smoke path uses `python:3.14-slim` by default so packaged resources and CLI entry points are exercised on the newest supported runtime. It defaults to `~/.codex` for local Codex logs and `~/.codex-usage-tracker` for tracker data; pass `--codex-home` or `--db` when your local layout differs. Codex plugin discovery depends on Codex's local plugin directories on your machine, so run `codex-usage-tracker doctor` after setup if plugin registration does not appear in Codex.
## Why This Exists
Codex can quietly burn usage through long-running chats, low cache reuse, reasoning spikes, spawned subagents, and auto-review passes. This tool turns the aggregate counters already on your machine into an insight-first dashboard and scriptable local APIs.
Use it to answer:
- Which threads used the most tokens, estimated cost, or Codex credits?
- Are long chats bloating because of accumulated context?
- Which model or reasoning effort is driving usage?
- Are subagents or auto-review passes adding unexpected cost?
- Which calls have low cache reuse, high context pressure, reasoning spikes, or pricing gaps?
- Which projects, project tags, or active directories are consuming the most usage?
- What should Codex inspect next using the companion usage skill?
## Long Chats Can Bloat Fast
Prompt caching helps, but cached input is not the same as no input. Long threads can accumulate a large cached context, and each new turn may still include cached input plus fresh uncached input, output tokens, reasoning output, and tool-related context.
The dashboard makes that pattern visible with:
- `Cached input`
- `Uncached input`
- `Session cumulative`
- `Context use`
- `Cache ratio`
Practical takeaway: when old context is no longer useful, starting a fresh thread can be more efficient than dragging a large cached history forward. That is not a rule for every task, but it is one of the clearest usage patterns the tracker is designed to reveal.
## First Useful Workflow
```bash
codex-usage-tracker update-pricing
codex-usage-tracker update-rate-card
codex-usage-tracker setup
codex-usage-tracker serve-dashboard --open
```
Then:
1. Leave `Live` enabled while working, or click `Refresh` after a Codex run finishes.
2. Start in `Overview` and scan the high-level metrics and recent calls.
3. Use `Time` presets or calendar fields to focus on today, this week, the last 7 days, this month, or a custom range.
4. Use investigation presets for highest-cost threads, highest-credit calls, context bloat, cache misses, pricing gaps, or estimated-price review.
5. Open `Threads` to see how a conversation grew and whether subagent or auto-review work attached to it.
6. Hover or click rows to inspect aggregate fields in `Call Details`.
7. Use `Show turn log evidence` only when aggregate fields are not enough; context is fetched on demand from the local source JSONL and is not saved into SQLite or the dashboard.
Optional allowance context:
```bash
codex-usage-tracker parse-allowance "5h 79% 6:50 PM Weekly 33% Jun 7"
```
The tracker cannot read your logged-in ChatGPT plan or live remaining usage automatically. When local Codex logs include `token_count.rate_limits`, the dashboard can show the latest observed 5-hour and weekly remaining percentages from those logs. Otherwise, allowance values are only as accurate as the values you manually copy from Codex Settings, `/status`, or another trusted usage display. Details: [Pricing, Credits, And Allowance](docs/pricing-and-credits.md).
## What It Includes
- Local SQLite index at `~/.codex-usage-tracker/usage.sqlite3`.
- Static dashboard generation plus localhost live refresh.
- `Overview`, `Investigate`, `Calls`, `Threads`, `Limits`, and `Diagnostics` dashboard views, including responsive token-flow visualization, evidence-graded weekly allowance analysis, and on-demand usage-drain report runs.
- Active-only dashboards by default, with an explicit `All history` toggle for archived sessions.
- CLI summaries, queries, CSV export, dashboard generation, doctor checks, and support bundles.
- MCP tools for Codex sessions that want to query local usage data.
- Companion Codex skills for operational setup and conversational usage analysis.
- Optional local pricing, Codex credit, allowance, threshold, project alias, and privacy-mode configuration, including per-call long-context pricing above 272K input tokens for OpenAI service tiers that publish long-context rates.
## Dashboard Language
The dashboard supports localized UI text. English is the canonical catalog, and the project includes translated locale catalogs for common dashboard languages.
Set the initial dashboard language with `--lang`:
```bash
codex-usage-tracker --lang vi serve-dashboard --open
```
Or set a default with:
```bash
CODEX_USAGE_TRACKER_LANG=vi codex-usage-tracker serve-dashboard --open
```
The dashboard also includes a language selector. Browser selections are stored locally and can override the generated default for that browser.
Supported dashboard locales include English, Vietnamese, Spanish, French, German, Portuguese, Japanese, Simplified Chinese, Korean, Russian, Italian, and Arabic. Simplified Chinese also localizes CLI help and dashboard lifecycle messages. Localization never rewrites raw Codex log content, thread names, project names, paths, or data exports.
### Adding A Dashboard Language
1. Add a locale JSON file named by language code under `src/codex_usage_tracker/plugin_data/dashboard/locales/`.
2. Include every key from the English catalog.
3. Preserve every placeholder from the English string.
4. Add the language code, native name, English name, and text direction to the supported language metadata.
5. Run the i18n validation tests.
## Common Commands
```bash
codex-usage-tracker summary --preset last-7-days
codex-usage-tracker query --since 2026-06-01 --min-credits 1
codex-usage-tracker session
codex-usage-tracker export --output usage.csv
codex-usage-tracker open-dashboard
codex-usage-tracker support-bundle --output ~/.codex-usage-tracker/support-bundle.json
```
Full command reference: [CLI Reference](docs/cli-reference.md).
## Data Privacy
The tracker stores aggregate metrics only: session ids, timestamps, local source paths, thread labels, cwd/project metadata, model labels, reasoning effort, token counters, pricing/credit annotations, and derived ratios.
It does **not** store prompts, assistant messages, tool output, pasted secrets, raw transcript snippets, or raw context in SQLite, CSV exports, generated dashboard HTML, or synthetic screenshots.
On-demand context loading reads a single original local JSONL file only after an explicit row action, redacts common secret patterns, caps returned text size, and can start off until you enable it from the details panel:
```bash
codex-usage-tracker serve-dashboard --no-context-api --open
```
For shared artifacts, use:
```bash
codex-usage-tracker --privacy-mode redacted dashboard --open
codex-usage-tracker --privacy-mode strict export --output usage-redacted.csv
```
Full model: [Privacy Guide](docs/privacy.md).
## Documentation
- [Install Guide](docs/install.md)
- [Dashboard Guide](docs/dashboard-guide.md)
- [CLI Reference](docs/cli-reference.md)
- [Pricing, Credits, And Allowance](docs/pricing-and-credits.md)
- [Allowance Intelligence](docs/allowance-intelligence.md)
- [MCP And Codex Skills](docs/mcp.md)
- [Privacy Guide](docs/privacy.md)
- [Architecture](docs/architecture.md)
- [CLI And MCP JSON Schemas](docs/cli-json-schemas.md)
- [Usage Drain Modeling](docs/usage-drain-modeling.md)
- [Development And Release](docs/development.md)
## Codex-Assisted Install
Open a Codex session on your machine and paste this:
```text
Install and configure Codex Usage Tracker.
Install the PyPI distribution codex-usage-tracking with pipx. The installed command should be codex-usage-tracker. Use pipx install "git+https://github.com/douglasmonsky/codex-usage-tracker.git" only for branch testing or if PyPI is temporarily unavailable.
If pipx is missing, install it with the platform's Python launcher or use a local virtual environment.
After installation, run codex-usage-tracker setup and serve-dashboard --open.
Verify the dashboard opens locally and tell me the dashboard URL plus whether I need to restart Codex for plugin discovery.
```
This is optional. The normal shell install above is the fastest trusted path for most users.
## Current Limitations
- This is a sidecar dashboard and plugin, not a native Codex chat overlay.
- Codex upstream log formats can change, and parser compatibility may require tracker updates.
- Token counts come from Codex's logged counters; the tracker does not re-tokenize prompts.
- Pricing and rate-card sources can change outside this project.
- Pricing and Codex credit estimates depend on local rate data and confidence labels and are not guaranteed to match exact billing.
- Live account allowance cannot be read automatically by this local tracker; remaining 5-hour and weekly allowance is shown only from local Codex `token_count.rate_limits` snapshots when present, or from copied values you configure.
- Local Codex logs may not include usage from other ChatGPT agentic surfaces that share the same allowance.
- Plugin discovery limitations are separate from core Python CLI/dashboard support.
- Parent-child thread relationships are only as good as the metadata Codex logs; inferred auto-review attachments are labeled as inferred.
## Roadmap
The next phase is adoption hardening: better first-run setup, safer support bundles, clearer guided diagnostics, and scale/reliability checks now that more people are trying the project. See [Adoption Hardening Roadmap](docs/adoption-hardening-roadmap.md) for the branch-by-branch plan.
- Keep Python runtime support validated with CI matrix coverage, package classifiers, release docs, and installed-package smoke tests.
- Improve the `Set limits` flow with a paste/import experience for 5-hour and weekly allowance snapshots.
- Track allowance snapshot history so local Codex credits can be compared against visible remaining-usage changes over time.
- Clarify top-card token accounting by showing output tokens and reasoning output as a subset instead of implying all token cards add together.
- Add more insight presets for cache drift, context growth, subagent-heavy workflows, and pricing/credit confidence gaps.
- Keep the allowance provider boundary ready for an official usage or allowance API if one becomes available.
- Continue reducing setup friction for pipx installs, local plugin discovery, and Codex companion skill usage.
## Development
```bash
git clone https://github.com/douglasmonsky/codex-usage-tracker.git
cd codex-usage-tracker
python3 -m venv .venv
. .venv/bin/activate
python -m pip install --upgrade pip
python -m pip install ".[dev]"
python -m pytest
```
Run the full local CI gate before pushing to `main`. See [Development And Release](docs/development.md).