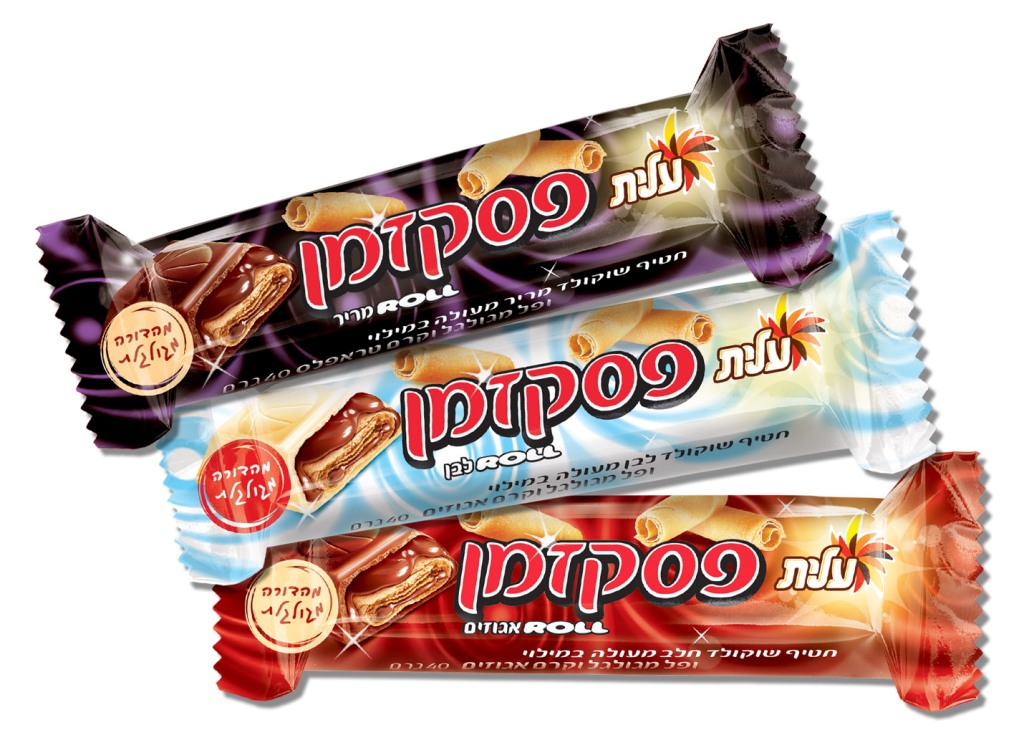
{ "cells": [ { "cell_type": "code", "execution_count": 1, "metadata": {}, "outputs": [ { "data": { "text/html": [ " \n", " " ] }, "metadata": {}, "output_type": "display_data" } ], "source": [ "from functools import reduce\n", "\n", "import pandas as pd\n", "import plotly.graph_objects as go\n", "from plotly import express as px\n", "from plotly.colors import n_colors\n", "from plotly.subplots import make_subplots\n", "from plotly.offline import init_notebook_mode\n", "\n", "init_notebook_mode()\n", "pd.options.plotting.backend = \"plotly\"" ] }, { "cell_type": "markdown", "metadata": {}, "source": [ "This is my attempt on analyzing the data collected by [fivethirtyeight](https://fivethirtyeight.com/) when trying to determine which candy is the best.\n", "You can read more about the data set, how it was collected etc. [here](https://fivethirtyeight.com/videos/the-ultimate-halloween-candy-power-ranking/).\n", "The data itself is available [here](https://github.com/fivethirtyeight/data/blob/master/candy-power-ranking/candy-data.csv) (don't forget to have a look in the [README](https://github.com/fivethirtyeight/data/blob/master/candy-power-ranking/README.md))." ] }, { "cell_type": "code", "execution_count": 2, "metadata": {}, "outputs": [ { "data": { "text/html": [ "
\n", "\n", "\n", " \n", " \n", " \n", " \n", " \n", " \n", " \n", " \n", " \n", " \n", " \n", " \n", " \n", " \n", " \n", " \n", " \n", " \n", " \n", " \n", " \n", " \n", " \n", " \n", " \n", " \n", " \n", " \n", " \n", " \n", " \n", " \n", " \n", " \n", " \n", " \n", " \n", " \n", " \n", " \n", " \n", " \n", " \n", " \n", " \n", " \n", " \n", " \n", " \n", " \n", " \n", " \n", " \n", " \n", " \n", " \n", " \n", " \n", " \n", " \n", " \n", " \n", " \n", " \n", " \n", " \n", " \n", " \n", " \n", " \n", " \n", " \n", " \n", " \n", " \n", " \n", " \n", " \n", " \n", " \n", " \n", " \n", " \n", " \n", " \n", " \n", " \n", " \n", " \n", " \n", " \n", " \n", " \n", " \n", " \n", " \n", " \n", " \n", " \n", " \n", " \n", " \n", " \n", " \n", " \n", " \n", " \n", " \n", " \n", " \n", " \n", " \n", " \n", " \n", " \n", " \n", " \n", " \n", " \n", " \n", " \n", " \n", " \n", " \n", " \n", " \n", " \n", " \n", " \n", " \n", " \n", " \n", " \n", " \n", " \n", " \n", " \n", " \n", " \n", " \n", " \n", " \n", " \n", " \n", " \n", " \n", " \n", " \n", " \n", " \n", " \n", " \n", " \n", " \n", " \n", " \n", " \n", " \n", " \n", " \n", " \n", " \n", " \n", " \n", " \n", " \n", " \n", " \n", " \n", " \n", " \n", " \n", " \n", " \n", " \n", " \n", " \n", " \n", " \n", " \n", " \n", " \n", " \n", " \n", " \n", " \n", " \n", " \n", " \n", " \n", " \n", " \n", " \n", " \n", " \n", " \n", "
competitornamechocolatefruitycaramelpeanutyalmondynougatcrispedricewaferhardbarpluribussugarpercentpricepercentwinpercent
0100 Grand1010010100.7320.86066.971725
13 Musketeers1000100100.6040.51167.602936
2One dime0000000000.0110.11632.261086
3One quarter0000000000.0110.51146.116505
4Air Heads0100000000.9060.51152.341465
..........................................
80Twizzlers0100000000.2200.11645.466282
81Warheads0100001000.0930.11639.011898
82WelchÕs Fruit Snacks0100000010.3130.31344.375519
83WertherÕs Original Caramel0010001000.1860.26741.904308
84Whoppers1000010010.8720.84849.524113
\n", "

85 rows × 13 columns

\n", "
" ], "text/plain": [ " competitorname chocolate fruity caramel peanutyalmondy \\\n", "0 100 Grand 1 0 1 0 \n", "1 3 Musketeers 1 0 0 0 \n", "2 One dime 0 0 0 0 \n", "3 One quarter 0 0 0 0 \n", "4 Air Heads 0 1 0 0 \n", ".. ... ... ... ... ... \n", "80 Twizzlers 0 1 0 0 \n", "81 Warheads 0 1 0 0 \n", "82 WelchÕs Fruit Snacks 0 1 0 0 \n", "83 WertherÕs Original Caramel 0 0 1 0 \n", "84 Whoppers 1 0 0 0 \n", "\n", " nougat crispedricewafer hard bar pluribus sugarpercent pricepercent \\\n", "0 0 1 0 1 0 0.732 0.860 \n", "1 1 0 0 1 0 0.604 0.511 \n", "2 0 0 0 0 0 0.011 0.116 \n", "3 0 0 0 0 0 0.011 0.511 \n", "4 0 0 0 0 0 0.906 0.511 \n", ".. ... ... ... ... ... ... ... \n", "80 0 0 0 0 0 0.220 0.116 \n", "81 0 0 1 0 0 0.093 0.116 \n", "82 0 0 0 0 1 0.313 0.313 \n", "83 0 0 1 0 0 0.186 0.267 \n", "84 0 1 0 0 1 0.872 0.848 \n", "\n", " winpercent \n", "0 66.971725 \n", "1 67.602936 \n", "2 32.261086 \n", "3 46.116505 \n", "4 52.341465 \n", ".. ... \n", "80 45.466282 \n", "81 39.011898 \n", "82 44.375519 \n", "83 41.904308 \n", "84 49.524113 \n", "\n", "[85 rows x 13 columns]" ] }, "execution_count": 2, "metadata": {}, "output_type": "execute_result" } ], "source": [ "# Data taken from a fork of the original data source.\n", "df = pd.read_csv(\n", " \"https://raw.githubusercontent.com/drorata/fivethirtyeight-data/b22a21b264162ad0b5d8954b02e0bca5ab782113/candy-power-ranking/candy-data.csv\"\n", ")\n", "df" ] }, { "cell_type": "code", "execution_count": 3, "metadata": {}, "outputs": [ { "name": "stdout", "output_type": "stream", "text": [ "Are there missing values? False\n" ] } ], "source": [ "print(f\"Are there missing values? {df.isna().any().any()}\")" ] }, { "cell_type": "code", "execution_count": 4, "metadata": {}, "outputs": [], "source": [ "# For easier visualization (later), discretizing the sugarpercent based on its median.\n", "# Another threshold can be decided (e.g if considering health aspect)\n", "df[\"high_sugar\"] = df.sugarpercent.apply(\n", " lambda x: 1 if x > df.sugarpercent.median() else 0\n", ")" ] }, { "cell_type": "markdown", "metadata": {}, "source": [ "## Analysis focus\n", "\n", "The focus of the analysis is to determine what constitutes a winning candy **in terms of winning percentage**.\n", "The analysis is made under the following assumption:\n", "\n", "**Assumption:**\n", "The price of the products is not impacting their winning chances.\n", "\n", "My understanding is that the survey was conducted among people who played the role of the recipients of the candies (during Halloween). \n", "Therefore, their decision when asked about two candies is independent of the price.\n", "Analyzing the price of the items will be discussed after identifying the winning composition of traits.\n", "\n", "**Question:**\n", "\n", "Assume that you want to decide which candy to include in your shop offering.\n", "There are at least two approaches:\n", "1. Pick one or more _existing_ candies and add them to the shop.\n", "2. Develop a new candy that will be used.\n", "\n", "This is an involved *business* decision that require data while being discussed.\n", "\n", "## Candies Traits\n", "\n", "There are 10 different binary traits of each candy.\n", "First, a visualization that look into the median of the win percentage depending on the existence of a trait.\n", "On the right handside, the presence of the trait (as percentage) is visualized to give an indication how trustworthy the change in the win percentage is." ] }, { "cell_type": "markdown", "metadata": {}, "source": [ "## Candies Traits\n", "\n", "There are 10 different binary traits of each candy.\n", "First, a visualization that look into the median of the win percentage depending on the existence of a trait.\n", "\n", "On the right handside, the presence of the trait (as percentage) is visualized to give an indication how trustworthy the change in the win percentage is." ] }, { "cell_type": "code", "execution_count": 5, "metadata": {}, "outputs": [ { "data": { "application/vnd.plotly.v1+json": { "config": { "plotlyServerURL": "https://plot.ly" }, "data": [ { "boxmean": "sd", "fillcolor": "rgba(25, 40, 150, 0.5)", "line": { "color": "rgba(25, 40, 150, 0.5)" }, "showlegend": false, "type": "box", "x": [ 0, 0, 0, 0, 0, 0, 0, 0, 0, 0, 0, 0, 0, 0, 0, 0, 0, 0, 0, 0, 0, 0, 0, 0, 0, 0, 0, 0, 0, 0, 0, 0, 0, 0, 0, 0, 0, 0, 0, 0, 0, 0, 0, 0, 0, 0, 0, 0 ], "xaxis": "x", "y": [ 32.261086, 46.116505, 52.341465, 23.417824, 38.010963, 34.517681, 36.017628, 24.524988, 42.272076, 39.460556, 43.088924, 39.185505, 46.783348, 57.11974, 34.158958, 51.41243, 42.178772, 28.127439, 41.389557, 39.141056, 52.911392, 46.411716, 55.354046, 22.445341, 39.4468, 46.296597, 37.722336, 41.265511, 37.348522, 35.290756, 29.703691, 42.849144, 63.08514, 55.103695, 45.995827, 59.863998, 52.825947, 67.037628, 34.578991, 33.43755, 32.230995, 27.303865, 54.861111, 47.173229, 45.466282, 39.011898, 44.375519, 41.904308 ], "yaxis": "y" }, { "boxmean": "sd", "fillcolor": "rgba(150, 40, 25, 0.5)", "line": { "color": "rgba(150, 40, 25, 0.5)" }, "showlegend": false, "type": "box", "x": [ 1, 1, 1, 1, 1, 1, 1, 1, 1, 1, 1, 1, 1, 1, 1, 1, 1, 1, 1, 1, 1, 1, 1, 1, 1, 1, 1, 1, 1, 1, 1, 1, 1, 1, 1, 1, 1 ], "xaxis": "x", "y": [ 66.971725, 67.602936, 50.347546, 56.914547, 38.975037, 55.375454, 62.284481, 56.490501, 59.236122, 57.21925, 76.7686, 71.46505, 66.574585, 55.064072, 73.099556, 60.800701, 64.35334, 47.829754, 54.526451, 70.735641, 66.47068, 69.483788, 81.866257, 84.18029, 73.43499, 72.887901, 65.716286, 34.722, 37.887188, 76.673782, 59.529251, 48.982651, 43.068897, 45.736748, 49.653503, 81.642914, 49.524113 ], "yaxis": "y" }, { "domain": { "x": [ 0.7, 1 ], "y": [ 0.9450000000000001, 1 ] }, "hovertemplate": "label=%{label}
value=%{value}", "labels": [ 0, 1 ], "legendgroup": "", "name": "", "showlegend": true, "type": "pie", "values": [ 48, 37 ] }, { "boxmean": "sd", "fillcolor": "rgba(25, 40, 150, 0.5)", "line": { "color": "rgba(25, 40, 150, 0.5)" }, "showlegend": false, "type": "box", "x": [ 0, 0, 0, 0, 0, 0, 0, 0, 0, 0, 0, 0, 0, 0, 0, 0, 0, 0, 0, 0, 0, 0, 0, 0, 0, 0, 0, 0, 0, 0, 0, 0, 0, 0, 0, 0, 0, 0, 0, 0, 0, 0, 0, 0, 0, 0, 0 ], "xaxis": "x2", "y": [ 66.971725, 67.602936, 32.261086, 46.116505, 50.347546, 56.914547, 23.417824, 38.010963, 38.975037, 34.158958, 55.375454, 62.284481, 56.490501, 59.236122, 57.21925, 76.7686, 71.46505, 66.574585, 55.064072, 73.099556, 60.800701, 64.35334, 47.829754, 54.526451, 70.735641, 66.47068, 46.296597, 69.483788, 37.722336, 81.866257, 84.18029, 73.43499, 72.887901, 65.716286, 29.703691, 34.722, 37.887188, 76.673782, 59.529251, 33.43755, 32.230995, 43.068897, 45.736748, 49.653503, 81.642914, 41.904308, 49.524113 ], "yaxis": "y2" }, { "boxmean": "sd", "fillcolor": "rgba(150, 40, 25, 0.5)", "line": { "color": "rgba(150, 40, 25, 0.5)" }, "showlegend": false, "type": "box", "x": [ 1, 1, 1, 1, 1, 1, 1, 1, 1, 1, 1, 1, 1, 1, 1, 1, 1, 1, 1, 1, 1, 1, 1, 1, 1, 1, 1, 1, 1, 1, 1, 1, 1, 1, 1, 1, 1, 1 ], "xaxis": "x2", "y": [ 52.341465, 34.517681, 36.017628, 24.524988, 42.272076, 39.460556, 43.088924, 39.185505, 46.783348, 57.11974, 51.41243, 42.178772, 28.127439, 41.389557, 39.141056, 52.911392, 46.411716, 55.354046, 22.445341, 39.4468, 41.265511, 37.348522, 35.290756, 42.849144, 63.08514, 55.103695, 45.995827, 59.863998, 52.825947, 67.037628, 34.578991, 27.303865, 54.861111, 48.982651, 47.173229, 45.466282, 39.011898, 44.375519 ], "yaxis": "y2" }, { "domain": { "x": [ 0.7, 1 ], "y": [ 0.8400000000000001, 0.8950000000000001 ] }, "hovertemplate": "label=%{label}
value=%{value}", "labels": [ 0, 1 ], "legendgroup": "", "name": "", "showlegend": true, "type": "pie", "values": [ 47, 38 ] }, { "boxmean": "sd", "fillcolor": "rgba(25, 40, 150, 0.5)", "line": { "color": "rgba(25, 40, 150, 0.5)" }, "showlegend": false, "type": "box", "x": [ 0, 0, 0, 0, 0, 0, 0, 0, 0, 0, 0, 0, 0, 0, 0, 0, 0, 0, 0, 0, 0, 0, 0, 0, 0, 0, 0, 0, 0, 0, 0, 0, 0, 0, 0, 0, 0, 0, 0, 0, 0, 0, 0, 0, 0, 0, 0, 0, 0, 0, 0, 0, 0, 0, 0, 0, 0, 0, 0, 0, 0, 0, 0, 0, 0, 0, 0, 0, 0, 0, 0 ], "xaxis": "x3", "y": [ 67.602936, 32.261086, 46.116505, 52.341465, 50.347546, 23.417824, 38.010963, 38.975037, 36.017628, 24.524988, 42.272076, 39.460556, 43.088924, 39.185505, 46.783348, 57.11974, 34.158958, 51.41243, 42.178772, 55.375454, 62.284481, 56.490501, 59.236122, 28.127439, 57.21925, 76.7686, 41.389557, 39.141056, 52.911392, 71.46505, 66.574585, 46.411716, 47.829754, 54.526451, 55.354046, 70.735641, 66.47068, 22.445341, 39.4468, 46.296597, 69.483788, 37.722336, 41.265511, 37.348522, 81.866257, 84.18029, 73.43499, 72.887901, 35.290756, 29.703691, 42.849144, 34.722, 63.08514, 55.103695, 37.887188, 45.995827, 59.863998, 52.825947, 67.037628, 34.578991, 27.303865, 54.861111, 48.982651, 43.068897, 45.736748, 49.653503, 47.173229, 45.466282, 39.011898, 44.375519, 49.524113 ], "yaxis": "y3" }, { "boxmean": "sd", "fillcolor": "rgba(150, 40, 25, 0.5)", "line": { "color": "rgba(150, 40, 25, 0.5)" }, "showlegend": false, "type": "box", "x": [ 1, 1, 1, 1, 1, 1, 1, 1, 1, 1, 1, 1, 1, 1 ], "xaxis": "x3", "y": [ 66.971725, 56.914547, 34.517681, 55.064072, 73.099556, 60.800701, 64.35334, 65.716286, 76.673782, 59.529251, 33.43755, 32.230995, 81.642914, 41.904308 ], "yaxis": "y3" }, { "domain": { "x": [ 0.7, 1 ], "y": [ 0.7350000000000001, 0.7900000000000001 ] }, "hovertemplate": "label=%{label}
value=%{value}", "labels": [ 0, 1 ], "legendgroup": "", "name": "", "showlegend": true, "type": "pie", "values": [ 71, 14 ] }, { "boxmean": "sd", "fillcolor": "rgba(25, 40, 150, 0.5)", "line": { "color": "rgba(25, 40, 150, 0.5)" }, "showlegend": false, "type": "box", "x": [ 0, 0, 0, 0, 0, 0, 0, 0, 0, 0, 0, 0, 0, 0, 0, 0, 0, 0, 0, 0, 0, 0, 0, 0, 0, 0, 0, 0, 0, 0, 0, 0, 0, 0, 0, 0, 0, 0, 0, 0, 0, 0, 0, 0, 0, 0, 0, 0, 0, 0, 0, 0, 0, 0, 0, 0, 0, 0, 0, 0, 0, 0, 0, 0, 0, 0, 0, 0, 0, 0, 0 ], "xaxis": "x4", "y": [ 66.971725, 67.602936, 32.261086, 46.116505, 52.341465, 38.010963, 34.517681, 38.975037, 36.017628, 24.524988, 42.272076, 39.460556, 43.088924, 39.185505, 46.783348, 57.11974, 34.158958, 51.41243, 42.178772, 55.375454, 62.284481, 56.490501, 59.236122, 28.127439, 57.21925, 76.7686, 41.389557, 39.141056, 52.911392, 66.574585, 46.411716, 55.064072, 73.099556, 60.800701, 64.35334, 47.829754, 55.354046, 66.47068, 22.445341, 39.4468, 37.722336, 41.265511, 37.348522, 35.290756, 65.716286, 29.703691, 42.849144, 34.722, 63.08514, 55.103695, 37.887188, 45.995827, 59.863998, 52.825947, 67.037628, 34.578991, 33.43755, 32.230995, 27.303865, 54.861111, 48.982651, 43.068897, 45.736748, 49.653503, 47.173229, 81.642914, 45.466282, 39.011898, 44.375519, 41.904308, 49.524113 ], "yaxis": "y4" }, { "boxmean": "sd", "fillcolor": "rgba(150, 40, 25, 0.5)", "line": { "color": "rgba(150, 40, 25, 0.5)" }, "showlegend": false, "type": "box", "x": [ 1, 1, 1, 1, 1, 1, 1, 1, 1, 1, 1, 1, 1, 1 ], "xaxis": "x4", "y": [ 50.347546, 56.914547, 23.417824, 71.46505, 54.526451, 70.735641, 46.296597, 69.483788, 81.866257, 84.18029, 73.43499, 72.887901, 76.673782, 59.529251 ], "yaxis": "y4" }, { "domain": { "x": [ 0.7, 1 ], "y": [ 0.6300000000000001, 0.6850000000000002 ] }, "hovertemplate": "label=%{label}
value=%{value}", "labels": [ 0, 1 ], "legendgroup": "", "name": "", "showlegend": true, "type": "pie", "values": [ 71, 14 ] }, { "boxmean": "sd", "fillcolor": "rgba(25, 40, 150, 0.5)", "line": { "color": "rgba(25, 40, 150, 0.5)" }, "showlegend": false, "type": "box", "x": [ 0, 0, 0, 0, 0, 0, 0, 0, 0, 0, 0, 0, 0, 0, 0, 0, 0, 0, 0, 0, 0, 0, 0, 0, 0, 0, 0, 0, 0, 0, 0, 0, 0, 0, 0, 0, 0, 0, 0, 0, 0, 0, 0, 0, 0, 0, 0, 0, 0, 0, 0, 0, 0, 0, 0, 0, 0, 0, 0, 0, 0, 0, 0, 0, 0, 0, 0, 0, 0, 0, 0, 0, 0, 0, 0, 0, 0, 0 ], "xaxis": "x5", "y": [ 66.971725, 32.261086, 46.116505, 52.341465, 50.347546, 23.417824, 38.010963, 34.517681, 36.017628, 24.524988, 42.272076, 39.460556, 43.088924, 39.185505, 46.783348, 57.11974, 34.158958, 51.41243, 42.178772, 55.375454, 62.284481, 56.490501, 59.236122, 28.127439, 57.21925, 76.7686, 41.389557, 39.141056, 52.911392, 71.46505, 66.574585, 46.411716, 55.064072, 64.35334, 47.829754, 54.526451, 55.354046, 70.735641, 66.47068, 22.445341, 39.4468, 69.483788, 37.722336, 41.265511, 37.348522, 81.866257, 84.18029, 73.43499, 72.887901, 35.290756, 65.716286, 29.703691, 42.849144, 34.722, 63.08514, 55.103695, 37.887188, 45.995827, 59.529251, 59.863998, 52.825947, 67.037628, 34.578991, 33.43755, 32.230995, 27.303865, 54.861111, 48.982651, 43.068897, 45.736748, 49.653503, 47.173229, 81.642914, 45.466282, 39.011898, 44.375519, 41.904308, 49.524113 ], "yaxis": "y5" }, { "boxmean": "sd", "fillcolor": "rgba(150, 40, 25, 0.5)", "line": { "color": "rgba(150, 40, 25, 0.5)" }, "showlegend": false, "type": "box", "x": [ 1, 1, 1, 1, 1, 1, 1 ], "xaxis": "x5", "y": [ 67.602936, 56.914547, 38.975037, 73.099556, 60.800701, 46.296597, 76.673782 ], "yaxis": "y5" }, { "domain": { "x": [ 0.7, 1 ], "y": [ 0.525, 0.5800000000000001 ] }, "hovertemplate": "label=%{label}
value=%{value}", "labels": [ 0, 1 ], "legendgroup": "", "name": "", "showlegend": true, "type": "pie", "values": [ 78, 7 ] }, { "boxmean": "sd", "fillcolor": "rgba(25, 40, 150, 0.5)", "line": { "color": "rgba(25, 40, 150, 0.5)" }, "showlegend": false, "type": "box", "x": [ 0, 0, 0, 0, 0, 0, 0, 0, 0, 0, 0, 0, 0, 0, 0, 0, 0, 0, 0, 0, 0, 0, 0, 0, 0, 0, 0, 0, 0, 0, 0, 0, 0, 0, 0, 0, 0, 0, 0, 0, 0, 0, 0, 0, 0, 0, 0, 0, 0, 0, 0, 0, 0, 0, 0, 0, 0, 0, 0, 0, 0, 0, 0, 0, 0, 0, 0, 0, 0, 0, 0, 0, 0, 0, 0, 0, 0, 0 ], "xaxis": "x6", "y": [ 67.602936, 32.261086, 46.116505, 52.341465, 50.347546, 56.914547, 23.417824, 38.010963, 34.517681, 38.975037, 36.017628, 24.524988, 42.272076, 39.460556, 43.088924, 39.185505, 46.783348, 57.11974, 34.158958, 51.41243, 42.178772, 55.375454, 56.490501, 59.236122, 28.127439, 57.21925, 41.389557, 39.141056, 52.911392, 71.46505, 66.574585, 46.411716, 55.064072, 73.099556, 60.800701, 64.35334, 47.829754, 54.526451, 55.354046, 70.735641, 22.445341, 39.4468, 46.296597, 69.483788, 37.722336, 41.265511, 37.348522, 81.866257, 84.18029, 73.43499, 72.887901, 35.290756, 65.716286, 29.703691, 42.849144, 34.722, 63.08514, 55.103695, 37.887188, 45.995827, 76.673782, 59.863998, 52.825947, 67.037628, 34.578991, 33.43755, 32.230995, 27.303865, 54.861111, 48.982651, 43.068897, 45.736748, 49.653503, 47.173229, 45.466282, 39.011898, 44.375519, 41.904308 ], "yaxis": "y6" }, { "boxmean": "sd", "fillcolor": "rgba(150, 40, 25, 0.5)", "line": { "color": "rgba(150, 40, 25, 0.5)" }, "showlegend": false, "type": "box", "x": [ 1, 1, 1, 1, 1, 1, 1 ], "xaxis": "x6", "y": [ 66.971725, 62.284481, 76.7686, 66.47068, 59.529251, 81.642914, 49.524113 ], "yaxis": "y6" }, { "domain": { "x": [ 0.7, 1 ], "y": [ 0.42000000000000004, 0.47500000000000003 ] }, "hovertemplate": "label=%{label}
value=%{value}", "labels": [ 0, 1 ], "legendgroup": "", "name": "", "showlegend": true, "type": "pie", "values": [ 78, 7 ] }, { "boxmean": "sd", "fillcolor": "rgba(25, 40, 150, 0.5)", "line": { "color": "rgba(25, 40, 150, 0.5)" }, "showlegend": false, "type": "box", "x": [ 0, 0, 0, 0, 0, 0, 0, 0, 0, 0, 0, 0, 0, 0, 0, 0, 0, 0, 0, 0, 0, 0, 0, 0, 0, 0, 0, 0, 0, 0, 0, 0, 0, 0, 0, 0, 0, 0, 0, 0, 0, 0, 0, 0, 0, 0, 0, 0, 0, 0, 0, 0, 0, 0, 0, 0, 0, 0, 0, 0, 0, 0, 0, 0, 0, 0, 0, 0, 0, 0 ], "xaxis": "x7", "y": [ 66.971725, 67.602936, 32.261086, 46.116505, 52.341465, 50.347546, 56.914547, 23.417824, 38.010963, 34.517681, 38.975037, 36.017628, 24.524988, 42.272076, 43.088924, 57.11974, 34.158958, 51.41243, 42.178772, 55.375454, 62.284481, 56.490501, 59.236122, 57.21925, 76.7686, 41.389557, 52.911392, 71.46505, 66.574585, 46.411716, 55.064072, 73.099556, 60.800701, 64.35334, 47.829754, 54.526451, 70.735641, 66.47068, 22.445341, 39.4468, 46.296597, 69.483788, 37.722336, 37.348522, 81.866257, 84.18029, 73.43499, 72.887901, 65.716286, 34.722, 63.08514, 55.103695, 37.887188, 76.673782, 59.529251, 59.863998, 52.825947, 67.037628, 33.43755, 32.230995, 27.303865, 54.861111, 43.068897, 45.736748, 49.653503, 47.173229, 81.642914, 45.466282, 44.375519, 49.524113 ], "yaxis": "y7" }, { "boxmean": "sd", "fillcolor": "rgba(150, 40, 25, 0.5)", "line": { "color": "rgba(150, 40, 25, 0.5)" }, "showlegend": false, "type": "box", "x": [ 1, 1, 1, 1, 1, 1, 1, 1, 1, 1, 1, 1, 1, 1, 1 ], "xaxis": "x7", "y": [ 39.460556, 39.185505, 46.783348, 28.127439, 39.141056, 55.354046, 41.265511, 35.290756, 29.703691, 42.849144, 45.995827, 34.578991, 48.982651, 39.011898, 41.904308 ], "yaxis": "y7" }, { "domain": { "x": [ 0.7, 1 ], "y": [ 0.31500000000000006, 0.37000000000000005 ] }, "hovertemplate": "label=%{label}
value=%{value}", "labels": [ 0, 1 ], "legendgroup": "", "name": "", "showlegend": true, "type": "pie", "values": [ 70, 15 ] }, { "boxmean": "sd", "fillcolor": "rgba(25, 40, 150, 0.5)", "line": { "color": "rgba(25, 40, 150, 0.5)" }, "showlegend": false, "type": "box", "x": [ 0, 0, 0, 0, 0, 0, 0, 0, 0, 0, 0, 0, 0, 0, 0, 0, 0, 0, 0, 0, 0, 0, 0, 0, 0, 0, 0, 0, 0, 0, 0, 0, 0, 0, 0, 0, 0, 0, 0, 0, 0, 0, 0, 0, 0, 0, 0, 0, 0, 0, 0, 0, 0, 0, 0, 0, 0, 0, 0, 0, 0, 0, 0, 0 ], "xaxis": "x8", "y": [ 32.261086, 46.116505, 52.341465, 23.417824, 38.010963, 34.517681, 36.017628, 24.524988, 42.272076, 39.460556, 43.088924, 39.185505, 46.783348, 57.11974, 34.158958, 51.41243, 42.178772, 55.375454, 28.127439, 57.21925, 41.389557, 39.141056, 52.911392, 71.46505, 66.574585, 46.411716, 55.064072, 55.354046, 22.445341, 39.4468, 69.483788, 37.722336, 41.265511, 37.348522, 81.866257, 84.18029, 73.43499, 72.887901, 35.290756, 65.716286, 29.703691, 42.849144, 34.722, 63.08514, 55.103695, 37.887188, 45.995827, 59.863998, 52.825947, 67.037628, 34.578991, 33.43755, 32.230995, 27.303865, 54.861111, 48.982651, 43.068897, 45.736748, 47.173229, 45.466282, 39.011898, 44.375519, 41.904308, 49.524113 ], "yaxis": "y8" }, { "boxmean": "sd", "fillcolor": "rgba(150, 40, 25, 0.5)", "line": { "color": "rgba(150, 40, 25, 0.5)" }, "showlegend": false, "type": "box", "x": [ 1, 1, 1, 1, 1, 1, 1, 1, 1, 1, 1, 1, 1, 1, 1, 1, 1, 1, 1, 1, 1 ], "xaxis": "x8", "y": [ 66.971725, 67.602936, 50.347546, 56.914547, 38.975037, 62.284481, 56.490501, 59.236122, 76.7686, 73.099556, 60.800701, 64.35334, 47.829754, 54.526451, 70.735641, 66.47068, 46.296597, 76.673782, 59.529251, 49.653503, 81.642914 ], "yaxis": "y8" }, { "domain": { "x": [ 0.7, 1 ], "y": [ 0.21000000000000002, 0.265 ] }, "hovertemplate": "label=%{label}
value=%{value}", "labels": [ 0, 1 ], "legendgroup": "", "name": "", "showlegend": true, "type": "pie", "values": [ 64, 21 ] }, { "boxmean": "sd", "fillcolor": "rgba(25, 40, 150, 0.5)", "line": { "color": "rgba(25, 40, 150, 0.5)" }, "showlegend": false, "type": "box", "x": [ 0, 0, 0, 0, 0, 0, 0, 0, 0, 0, 0, 0, 0, 0, 0, 0, 0, 0, 0, 0, 0, 0, 0, 0, 0, 0, 0, 0, 0, 0, 0, 0, 0, 0, 0, 0, 0, 0, 0, 0, 0 ], "xaxis": "x9", "y": [ 66.971725, 67.602936, 32.261086, 46.116505, 52.341465, 50.347546, 56.914547, 34.517681, 38.975037, 39.460556, 39.185505, 62.284481, 56.490501, 59.236122, 76.7686, 41.389557, 39.141056, 52.911392, 73.099556, 60.800701, 64.35334, 47.829754, 54.526451, 70.735641, 66.47068, 46.296597, 81.866257, 84.18029, 72.887901, 35.290756, 76.673782, 59.529251, 32.230995, 27.303865, 48.982651, 43.068897, 49.653503, 81.642914, 45.466282, 39.011898, 41.904308 ], "yaxis": "y9" }, { "boxmean": "sd", "fillcolor": "rgba(150, 40, 25, 0.5)", "line": { "color": "rgba(150, 40, 25, 0.5)" }, "showlegend": false, "type": "box", "x": [ 1, 1, 1, 1, 1, 1, 1, 1, 1, 1, 1, 1, 1, 1, 1, 1, 1, 1, 1, 1, 1, 1, 1, 1, 1, 1, 1, 1, 1, 1, 1, 1, 1, 1, 1, 1, 1, 1, 1, 1, 1, 1, 1, 1 ], "xaxis": "x9", "y": [ 23.417824, 38.010963, 36.017628, 24.524988, 42.272076, 43.088924, 46.783348, 57.11974, 34.158958, 51.41243, 42.178772, 55.375454, 28.127439, 57.21925, 71.46505, 66.574585, 46.411716, 55.064072, 55.354046, 22.445341, 39.4468, 69.483788, 37.722336, 41.265511, 37.348522, 73.43499, 65.716286, 29.703691, 42.849144, 34.722, 63.08514, 55.103695, 37.887188, 45.995827, 59.863998, 52.825947, 67.037628, 34.578991, 33.43755, 54.861111, 45.736748, 47.173229, 44.375519, 49.524113 ], "yaxis": "y9" }, { "domain": { "x": [ 0.7, 1 ], "y": [ 0.10500000000000001, 0.16000000000000003 ] }, "hovertemplate": "label=%{label}
value=%{value}", "labels": [ 1, 0 ], "legendgroup": "", "name": "", "showlegend": true, "type": "pie", "values": [ 44, 41 ] }, { "boxmean": "sd", "fillcolor": "rgba(25, 40, 150, 0.5)", "line": { "color": "rgba(25, 40, 150, 0.5)" }, "showlegend": false, "type": "box", "x": [ 0, 0, 0, 0, 0, 0, 0, 0, 0, 0, 0, 0, 0, 0, 0, 0, 0, 0, 0, 0, 0, 0, 0, 0, 0, 0, 0, 0, 0, 0, 0, 0, 0, 0, 0, 0, 0, 0, 0, 0, 0, 0, 0, 0, 0, 0 ], "xaxis": "x10", "y": [ 32.261086, 46.116505, 50.347546, 23.417824, 24.524988, 43.088924, 57.11974, 34.158958, 51.41243, 42.178772, 55.375454, 62.284481, 56.490501, 59.236122, 28.127439, 57.21925, 76.7686, 41.389557, 39.141056, 52.911392, 55.064072, 47.829754, 54.526451, 66.47068, 22.445341, 39.4468, 46.296597, 37.722336, 81.866257, 73.43499, 34.722, 37.887188, 45.995827, 59.863998, 52.825947, 67.037628, 32.230995, 27.303865, 43.068897, 45.736748, 49.653503, 47.173229, 45.466282, 39.011898, 44.375519, 41.904308 ], "yaxis": "y10" }, { "boxmean": "sd", "fillcolor": "rgba(150, 40, 25, 0.5)", "line": { "color": "rgba(150, 40, 25, 0.5)" }, "showlegend": false, "type": "box", "x": [ 1, 1, 1, 1, 1, 1, 1, 1, 1, 1, 1, 1, 1, 1, 1, 1, 1, 1, 1, 1, 1, 1, 1, 1, 1, 1, 1, 1, 1, 1, 1, 1, 1, 1, 1, 1, 1, 1, 1 ], "xaxis": "x10", "y": [ 66.971725, 67.602936, 52.341465, 56.914547, 38.010963, 34.517681, 38.975037, 36.017628, 42.272076, 39.460556, 39.185505, 46.783348, 71.46505, 66.574585, 46.411716, 73.099556, 60.800701, 64.35334, 55.354046, 70.735641, 69.483788, 41.265511, 37.348522, 84.18029, 72.887901, 35.290756, 65.716286, 29.703691, 42.849144, 63.08514, 55.103695, 76.673782, 59.529251, 34.578991, 33.43755, 54.861111, 48.982651, 81.642914, 49.524113 ], "yaxis": "y10" }, { "domain": { "x": [ 0.7, 1 ], "y": [ 0, 0.05500000000000001 ] }, "hovertemplate": "label=%{label}
value=%{value}", "labels": [ 0, 1 ], "legendgroup": "", "name": "", "showlegend": true, "type": "pie", "values": [ 46, 39 ] } ], "layout": { "annotations": [ { "font": { "size": 16 }, "showarrow": false, "text": "Win % vs. chocolate", "x": 0.3, "xanchor": "center", "xref": "paper", "y": 1, "yanchor": "bottom", "yref": "paper" }, { "font": { "size": 16 }, "showarrow": false, "text": "Presence of chocolate", "x": 0.85, "xanchor": "center", "xref": "paper", "y": 1, "yanchor": "bottom", "yref": "paper" }, { "font": { "size": 16 }, "showarrow": false, "text": "Win % vs. fruity", "x": 0.3, "xanchor": "center", "xref": "paper", "y": 0.8950000000000001, "yanchor": "bottom", "yref": "paper" }, { "font": { "size": 16 }, "showarrow": false, "text": "Presence of fruity", "x": 0.85, "xanchor": "center", "xref": "paper", "y": 0.8950000000000001, "yanchor": "bottom", "yref": "paper" }, { "font": { "size": 16 }, "showarrow": false, "text": "Win % vs. caramel", "x": 0.3, "xanchor": "center", "xref": "paper", "y": 0.7900000000000001, "yanchor": "bottom", "yref": "paper" }, { "font": { "size": 16 }, "showarrow": false, "text": "Presence of caramel", "x": 0.85, "xanchor": "center", "xref": "paper", "y": 0.7900000000000001, "yanchor": "bottom", "yref": "paper" }, { "font": { "size": 16 }, "showarrow": false, "text": "Win % vs. peanutyalmondy", "x": 0.3, "xanchor": "center", "xref": "paper", "y": 0.6850000000000002, "yanchor": "bottom", "yref": "paper" }, { "font": { "size": 16 }, "showarrow": false, "text": "Presence of peanutyalmondy", "x": 0.85, "xanchor": "center", "xref": "paper", "y": 0.6850000000000002, "yanchor": "bottom", "yref": "paper" }, { "font": { "size": 16 }, "showarrow": false, "text": "Win % vs. nougat", "x": 0.3, "xanchor": "center", "xref": "paper", "y": 0.5800000000000001, "yanchor": "bottom", "yref": "paper" }, { "font": { "size": 16 }, "showarrow": false, "text": "Presence of nougat", "x": 0.85, "xanchor": "center", "xref": "paper", "y": 0.5800000000000001, "yanchor": "bottom", "yref": "paper" }, { "font": { "size": 16 }, "showarrow": false, "text": "Win % vs. crispedricewafer", "x": 0.3, "xanchor": "center", "xref": "paper", "y": 0.47500000000000003, "yanchor": "bottom", "yref": "paper" }, { "font": { "size": 16 }, "showarrow": false, "text": "Presence of crispedricewafer", "x": 0.85, "xanchor": "center", "xref": "paper", "y": 0.47500000000000003, "yanchor": "bottom", "yref": "paper" }, { "font": { "size": 16 }, "showarrow": false, "text": "Win % vs. hard", "x": 0.3, "xanchor": "center", "xref": "paper", "y": 0.37000000000000005, "yanchor": "bottom", "yref": "paper" }, { "font": { "size": 16 }, "showarrow": false, "text": "Presence of hard", "x": 0.85, "xanchor": "center", "xref": "paper", "y": 0.37000000000000005, "yanchor": "bottom", "yref": "paper" }, { "font": { "size": 16 }, "showarrow": false, "text": "Win % vs. bar", "x": 0.3, "xanchor": "center", "xref": "paper", "y": 0.265, "yanchor": "bottom", "yref": "paper" }, { "font": { "size": 16 }, "showarrow": false, "text": "Presence of bar", "x": 0.85, "xanchor": "center", "xref": "paper", "y": 0.265, "yanchor": "bottom", "yref": "paper" }, { "font": { "size": 16 }, "showarrow": false, "text": "Win % vs. pluribus", "x": 0.3, "xanchor": "center", "xref": "paper", "y": 0.16000000000000003, "yanchor": "bottom", "yref": "paper" }, { "font": { "size": 16 }, "showarrow": false, "text": "Presence of pluribus", "x": 0.85, "xanchor": "center", "xref": "paper", "y": 0.16000000000000003, "yanchor": "bottom", "yref": "paper" }, { "font": { "size": 16 }, "showarrow": false, "text": "Win % vs. high_sugar", "x": 0.3, "xanchor": "center", "xref": "paper", "y": 0.05500000000000001, "yanchor": "bottom", "yref": "paper" }, { "font": { "size": 16 }, "showarrow": false, "text": "Presence of high_sugar", "x": 0.85, "xanchor": "center", "xref": "paper", "y": 0.05500000000000001, "yanchor": "bottom", "yref": "paper" } ], "height": 2000, "template": { "data": { "bar": [ { "error_x": { "color": "#2a3f5f" }, "error_y": { "color": "#2a3f5f" }, "marker": { "line": { "color": "#E5ECF6", "width": 0.5 }, "pattern": { "fillmode": "overlay", "size": 10, "solidity": 0.2 } }, "type": "bar" } ], "barpolar": [ { "marker": { "line": { "color": "#E5ECF6", "width": 0.5 }, "pattern": { "fillmode": "overlay", "size": 10, "solidity": 0.2 } }, "type": "barpolar" } ], "carpet": [ { "aaxis": { "endlinecolor": "#2a3f5f", "gridcolor": "white", "linecolor": "white", "minorgridcolor": "white", "startlinecolor": "#2a3f5f" }, "baxis": { "endlinecolor": "#2a3f5f", "gridcolor": "white", "linecolor": "white", "minorgridcolor": "white", "startlinecolor": "#2a3f5f" }, "type": "carpet" } ], "choropleth": [ { "colorbar": { "outlinewidth": 0, "ticks": "" }, "type": "choropleth" } ], "contour": [ { "colorbar": { "outlinewidth": 0, "ticks": "" }, "colorscale": [ [ 0, "#0d0887" ], [ 0.1111111111111111, "#46039f" ], [ 0.2222222222222222, "#7201a8" ], [ 0.3333333333333333, "#9c179e" ], [ 0.4444444444444444, "#bd3786" ], [ 0.5555555555555556, "#d8576b" ], [ 0.6666666666666666, "#ed7953" ], [ 0.7777777777777778, "#fb9f3a" ], [ 0.8888888888888888, "#fdca26" ], [ 1, "#f0f921" ] ], "type": "contour" } ], "contourcarpet": [ { "colorbar": { "outlinewidth": 0, "ticks": "" }, "type": "contourcarpet" } ], "heatmap": [ { "colorbar": { "outlinewidth": 0, "ticks": "" }, "colorscale": [ [ 0, "#0d0887" ], [ 0.1111111111111111, "#46039f" ], [ 0.2222222222222222, "#7201a8" ], [ 0.3333333333333333, "#9c179e" ], [ 0.4444444444444444, "#bd3786" ], [ 0.5555555555555556, "#d8576b" ], [ 0.6666666666666666, "#ed7953" ], [ 0.7777777777777778, "#fb9f3a" ], [ 0.8888888888888888, "#fdca26" ], [ 1, "#f0f921" ] ], "type": "heatmap" } ], "heatmapgl": [ { "colorbar": { "outlinewidth": 0, "ticks": "" }, "colorscale": [ [ 0, "#0d0887" ], [ 0.1111111111111111, "#46039f" ], [ 0.2222222222222222, "#7201a8" ], [ 0.3333333333333333, "#9c179e" ], [ 0.4444444444444444, "#bd3786" ], [ 0.5555555555555556, "#d8576b" ], [ 0.6666666666666666, "#ed7953" ], [ 0.7777777777777778, "#fb9f3a" ], [ 0.8888888888888888, "#fdca26" ], [ 1, "#f0f921" ] ], "type": "heatmapgl" } ], "histogram": [ { "marker": { "pattern": { "fillmode": "overlay", "size": 10, "solidity": 0.2 } }, "type": "histogram" } ], "histogram2d": [ { "colorbar": { "outlinewidth": 0, "ticks": "" }, "colorscale": [ [ 0, "#0d0887" ], [ 0.1111111111111111, "#46039f" ], [ 0.2222222222222222, "#7201a8" ], [ 0.3333333333333333, "#9c179e" ], [ 0.4444444444444444, "#bd3786" ], [ 0.5555555555555556, "#d8576b" ], [ 0.6666666666666666, "#ed7953" ], [ 0.7777777777777778, "#fb9f3a" ], [ 0.8888888888888888, "#fdca26" ], [ 1, "#f0f921" ] ], "type": "histogram2d" } ], "histogram2dcontour": [ { "colorbar": { "outlinewidth": 0, "ticks": "" }, "colorscale": [ [ 0, "#0d0887" ], [ 0.1111111111111111, "#46039f" ], [ 0.2222222222222222, "#7201a8" ], [ 0.3333333333333333, "#9c179e" ], [ 0.4444444444444444, "#bd3786" ], [ 0.5555555555555556, "#d8576b" ], [ 0.6666666666666666, "#ed7953" ], [ 0.7777777777777778, "#fb9f3a" ], [ 0.8888888888888888, "#fdca26" ], [ 1, "#f0f921" ] ], "type": "histogram2dcontour" } ], "mesh3d": [ { "colorbar": { "outlinewidth": 0, "ticks": "" }, "type": "mesh3d" } ], "parcoords": [ { "line": { "colorbar": { "outlinewidth": 0, "ticks": "" } }, "type": "parcoords" } ], "pie": [ { "automargin": true, "type": "pie" } ], "scatter": [ { "fillpattern": { "fillmode": "overlay", "size": 10, "solidity": 0.2 }, "type": "scatter" } ], "scatter3d": [ { "line": { "colorbar": { "outlinewidth": 0, "ticks": "" } }, "marker": { "colorbar": { "outlinewidth": 0, "ticks": "" } }, "type": "scatter3d" } ], "scattercarpet": [ { "marker": { "colorbar": { "outlinewidth": 0, "ticks": "" } }, "type": "scattercarpet" } ], "scattergeo": [ { "marker": { "colorbar": { "outlinewidth": 0, "ticks": "" } }, "type": "scattergeo" } ], "scattergl": [ { "marker": { "colorbar": { "outlinewidth": 0, "ticks": "" } }, "type": "scattergl" } ], "scattermapbox": [ { "marker": { "colorbar": { "outlinewidth": 0, "ticks": "" } }, "type": "scattermapbox" } ], "scatterpolar": [ { "marker": { "colorbar": { "outlinewidth": 0, "ticks": "" } }, "type": "scatterpolar" } ], "scatterpolargl": [ { "marker": { "colorbar": { "outlinewidth": 0, "ticks": "" } }, "type": "scatterpolargl" } ], "scatterternary": [ { "marker": { "colorbar": { "outlinewidth": 0, "ticks": "" } }, "type": "scatterternary" } ], "surface": [ { "colorbar": { "outlinewidth": 0, "ticks": "" }, "colorscale": [ [ 0, "#0d0887" ], [ 0.1111111111111111, "#46039f" ], [ 0.2222222222222222, "#7201a8" ], [ 0.3333333333333333, "#9c179e" ], [ 0.4444444444444444, "#bd3786" ], [ 0.5555555555555556, "#d8576b" ], [ 0.6666666666666666, "#ed7953" ], [ 0.7777777777777778, "#fb9f3a" ], [ 0.8888888888888888, "#fdca26" ], [ 1, "#f0f921" ] ], "type": "surface" } ], "table": [ { "cells": { "fill": { "color": "#EBF0F8" }, "line": { "color": "white" } }, "header": { "fill": { "color": "#C8D4E3" }, "line": { "color": "white" } }, "type": "table" } ] }, "layout": { "annotationdefaults": { "arrowcolor": "#2a3f5f", "arrowhead": 0, "arrowwidth": 1 }, "autotypenumbers": "strict", "coloraxis": { "colorbar": { "outlinewidth": 0, "ticks": "" } }, "colorscale": { "diverging": [ [ 0, "#8e0152" ], [ 0.1, "#c51b7d" ], [ 0.2, "#de77ae" ], [ 0.3, "#f1b6da" ], [ 0.4, "#fde0ef" ], [ 0.5, "#f7f7f7" ], [ 0.6, "#e6f5d0" ], [ 0.7, "#b8e186" ], [ 0.8, "#7fbc41" ], [ 0.9, "#4d9221" ], [ 1, "#276419" ] ], "sequential": [ [ 0, "#0d0887" ], [ 0.1111111111111111, "#46039f" ], [ 0.2222222222222222, "#7201a8" ], [ 0.3333333333333333, "#9c179e" ], [ 0.4444444444444444, "#bd3786" ], [ 0.5555555555555556, "#d8576b" ], [ 0.6666666666666666, "#ed7953" ], [ 0.7777777777777778, "#fb9f3a" ], [ 0.8888888888888888, "#fdca26" ], [ 1, "#f0f921" ] ], "sequentialminus": [ [ 0, "#0d0887" ], [ 0.1111111111111111, "#46039f" ], [ 0.2222222222222222, "#7201a8" ], [ 0.3333333333333333, "#9c179e" ], [ 0.4444444444444444, "#bd3786" ], [ 0.5555555555555556, "#d8576b" ], [ 0.6666666666666666, "#ed7953" ], [ 0.7777777777777778, "#fb9f3a" ], [ 0.8888888888888888, "#fdca26" ], [ 1, "#f0f921" ] ] }, "colorway": [ "#636efa", "#EF553B", "#00cc96", "#ab63fa", "#FFA15A", "#19d3f3", "#FF6692", "#B6E880", "#FF97FF", "#FECB52" ], "font": { "color": "#2a3f5f" }, "geo": { "bgcolor": "white", "lakecolor": "white", "landcolor": "#E5ECF6", "showlakes": true, "showland": true, "subunitcolor": "white" }, "hoverlabel": { "align": "left" }, "hovermode": "closest", "mapbox": { "style": "light" }, "paper_bgcolor": "white", "plot_bgcolor": "#E5ECF6", "polar": { "angularaxis": { "gridcolor": "white", "linecolor": "white", "ticks": "" }, "bgcolor": "#E5ECF6", "radialaxis": { "gridcolor": "white", "linecolor": "white", "ticks": "" } }, "scene": { "xaxis": { "backgroundcolor": "#E5ECF6", "gridcolor": "white", "gridwidth": 2, "linecolor": "white", "showbackground": true, "ticks": "", "zerolinecolor": "white" }, "yaxis": { "backgroundcolor": "#E5ECF6", "gridcolor": "white", "gridwidth": 2, "linecolor": "white", "showbackground": true, "ticks": "", "zerolinecolor": "white" }, "zaxis": { "backgroundcolor": "#E5ECF6", "gridcolor": "white", "gridwidth": 2, "linecolor": "white", "showbackground": true, "ticks": "", "zerolinecolor": "white" } }, "shapedefaults": { "line": { "color": "#2a3f5f" } }, "ternary": { "aaxis": { "gridcolor": "white", "linecolor": "white", "ticks": "" }, "baxis": { "gridcolor": "white", "linecolor": "white", "ticks": "" }, "bgcolor": "#E5ECF6", "caxis": { "gridcolor": "white", "linecolor": "white", "ticks": "" } }, "title": { "x": 0.05 }, "xaxis": { "automargin": true, "gridcolor": "white", "linecolor": "white", "ticks": "", "title": { "standoff": 15 }, "zerolinecolor": "white", "zerolinewidth": 2 }, "yaxis": { "automargin": true, "gridcolor": "white", "linecolor": "white", "ticks": "", "title": { "standoff": 15 }, "zerolinecolor": "white", "zerolinewidth": 2 } } }, "title": { "text": "Impact on Win chances" }, "width": 1200, "xaxis": { "anchor": "y", "domain": [ 0, 0.6 ] }, "xaxis10": { "anchor": "y10", "domain": [ 0, 0.6 ] }, "xaxis2": { "anchor": "y2", "domain": [ 0, 0.6 ] }, "xaxis3": { "anchor": "y3", "domain": [ 0, 0.6 ] }, "xaxis4": { "anchor": "y4", "domain": [ 0, 0.6 ] }, "xaxis5": { "anchor": "y5", "domain": [ 0, 0.6 ] }, "xaxis6": { "anchor": "y6", "domain": [ 0, 0.6 ] }, "xaxis7": { "anchor": "y7", "domain": [ 0, 0.6 ] }, "xaxis8": { "anchor": "y8", "domain": [ 0, 0.6 ] }, "xaxis9": { "anchor": "y9", "domain": [ 0, 0.6 ] }, "yaxis": { "anchor": "x", "domain": [ 0.9450000000000001, 1 ] }, "yaxis10": { "anchor": "x10", "domain": [ 0, 0.05500000000000001 ] }, "yaxis2": { "anchor": "x2", "domain": [ 0.8400000000000001, 0.8950000000000001 ] }, "yaxis3": { "anchor": "x3", "domain": [ 0.7350000000000001, 0.7900000000000001 ] }, "yaxis4": { "anchor": "x4", "domain": [ 0.6300000000000001, 0.6850000000000002 ] }, "yaxis5": { "anchor": "x5", "domain": [ 0.525, 0.5800000000000001 ] }, "yaxis6": { "anchor": "x6", "domain": [ 0.42000000000000004, 0.47500000000000003 ] }, "yaxis7": { "anchor": "x7", "domain": [ 0.31500000000000006, 0.37000000000000005 ] }, "yaxis8": { "anchor": "x8", "domain": [ 0.21000000000000002, 0.265 ] }, "yaxis9": { "anchor": "x9", "domain": [ 0.10500000000000001, 0.16000000000000003 ] } } }, "text/html": [ "
" ] }, "metadata": {}, "output_type": "display_data" } ], "source": [ "traits = [\n", " # Picking the manually the traits that are taken into account.\n", " \"chocolate\",\n", " \"fruity\",\n", " \"caramel\",\n", " \"peanutyalmondy\",\n", " \"nougat\",\n", " \"crispedricewafer\",\n", " \"hard\",\n", " \"bar\",\n", " \"pluribus\",\n", " \"high_sugar\",\n", "]\n", "\n", "fig = make_subplots(\n", " rows=len(traits),\n", " cols=2,\n", " column_widths=[4, 2],\n", " specs=10\n", " * [[{\"type\": \"xy\"}, {\"type\": \"pie\"}]], # Supporting mixing of different viz types\n", " subplot_titles=reduce(\n", " # The title of each plot is defined here.\n", " # Needed to flatten a nested list to a single one\n", " lambda x, y: x + y,\n", " [(f\"Win % vs. {trait}\", f\"Presence of {trait}\") for trait in traits],\n", " ),\n", ")\n", "\n", "fill_colors = {0: \"rgba(25, 40, 150, 0.5)\", 1: \"rgba(150, 40, 25, 0.5)\"}\n", "\n", "for i, trait in enumerate(traits):\n", " for is_trait in [0, 1]:\n", " fig.add_trace(\n", " go.Box(\n", " x=df[df[trait] == is_trait][trait],\n", " y=df[df[trait] == is_trait][\"winpercent\"],\n", " boxmean=\"sd\",\n", " showlegend=False,\n", " fillcolor=fill_colors[is_trait],\n", " line={\"color\": fill_colors[is_trait]},\n", " # Some related SO questions:\n", " # - https://stackoverflow.com/q/72110370/671013\n", " # - https://stackoverflow.com/q/72110582/671013\n", " # - https://stackoverflow.com/q/72801725/671013\n", " ),\n", " row=i + 1,\n", " col=1,\n", " )\n", " _vcount = df[trait].value_counts(normalize=False)\n", " fig.add_trace(\n", " px.pie(df, values=_vcount.values, names=_vcount.index).data[0], row=i + 1, col=2\n", " )\n", "fig.update_layout(height=2000, width=1200, title_text=\"Impact on Win chances\")\n", "fig" ] }, { "cell_type": "markdown", "metadata": {}, "source": [ "For easier reading of the numbers, preparing a dataframe holding the important values." ] }, { "cell_type": "code", "execution_count": 6, "metadata": {}, "outputs": [ { "data": { "text/html": [ "
\n", "\n", "\n", " \n", " \n", " \n", " \n", " \n", " \n", " \n", " \n", " \n", " \n", " \n", " \n", " \n", " \n", " \n", " \n", " \n", " \n", " \n", " \n", " \n", " \n", " \n", " \n", " \n", " \n", " \n", " \n", " \n", " \n", " \n", " \n", " \n", " \n", " \n", " \n", " \n", " \n", " \n", " \n", " \n", " \n", " \n", " \n", " \n", " \n", " \n", " \n", " \n", " \n", " \n", " \n", " \n", " \n", " \n", " \n", " \n", " \n", " \n", " \n", " \n", " \n", " \n", " \n", " \n", " \n", " \n", " \n", " \n", " \n", " \n", " \n", " \n", " \n", " \n", " \n", " \n", " \n", " \n", " \n", " \n", " \n", " \n", " \n", " \n", " \n", " \n", " \n", " \n", " \n", " \n", " \n", "
TraitMedian (without)Median (with)Median change (pct)Presence (pct)
8pluribus52.34146545.866287-12.37102851.764706
9high_sugar46.05616654.86111119.11784245.882353
1fruity56.49050142.969034-23.93582444.705882
0chocolate41.64693360.80070145.99082743.529412
7bar43.73222160.80070139.02952824.705882
6hard52.58370639.460556-24.95668517.647059
2caramel46.41171660.16497629.63316416.470588
3peanutyalmondy45.99582770.10971452.42625116.470588
4nougat46.97828860.80070129.4229808.235294
5crispedricewafer46.35415766.47068043.3974538.235294
\n", "
" ], "text/plain": [ " Trait Median (without) Median (with) Median change (pct) \\\n", "8 pluribus 52.341465 45.866287 -12.371028 \n", "9 high_sugar 46.056166 54.861111 19.117842 \n", "1 fruity 56.490501 42.969034 -23.935824 \n", "0 chocolate 41.646933 60.800701 45.990827 \n", "7 bar 43.732221 60.800701 39.029528 \n", "6 hard 52.583706 39.460556 -24.956685 \n", "2 caramel 46.411716 60.164976 29.633164 \n", "3 peanutyalmondy 45.995827 70.109714 52.426251 \n", "4 nougat 46.978288 60.800701 29.422980 \n", "5 crispedricewafer 46.354157 66.470680 43.397453 \n", "\n", " Presence (pct) \n", "8 51.764706 \n", "9 45.882353 \n", "1 44.705882 \n", "0 43.529412 \n", "7 24.705882 \n", "6 17.647059 \n", "2 16.470588 \n", "3 16.470588 \n", "4 8.235294 \n", "5 8.235294 " ] }, "execution_count": 6, "metadata": {}, "output_type": "execute_result" } ], "source": [ "median_impact_df = pd.DataFrame(\n", " [\n", " [\n", " trait,\n", " df[df[trait] == 0][\"winpercent\"].median(),\n", " df[df[trait] == 1][\"winpercent\"].median(),\n", " df[df[trait] == 0].shape[0],\n", " df[df[trait] == 1].shape[0],\n", " ]\n", " for trait in traits\n", " ],\n", " columns=[\"Trait\", \"Median (without)\", \"Median (with)\", \"c_without\", \"c_with\",],\n", ")\n", "\n", "# Compute the change of the median of the win percent when comparing with and without a trait\n", "median_impact_df[\"Median change (pct)\"] = 100 * (\n", " median_impact_df[\"Median (with)\"] / median_impact_df[\"Median (without)\"] - 1\n", ")\n", "\n", "# Computing the presence (pct) of the trait)\n", "median_impact_df[\"Presence (pct)\"] = 100 * median_impact_df[\"c_with\"] / df.shape[0]\n", "median_impact_df.drop([\"c_without\", \"c_with\"], axis=1, inplace=True)\n", "\n", "median_impact_df.sort_values([\"Presence (pct)\"], ascending=False)" ] }, { "cell_type": "markdown", "metadata": {}, "source": [ "**Reading this table:**\n", "> The higher the presence of a trait is, the change in the median of the win percentage should be taken more seriously\n", "\n", "**Recommendations:**\n", "When coming to pick a candy (one or more) following evidences should guide:\n", "\n", "- No pluribus - the win percentage drops by 12%.\n", "- Candy should have high sugar content (a 19% increase in the win percentage)\n", "- Candy should *not* be fruity (a loss of almost 24%)\n", "- Candy should contain chocolate (46% increase)\n", "- A bar candy is favorable (39% increase)\n", "- Soft candies wins more (-25% for the hard ones)\n", "\n", "At this stage, I would be careful with the other traits as their presences drops (below 17% of the candies).\n", "\n", "Next, we can look into the correlation between the different traits:" ] }, { "cell_type": "code", "execution_count": 7, "metadata": {}, "outputs": [ { "data": { "application/vnd.plotly.v1+json": { "config": { "plotlyServerURL": "https://plot.ly" }, "data": [ { "coloraxis": "coloraxis", "hovertemplate": "x: %{x}
y: %{y}
color: %{z}", "name": "0", "type": "heatmap", "x": [ "chocolate", "fruity", "caramel", "peanutyalmondy", "nougat", "crispedricewafer", "hard", "bar", "pluribus", "high_sugar" ], "xaxis": "x", "y": [ "chocolate", "fruity", "caramel", "peanutyalmondy", "nougat", "crispedricewafer", "hard", "bar", "pluribus", "high_sugar" ], "yaxis": "y", "z": [ [ 1, -0.7417210588438837, 0.2498753473199239, 0.3778235673331377, 0.2548918323914012, 0.341209783599645, -0.34417690721160166, 0.5974211396032368, -0.33967519386975675, 0.09635976825096065 ], [ -0.7417210588438837, 1, -0.3354853836360149, -0.39928014338782974, -0.26936712313631034, -0.26936712313631034, 0.39067750473670737, -0.5150655814471485, 0.2997252159581437, 0.02681570941167356 ], [ 0.2498753473199239, -0.3354853836360149, 1, 0.05935613682092555, 0.3284927980493561, 0.2131130962551607, -0.12235512675491643, 0.3339600197875761, -0.26958501190685263, 0.2913031559605784 ], [ 0.3778235673331377, -0.39928014338782974, 0.05935613682092555, 1, 0.21311309625516078, -0.01764630733322987, -0.20555661294825955, 0.26041960092243627, -0.20610931658252452, 0.10034607428976217 ], [ 0.2548918323914012, -0.26936712313631034, 0.3284927980493561, 0.21311309625516078, 1, -0.08974358974358972, -0.13867504905630734, 0.5229763603684903, -0.3103388371943955, 0.23946431574188062 ], [ 0.341209783599645, -0.26936712313631034, 0.2131130962551607, -0.01764630733322987, -0.08974358974358972, 1, -0.13867504905630731, 0.4237509348521478, -0.22469337887776036, 0.06769666310002533 ], [ -0.34417690721160166, 0.39067750473670737, -0.12235512675491643, -0.20555661294825955, -0.13867504905630734, -0.13867504905630731, 1, -0.2651650429449552, 0.014531721951587856, 0.19308120700302187 ], [ 0.5974211396032368, -0.5150655814471485, 0.3339600197875761, 0.26041960092243627, 0.5229763603684903, 0.4237509348521478, -0.2651650429449552, 1, -0.5934089200049686, 0.07470456401800164 ], [ -0.33967519386975675, 0.2997252159581437, -0.26958501190685263, -0.20610931658252452, -0.3103388371943955, -0.22469337887776036, 0.014531721951587856, -0.5934089200049686, 1, -0.00889386425647441 ], [ 0.09635976825096065, 0.02681570941167356, 0.2913031559605784, 0.10034607428976217, 0.23946431574188062, 0.06769666310002533, 0.19308120700302187, 0.07470456401800164, -0.00889386425647441, 1 ] ] } ], "layout": { "coloraxis": { "colorscale": [ [ 0, "rgb(103,0,31)" ], [ 0.1, "rgb(178,24,43)" ], [ 0.2, "rgb(214,96,77)" ], [ 0.3, "rgb(244,165,130)" ], [ 0.4, "rgb(253,219,199)" ], [ 0.5, "rgb(247,247,247)" ], [ 0.6, "rgb(209,229,240)" ], [ 0.7, "rgb(146,197,222)" ], [ 0.8, "rgb(67,147,195)" ], [ 0.9, "rgb(33,102,172)" ], [ 1, "rgb(5,48,97)" ] ] }, "margin": { "t": 60 }, "template": { "data": { "bar": [ { "error_x": { "color": "#2a3f5f" }, "error_y": { "color": "#2a3f5f" }, "marker": { "line": { "color": "#E5ECF6", "width": 0.5 }, "pattern": { "fillmode": "overlay", "size": 10, "solidity": 0.2 } }, "type": "bar" } ], "barpolar": [ { "marker": { "line": { "color": "#E5ECF6", "width": 0.5 }, "pattern": { "fillmode": "overlay", "size": 10, "solidity": 0.2 } }, "type": "barpolar" } ], "carpet": [ { "aaxis": { "endlinecolor": "#2a3f5f", "gridcolor": "white", "linecolor": "white", "minorgridcolor": "white", "startlinecolor": "#2a3f5f" }, "baxis": { "endlinecolor": "#2a3f5f", "gridcolor": "white", "linecolor": "white", "minorgridcolor": "white", "startlinecolor": "#2a3f5f" }, "type": "carpet" } ], "choropleth": [ { "colorbar": { "outlinewidth": 0, "ticks": "" }, "type": "choropleth" } ], "contour": [ { "colorbar": { "outlinewidth": 0, "ticks": "" }, "colorscale": [ [ 0, "#0d0887" ], [ 0.1111111111111111, "#46039f" ], [ 0.2222222222222222, "#7201a8" ], [ 0.3333333333333333, "#9c179e" ], [ 0.4444444444444444, "#bd3786" ], [ 0.5555555555555556, "#d8576b" ], [ 0.6666666666666666, "#ed7953" ], [ 0.7777777777777778, "#fb9f3a" ], [ 0.8888888888888888, "#fdca26" ], [ 1, "#f0f921" ] ], "type": "contour" } ], "contourcarpet": [ { "colorbar": { "outlinewidth": 0, "ticks": "" }, "type": "contourcarpet" } ], "heatmap": [ { "colorbar": { "outlinewidth": 0, "ticks": "" }, "colorscale": [ [ 0, "#0d0887" ], [ 0.1111111111111111, "#46039f" ], [ 0.2222222222222222, "#7201a8" ], [ 0.3333333333333333, "#9c179e" ], [ 0.4444444444444444, "#bd3786" ], [ 0.5555555555555556, "#d8576b" ], [ 0.6666666666666666, "#ed7953" ], [ 0.7777777777777778, "#fb9f3a" ], [ 0.8888888888888888, "#fdca26" ], [ 1, "#f0f921" ] ], "type": "heatmap" } ], "heatmapgl": [ { "colorbar": { "outlinewidth": 0, "ticks": "" }, "colorscale": [ [ 0, "#0d0887" ], [ 0.1111111111111111, "#46039f" ], [ 0.2222222222222222, "#7201a8" ], [ 0.3333333333333333, "#9c179e" ], [ 0.4444444444444444, "#bd3786" ], [ 0.5555555555555556, "#d8576b" ], [ 0.6666666666666666, "#ed7953" ], [ 0.7777777777777778, "#fb9f3a" ], [ 0.8888888888888888, "#fdca26" ], [ 1, "#f0f921" ] ], "type": "heatmapgl" } ], "histogram": [ { "marker": { "pattern": { "fillmode": "overlay", "size": 10, "solidity": 0.2 } }, "type": "histogram" } ], "histogram2d": [ { "colorbar": { "outlinewidth": 0, "ticks": "" }, "colorscale": [ [ 0, "#0d0887" ], [ 0.1111111111111111, "#46039f" ], [ 0.2222222222222222, "#7201a8" ], [ 0.3333333333333333, "#9c179e" ], [ 0.4444444444444444, "#bd3786" ], [ 0.5555555555555556, "#d8576b" ], [ 0.6666666666666666, "#ed7953" ], [ 0.7777777777777778, "#fb9f3a" ], [ 0.8888888888888888, "#fdca26" ], [ 1, "#f0f921" ] ], "type": "histogram2d" } ], "histogram2dcontour": [ { "colorbar": { "outlinewidth": 0, "ticks": "" }, "colorscale": [ [ 0, "#0d0887" ], [ 0.1111111111111111, "#46039f" ], [ 0.2222222222222222, "#7201a8" ], [ 0.3333333333333333, "#9c179e" ], [ 0.4444444444444444, "#bd3786" ], [ 0.5555555555555556, "#d8576b" ], [ 0.6666666666666666, "#ed7953" ], [ 0.7777777777777778, "#fb9f3a" ], [ 0.8888888888888888, "#fdca26" ], [ 1, "#f0f921" ] ], "type": "histogram2dcontour" } ], "mesh3d": [ { "colorbar": { "outlinewidth": 0, "ticks": "" }, "type": "mesh3d" } ], "parcoords": [ { "line": { "colorbar": { "outlinewidth": 0, "ticks": "" } }, "type": "parcoords" } ], "pie": [ { "automargin": true, "type": "pie" } ], "scatter": [ { "fillpattern": { "fillmode": "overlay", "size": 10, "solidity": 0.2 }, "type": "scatter" } ], "scatter3d": [ { "line": { "colorbar": { "outlinewidth": 0, "ticks": "" } }, "marker": { "colorbar": { "outlinewidth": 0, "ticks": "" } }, "type": "scatter3d" } ], "scattercarpet": [ { "marker": { "colorbar": { "outlinewidth": 0, "ticks": "" } }, "type": "scattercarpet" } ], "scattergeo": [ { "marker": { "colorbar": { "outlinewidth": 0, "ticks": "" } }, "type": "scattergeo" } ], "scattergl": [ { "marker": { "colorbar": { "outlinewidth": 0, "ticks": "" } }, "type": "scattergl" } ], "scattermapbox": [ { "marker": { "colorbar": { "outlinewidth": 0, "ticks": "" } }, "type": "scattermapbox" } ], "scatterpolar": [ { "marker": { "colorbar": { "outlinewidth": 0, "ticks": "" } }, "type": "scatterpolar" } ], "scatterpolargl": [ { "marker": { "colorbar": { "outlinewidth": 0, "ticks": "" } }, "type": "scatterpolargl" } ], "scatterternary": [ { "marker": { "colorbar": { "outlinewidth": 0, "ticks": "" } }, "type": "scatterternary" } ], "surface": [ { "colorbar": { "outlinewidth": 0, "ticks": "" }, "colorscale": [ [ 0, "#0d0887" ], [ 0.1111111111111111, "#46039f" ], [ 0.2222222222222222, "#7201a8" ], [ 0.3333333333333333, "#9c179e" ], [ 0.4444444444444444, "#bd3786" ], [ 0.5555555555555556, "#d8576b" ], [ 0.6666666666666666, "#ed7953" ], [ 0.7777777777777778, "#fb9f3a" ], [ 0.8888888888888888, "#fdca26" ], [ 1, "#f0f921" ] ], "type": "surface" } ], "table": [ { "cells": { "fill": { "color": "#EBF0F8" }, "line": { "color": "white" } }, "header": { "fill": { "color": "#C8D4E3" }, "line": { "color": "white" } }, "type": "table" } ] }, "layout": { "annotationdefaults": { "arrowcolor": "#2a3f5f", "arrowhead": 0, "arrowwidth": 1 }, "autotypenumbers": "strict", "coloraxis": { "colorbar": { "outlinewidth": 0, "ticks": "" } }, "colorscale": { "diverging": [ [ 0, "#8e0152" ], [ 0.1, "#c51b7d" ], [ 0.2, "#de77ae" ], [ 0.3, "#f1b6da" ], [ 0.4, "#fde0ef" ], [ 0.5, "#f7f7f7" ], [ 0.6, "#e6f5d0" ], [ 0.7, "#b8e186" ], [ 0.8, "#7fbc41" ], [ 0.9, "#4d9221" ], [ 1, "#276419" ] ], "sequential": [ [ 0, "#0d0887" ], [ 0.1111111111111111, "#46039f" ], [ 0.2222222222222222, "#7201a8" ], [ 0.3333333333333333, "#9c179e" ], [ 0.4444444444444444, "#bd3786" ], [ 0.5555555555555556, "#d8576b" ], [ 0.6666666666666666, "#ed7953" ], [ 0.7777777777777778, "#fb9f3a" ], [ 0.8888888888888888, "#fdca26" ], [ 1, "#f0f921" ] ], "sequentialminus": [ [ 0, "#0d0887" ], [ 0.1111111111111111, "#46039f" ], [ 0.2222222222222222, "#7201a8" ], [ 0.3333333333333333, "#9c179e" ], [ 0.4444444444444444, "#bd3786" ], [ 0.5555555555555556, "#d8576b" ], [ 0.6666666666666666, "#ed7953" ], [ 0.7777777777777778, "#fb9f3a" ], [ 0.8888888888888888, "#fdca26" ], [ 1, "#f0f921" ] ] }, "colorway": [ "#636efa", "#EF553B", "#00cc96", "#ab63fa", "#FFA15A", "#19d3f3", "#FF6692", "#B6E880", "#FF97FF", "#FECB52" ], "font": { "color": "#2a3f5f" }, "geo": { "bgcolor": "white", "lakecolor": "white", "landcolor": "#E5ECF6", "showlakes": true, "showland": true, "subunitcolor": "white" }, "hoverlabel": { "align": "left" }, "hovermode": "closest", "mapbox": { "style": "light" }, "paper_bgcolor": "white", "plot_bgcolor": "#E5ECF6", "polar": { "angularaxis": { "gridcolor": "white", "linecolor": "white", "ticks": "" }, "bgcolor": "#E5ECF6", "radialaxis": { "gridcolor": "white", "linecolor": "white", "ticks": "" } }, "scene": { "xaxis": { "backgroundcolor": "#E5ECF6", "gridcolor": "white", "gridwidth": 2, "linecolor": "white", "showbackground": true, "ticks": "", "zerolinecolor": "white" }, "yaxis": { "backgroundcolor": "#E5ECF6", "gridcolor": "white", "gridwidth": 2, "linecolor": "white", "showbackground": true, "ticks": "", "zerolinecolor": "white" }, "zaxis": { "backgroundcolor": "#E5ECF6", "gridcolor": "white", "gridwidth": 2, "linecolor": "white", "showbackground": true, "ticks": "", "zerolinecolor": "white" } }, "shapedefaults": { "line": { "color": "#2a3f5f" } }, "ternary": { "aaxis": { "gridcolor": "white", "linecolor": "white", "ticks": "" }, "baxis": { "gridcolor": "white", "linecolor": "white", "ticks": "" }, "bgcolor": "#E5ECF6", "caxis": { "gridcolor": "white", "linecolor": "white", "ticks": "" } }, "title": { "x": 0.05 }, "xaxis": { "automargin": true, "gridcolor": "white", "linecolor": "white", "ticks": "", "title": { "standoff": 15 }, "zerolinecolor": "white", "zerolinewidth": 2 }, "yaxis": { "automargin": true, "gridcolor": "white", "linecolor": "white", "ticks": "", "title": { "standoff": 15 }, "zerolinecolor": "white", "zerolinewidth": 2 } } }, "xaxis": { "anchor": "y", "constrain": "domain", "domain": [ 0, 1 ], "scaleanchor": "y" }, "yaxis": { "anchor": "x", "autorange": "reversed", "constrain": "domain", "domain": [ 0, 1 ] } } }, "text/html": [ "
" ] }, "metadata": {}, "output_type": "display_data" } ], "source": [ "corr_df = df.drop(\n", " [\"competitorname\", \"pricepercent\", \"winpercent\", \"sugarpercent\"], axis=1\n", ").corr()\n", "fig = px.imshow(corr_df, color_continuous_scale=\"RdBu\")\n", "fig.show()" ] }, { "cell_type": "markdown", "metadata": {}, "source": [ "From the above matrix, one can conclude that a *bar* snack is a good candidate as it is meeting many of the guidings mentioned above.\n", "\n", "Here is a good candidate (my favorite childhood's candy):\n", "\n", "\n", "\n", "Although these are newer version that weren't available back in the days 😇." ] }, { "cell_type": "markdown", "metadata": {}, "source": [ "## The Price\n", "\n", "Finally, a few points regarding the price of the products.\n", "When looking at the overall price distribution there is no clear story:" ] }, { "cell_type": "code", "execution_count": 8, "metadata": {}, "outputs": [ { "data": { "application/vnd.plotly.v1+json": { "config": { "plotlyServerURL": "https://plot.ly" }, "data": [ { "alignmentgroup": "True", "box": { "visible": false }, "hovertemplate": "pricepercent=%{x}", "legendgroup": "", "marker": { "color": "#636efa" }, "name": "", "offsetgroup": "", "orientation": "h", "scalegroup": "True", "showlegend": false, "type": "violin", "x": [ 0.86000001, 0.51099998, 0.116, 0.51099998, 0.51099998, 0.76700002, 0.76700002, 0.51099998, 0.32499999, 0.32499999, 0.51099998, 0.51099998, 0.32499999, 0.51099998, 0.034000002, 0.034000002, 0.32499999, 0.45300001, 0.465, 0.465, 0.465, 0.465, 0.093000002, 0.91799998, 0.91799998, 0.91799998, 0.51099998, 0.51099998, 0.51099998, 0.116, 0.104, 0.27900001, 0.65100002, 0.65100002, 0.32499999, 0.51099998, 0.65100002, 0.44100001, 0.86000001, 0.86000001, 0.91799998, 0.32499999, 0.76700002, 0.76700002, 0.97600001, 0.32499999, 0.76700002, 0.65100002, 0.023, 0.83700001, 0.116, 0.27900001, 0.65100002, 0.65100002, 0.65100002, 0.96499997, 0.86000001, 0.068999998, 0.27900001, 0.081, 0.22, 0.22, 0.97600001, 0.116, 0.65100002, 0.65100002, 0.116, 0.116, 0.22, 0.057999998, 0.76700002, 0.32499999, 0.116, 0.755, 0.32499999, 0.51099998, 0.011, 0.32499999, 0.255, 0.90600002, 0.116, 0.116, 0.31299999, 0.26699999, 0.84799999 ], "x0": " ", "xaxis": "x", "y0": " ", "yaxis": "y" } ], "layout": { "legend": { "tracegroupgap": 0 }, "margin": { "t": 60 }, "template": { "data": { "bar": [ { "error_x": { "color": "#2a3f5f" }, "error_y": { "color": "#2a3f5f" }, "marker": { "line": { "color": "#E5ECF6", "width": 0.5 }, "pattern": { "fillmode": "overlay", "size": 10, "solidity": 0.2 } }, "type": "bar" } ], "barpolar": [ { "marker": { "line": { "color": "#E5ECF6", "width": 0.5 }, "pattern": { "fillmode": "overlay", "size": 10, "solidity": 0.2 } }, "type": "barpolar" } ], "carpet": [ { "aaxis": { "endlinecolor": "#2a3f5f", "gridcolor": "white", "linecolor": "white", "minorgridcolor": "white", "startlinecolor": "#2a3f5f" }, "baxis": { "endlinecolor": "#2a3f5f", "gridcolor": "white", "linecolor": "white", "minorgridcolor": "white", "startlinecolor": "#2a3f5f" }, "type": "carpet" } ], "choropleth": [ { "colorbar": { "outlinewidth": 0, "ticks": "" }, "type": "choropleth" } ], "contour": [ { "colorbar": { "outlinewidth": 0, "ticks": "" }, "colorscale": [ [ 0, "#0d0887" ], [ 0.1111111111111111, "#46039f" ], [ 0.2222222222222222, "#7201a8" ], [ 0.3333333333333333, "#9c179e" ], [ 0.4444444444444444, "#bd3786" ], [ 0.5555555555555556, "#d8576b" ], [ 0.6666666666666666, "#ed7953" ], [ 0.7777777777777778, "#fb9f3a" ], [ 0.8888888888888888, "#fdca26" ], [ 1, "#f0f921" ] ], "type": "contour" } ], "contourcarpet": [ { "colorbar": { "outlinewidth": 0, "ticks": "" }, "type": "contourcarpet" } ], "heatmap": [ { "colorbar": { "outlinewidth": 0, "ticks": "" }, "colorscale": [ [ 0, "#0d0887" ], [ 0.1111111111111111, "#46039f" ], [ 0.2222222222222222, "#7201a8" ], [ 0.3333333333333333, "#9c179e" ], [ 0.4444444444444444, "#bd3786" ], [ 0.5555555555555556, "#d8576b" ], [ 0.6666666666666666, "#ed7953" ], [ 0.7777777777777778, "#fb9f3a" ], [ 0.8888888888888888, "#fdca26" ], [ 1, "#f0f921" ] ], "type": "heatmap" } ], "heatmapgl": [ { "colorbar": { "outlinewidth": 0, "ticks": "" }, "colorscale": [ [ 0, "#0d0887" ], [ 0.1111111111111111, "#46039f" ], [ 0.2222222222222222, "#7201a8" ], [ 0.3333333333333333, "#9c179e" ], [ 0.4444444444444444, "#bd3786" ], [ 0.5555555555555556, "#d8576b" ], [ 0.6666666666666666, "#ed7953" ], [ 0.7777777777777778, "#fb9f3a" ], [ 0.8888888888888888, "#fdca26" ], [ 1, "#f0f921" ] ], "type": "heatmapgl" } ], "histogram": [ { "marker": { "pattern": { "fillmode": "overlay", "size": 10, "solidity": 0.2 } }, "type": "histogram" } ], "histogram2d": [ { "colorbar": { "outlinewidth": 0, "ticks": "" }, "colorscale": [ [ 0, "#0d0887" ], [ 0.1111111111111111, "#46039f" ], [ 0.2222222222222222, "#7201a8" ], [ 0.3333333333333333, "#9c179e" ], [ 0.4444444444444444, "#bd3786" ], [ 0.5555555555555556, "#d8576b" ], [ 0.6666666666666666, "#ed7953" ], [ 0.7777777777777778, "#fb9f3a" ], [ 0.8888888888888888, "#fdca26" ], [ 1, "#f0f921" ] ], "type": "histogram2d" } ], "histogram2dcontour": [ { "colorbar": { "outlinewidth": 0, "ticks": "" }, "colorscale": [ [ 0, "#0d0887" ], [ 0.1111111111111111, "#46039f" ], [ 0.2222222222222222, "#7201a8" ], [ 0.3333333333333333, "#9c179e" ], [ 0.4444444444444444, "#bd3786" ], [ 0.5555555555555556, "#d8576b" ], [ 0.6666666666666666, "#ed7953" ], [ 0.7777777777777778, "#fb9f3a" ], [ 0.8888888888888888, "#fdca26" ], [ 1, "#f0f921" ] ], "type": "histogram2dcontour" } ], "mesh3d": [ { "colorbar": { "outlinewidth": 0, "ticks": "" }, "type": "mesh3d" } ], "parcoords": [ { "line": { "colorbar": { "outlinewidth": 0, "ticks": "" } }, "type": "parcoords" } ], "pie": [ { "automargin": true, "type": "pie" } ], "scatter": [ { "fillpattern": { "fillmode": "overlay", "size": 10, "solidity": 0.2 }, "type": "scatter" } ], "scatter3d": [ { "line": { "colorbar": { "outlinewidth": 0, "ticks": "" } }, "marker": { "colorbar": { "outlinewidth": 0, "ticks": "" } }, "type": "scatter3d" } ], "scattercarpet": [ { "marker": { "colorbar": { "outlinewidth": 0, "ticks": "" } }, "type": "scattercarpet" } ], "scattergeo": [ { "marker": { "colorbar": { "outlinewidth": 0, "ticks": "" } }, "type": "scattergeo" } ], "scattergl": [ { "marker": { "colorbar": { "outlinewidth": 0, "ticks": "" } }, "type": "scattergl" } ], "scattermapbox": [ { "marker": { "colorbar": { "outlinewidth": 0, "ticks": "" } }, "type": "scattermapbox" } ], "scatterpolar": [ { "marker": { "colorbar": { "outlinewidth": 0, "ticks": "" } }, "type": "scatterpolar" } ], "scatterpolargl": [ { "marker": { "colorbar": { "outlinewidth": 0, "ticks": "" } }, "type": "scatterpolargl" } ], "scatterternary": [ { "marker": { "colorbar": { "outlinewidth": 0, "ticks": "" } }, "type": "scatterternary" } ], "surface": [ { "colorbar": { "outlinewidth": 0, "ticks": "" }, "colorscale": [ [ 0, "#0d0887" ], [ 0.1111111111111111, "#46039f" ], [ 0.2222222222222222, "#7201a8" ], [ 0.3333333333333333, "#9c179e" ], [ 0.4444444444444444, "#bd3786" ], [ 0.5555555555555556, "#d8576b" ], [ 0.6666666666666666, "#ed7953" ], [ 0.7777777777777778, "#fb9f3a" ], [ 0.8888888888888888, "#fdca26" ], [ 1, "#f0f921" ] ], "type": "surface" } ], "table": [ { "cells": { "fill": { "color": "#EBF0F8" }, "line": { "color": "white" } }, "header": { "fill": { "color": "#C8D4E3" }, "line": { "color": "white" } }, "type": "table" } ] }, "layout": { "annotationdefaults": { "arrowcolor": "#2a3f5f", "arrowhead": 0, "arrowwidth": 1 }, "autotypenumbers": "strict", "coloraxis": { "colorbar": { "outlinewidth": 0, "ticks": "" } }, "colorscale": { "diverging": [ [ 0, "#8e0152" ], [ 0.1, "#c51b7d" ], [ 0.2, "#de77ae" ], [ 0.3, "#f1b6da" ], [ 0.4, "#fde0ef" ], [ 0.5, "#f7f7f7" ], [ 0.6, "#e6f5d0" ], [ 0.7, "#b8e186" ], [ 0.8, "#7fbc41" ], [ 0.9, "#4d9221" ], [ 1, "#276419" ] ], "sequential": [ [ 0, "#0d0887" ], [ 0.1111111111111111, "#46039f" ], [ 0.2222222222222222, "#7201a8" ], [ 0.3333333333333333, "#9c179e" ], [ 0.4444444444444444, "#bd3786" ], [ 0.5555555555555556, "#d8576b" ], [ 0.6666666666666666, "#ed7953" ], [ 0.7777777777777778, "#fb9f3a" ], [ 0.8888888888888888, "#fdca26" ], [ 1, "#f0f921" ] ], "sequentialminus": [ [ 0, "#0d0887" ], [ 0.1111111111111111, "#46039f" ], [ 0.2222222222222222, "#7201a8" ], [ 0.3333333333333333, "#9c179e" ], [ 0.4444444444444444, "#bd3786" ], [ 0.5555555555555556, "#d8576b" ], [ 0.6666666666666666, "#ed7953" ], [ 0.7777777777777778, "#fb9f3a" ], [ 0.8888888888888888, "#fdca26" ], [ 1, "#f0f921" ] ] }, "colorway": [ "#636efa", "#EF553B", "#00cc96", "#ab63fa", "#FFA15A", "#19d3f3", "#FF6692", "#B6E880", "#FF97FF", "#FECB52" ], "font": { "color": "#2a3f5f" }, "geo": { "bgcolor": "white", "lakecolor": "white", "landcolor": "#E5ECF6", "showlakes": true, "showland": true, "subunitcolor": "white" }, "hoverlabel": { "align": "left" }, "hovermode": "closest", "mapbox": { "style": "light" }, "paper_bgcolor": "white", "plot_bgcolor": "#E5ECF6", "polar": { "angularaxis": { "gridcolor": "white", "linecolor": "white", "ticks": "" }, "bgcolor": "#E5ECF6", "radialaxis": { "gridcolor": "white", "linecolor": "white", "ticks": "" } }, "scene": { "xaxis": { "backgroundcolor": "#E5ECF6", "gridcolor": "white", "gridwidth": 2, "linecolor": "white", "showbackground": true, "ticks": "", "zerolinecolor": "white" }, "yaxis": { "backgroundcolor": "#E5ECF6", "gridcolor": "white", "gridwidth": 2, "linecolor": "white", "showbackground": true, "ticks": "", "zerolinecolor": "white" }, "zaxis": { "backgroundcolor": "#E5ECF6", "gridcolor": "white", "gridwidth": 2, "linecolor": "white", "showbackground": true, "ticks": "", "zerolinecolor": "white" } }, "shapedefaults": { "line": { "color": "#2a3f5f" } }, "ternary": { "aaxis": { "gridcolor": "white", "linecolor": "white", "ticks": "" }, "baxis": { "gridcolor": "white", "linecolor": "white", "ticks": "" }, "bgcolor": "#E5ECF6", "caxis": { "gridcolor": "white", "linecolor": "white", "ticks": "" } }, "title": { "x": 0.05 }, "xaxis": { "automargin": true, "gridcolor": "white", "linecolor": "white", "ticks": "", "title": { "standoff": 15 }, "zerolinecolor": "white", "zerolinewidth": 2 }, "yaxis": { "automargin": true, "gridcolor": "white", "linecolor": "white", "ticks": "", "title": { "standoff": 15 }, "zerolinecolor": "white", "zerolinewidth": 2 } } }, "violinmode": "group", "xaxis": { "anchor": "y", "domain": [ 0, 1 ], "title": { "text": "pricepercent" } }, "yaxis": { "anchor": "x", "domain": [ 0, 1 ] } } }, "text/html": [ "
" ] }, "metadata": {}, "output_type": "display_data" } ], "source": [ "# Compare to the behavior of the price when not drilled down by traits\n", "px.violin(df, x=\"pricepercent\")" ] }, { "cell_type": "markdown", "metadata": {}, "source": [ "However, by looking at the prices per trait, we see that different traits correspond to different price ranges.\n", "This view can help when discussing the business plan and taking into account the prices of the items." ] }, { "cell_type": "code", "execution_count": 9, "metadata": {}, "outputs": [ { "data": { "application/vnd.plotly.v1+json": { "config": { "plotlyServerURL": "https://plot.ly" }, "data": [ { "line": { "color": "rgb(5.0, 200.0, 200.0)" }, "name": "hard", "orientation": "h", "points": "suspectedoutliers", "side": "positive", "type": "violin", "width": 3, "x": [ 0.034000002, 0.32499999, 0.45300001, 0.51099998, 0.104, 0.32499999, 0.83700001, 0.96499997, 0.068999998, 0.27900001, 0.116, 0.057999998, 0.32499999, 0.116, 0.26699999 ] }, { "line": { "color": "rgb(26.666666666666668, 178.88888888888889, 178.88888888888889)" }, "name": "fruity", "orientation": "h", "points": "suspectedoutliers", "side": "positive", "type": "violin", "width": 3, "x": [ 0.51099998, 0.32499999, 0.51099998, 0.32499999, 0.51099998, 0.034000002, 0.034000002, 0.32499999, 0.45300001, 0.465, 0.465, 0.465, 0.51099998, 0.116, 0.104, 0.27900001, 0.32499999, 0.32499999, 0.97600001, 0.32499999, 0.83700001, 0.116, 0.96499997, 0.27900001, 0.22, 0.22, 0.116, 0.116, 0.116, 0.22, 0.057999998, 0.116, 0.755, 0.32499999, 0.255, 0.116, 0.116, 0.31299999 ] }, { "line": { "color": "rgb(48.333333333333336, 157.77777777777777, 157.77777777777777)" }, "name": "pluribus", "orientation": "h", "points": "suspectedoutliers", "side": "positive", "type": "violin", "width": 3, "x": [ 0.51099998, 0.32499999, 0.51099998, 0.32499999, 0.51099998, 0.034000002, 0.45300001, 0.465, 0.465, 0.465, 0.465, 0.093000002, 0.51099998, 0.51099998, 0.65100002, 0.65100002, 0.32499999, 0.51099998, 0.32499999, 0.97600001, 0.32499999, 0.65100002, 0.023, 0.83700001, 0.116, 0.65100002, 0.86000001, 0.068999998, 0.27900001, 0.081, 0.22, 0.22, 0.97600001, 0.116, 0.116, 0.116, 0.22, 0.057999998, 0.76700002, 0.755, 0.011, 0.255, 0.31299999, 0.84799999 ] }, { "line": { "color": "rgb(70.0, 136.66666666666669, 136.66666666666669)" }, "name": "high_sugar", "orientation": "h", "points": "suspectedoutliers", "side": "positive", "type": "violin", "width": 3, "x": [ 0.86000001, 0.51099998, 0.51099998, 0.76700002, 0.32499999, 0.32499999, 0.51099998, 0.51099998, 0.51099998, 0.034000002, 0.32499999, 0.45300001, 0.65100002, 0.65100002, 0.32499999, 0.65100002, 0.44100001, 0.86000001, 0.32499999, 0.76700002, 0.65100002, 0.83700001, 0.116, 0.65100002, 0.65100002, 0.96499997, 0.86000001, 0.068999998, 0.27900001, 0.22, 0.22, 0.65100002, 0.65100002, 0.057999998, 0.76700002, 0.755, 0.32499999, 0.90600002, 0.84799999 ] }, { "line": { "color": "rgb(91.66666666666667, 115.55555555555556, 115.55555555555556)" }, "name": "chocolate", "orientation": "h", "points": "suspectedoutliers", "side": "positive", "type": "violin", "width": 3, "x": [ 0.86000001, 0.51099998, 0.76700002, 0.76700002, 0.51099998, 0.093000002, 0.91799998, 0.91799998, 0.91799998, 0.51099998, 0.51099998, 0.65100002, 0.65100002, 0.51099998, 0.65100002, 0.44100001, 0.86000001, 0.86000001, 0.91799998, 0.76700002, 0.76700002, 0.65100002, 0.27900001, 0.65100002, 0.65100002, 0.65100002, 0.86000001, 0.081, 0.97600001, 0.65100002, 0.65100002, 0.32499999, 0.51099998, 0.011, 0.32499999, 0.90600002, 0.84799999 ] }, { "line": { "color": "rgb(113.33333333333334, 94.44444444444444, 94.44444444444444)" }, "name": "caramel", "orientation": "h", "points": "suspectedoutliers", "side": "positive", "type": "violin", "width": 3, "x": [ 0.86000001, 0.76700002, 0.32499999, 0.51099998, 0.65100002, 0.44100001, 0.86000001, 0.86000001, 0.65100002, 0.65100002, 0.76700002, 0.32499999, 0.90600002, 0.26699999 ] }, { "line": { "color": "rgb(135.0, 73.33333333333334, 73.33333333333334)" }, "name": "peanutyalmondy", "orientation": "h", "points": "suspectedoutliers", "side": "positive", "type": "violin", "width": 3, "x": [ 0.76700002, 0.76700002, 0.51099998, 0.65100002, 0.91799998, 0.76700002, 0.76700002, 0.65100002, 0.27900001, 0.65100002, 0.65100002, 0.65100002, 0.65100002, 0.65100002 ] }, { "line": { "color": "rgb(156.66666666666669, 52.22222222222223, 52.22222222222223)" }, "name": "nougat", "orientation": "h", "points": "suspectedoutliers", "side": "positive", "type": "violin", "width": 3, "x": [ 0.51099998, 0.76700002, 0.51099998, 0.65100002, 0.44100001, 0.76700002, 0.65100002 ] }, { "line": { "color": "rgb(178.33333333333334, 31.111111111111114, 31.111111111111114)" }, "name": "bar", "orientation": "h", "points": "suspectedoutliers", "side": "positive", "type": "violin", "width": 3, "x": [ 0.86000001, 0.51099998, 0.76700002, 0.76700002, 0.51099998, 0.91799998, 0.91799998, 0.91799998, 0.51099998, 0.65100002, 0.44100001, 0.86000001, 0.86000001, 0.91799998, 0.76700002, 0.76700002, 0.76700002, 0.65100002, 0.65100002, 0.32499999, 0.90600002 ] }, { "line": { "color": "rgb(200.0, 10.0, 10.0)" }, "name": "crispedricewafer", "orientation": "h", "points": "suspectedoutliers", "side": "positive", "type": "violin", "width": 3, "x": [ 0.86000001, 0.91799998, 0.51099998, 0.76700002, 0.65100002, 0.90600002, 0.84799999 ] } ], "layout": { "height": 800, "template": { "data": { "bar": [ { "error_x": { "color": "#2a3f5f" }, "error_y": { "color": "#2a3f5f" }, "marker": { "line": { "color": "#E5ECF6", "width": 0.5 }, "pattern": { "fillmode": "overlay", "size": 10, "solidity": 0.2 } }, "type": "bar" } ], "barpolar": [ { "marker": { "line": { "color": "#E5ECF6", "width": 0.5 }, "pattern": { "fillmode": "overlay", "size": 10, "solidity": 0.2 } }, "type": "barpolar" } ], "carpet": [ { "aaxis": { "endlinecolor": "#2a3f5f", "gridcolor": "white", "linecolor": "white", "minorgridcolor": "white", "startlinecolor": "#2a3f5f" }, "baxis": { "endlinecolor": "#2a3f5f", "gridcolor": "white", "linecolor": "white", "minorgridcolor": "white", "startlinecolor": "#2a3f5f" }, "type": "carpet" } ], "choropleth": [ { "colorbar": { "outlinewidth": 0, "ticks": "" }, "type": "choropleth" } ], "contour": [ { "colorbar": { "outlinewidth": 0, "ticks": "" }, "colorscale": [ [ 0, "#0d0887" ], [ 0.1111111111111111, "#46039f" ], [ 0.2222222222222222, "#7201a8" ], [ 0.3333333333333333, "#9c179e" ], [ 0.4444444444444444, "#bd3786" ], [ 0.5555555555555556, "#d8576b" ], [ 0.6666666666666666, "#ed7953" ], [ 0.7777777777777778, "#fb9f3a" ], [ 0.8888888888888888, "#fdca26" ], [ 1, "#f0f921" ] ], "type": "contour" } ], "contourcarpet": [ { "colorbar": { "outlinewidth": 0, "ticks": "" }, "type": "contourcarpet" } ], "heatmap": [ { "colorbar": { "outlinewidth": 0, "ticks": "" }, "colorscale": [ [ 0, "#0d0887" ], [ 0.1111111111111111, "#46039f" ], [ 0.2222222222222222, "#7201a8" ], [ 0.3333333333333333, "#9c179e" ], [ 0.4444444444444444, "#bd3786" ], [ 0.5555555555555556, "#d8576b" ], [ 0.6666666666666666, "#ed7953" ], [ 0.7777777777777778, "#fb9f3a" ], [ 0.8888888888888888, "#fdca26" ], [ 1, "#f0f921" ] ], "type": "heatmap" } ], "heatmapgl": [ { "colorbar": { "outlinewidth": 0, "ticks": "" }, "colorscale": [ [ 0, "#0d0887" ], [ 0.1111111111111111, "#46039f" ], [ 0.2222222222222222, "#7201a8" ], [ 0.3333333333333333, "#9c179e" ], [ 0.4444444444444444, "#bd3786" ], [ 0.5555555555555556, "#d8576b" ], [ 0.6666666666666666, "#ed7953" ], [ 0.7777777777777778, "#fb9f3a" ], [ 0.8888888888888888, "#fdca26" ], [ 1, "#f0f921" ] ], "type": "heatmapgl" } ], "histogram": [ { "marker": { "pattern": { "fillmode": "overlay", "size": 10, "solidity": 0.2 } }, "type": "histogram" } ], "histogram2d": [ { "colorbar": { "outlinewidth": 0, "ticks": "" }, "colorscale": [ [ 0, "#0d0887" ], [ 0.1111111111111111, "#46039f" ], [ 0.2222222222222222, "#7201a8" ], [ 0.3333333333333333, "#9c179e" ], [ 0.4444444444444444, "#bd3786" ], [ 0.5555555555555556, "#d8576b" ], [ 0.6666666666666666, "#ed7953" ], [ 0.7777777777777778, "#fb9f3a" ], [ 0.8888888888888888, "#fdca26" ], [ 1, "#f0f921" ] ], "type": "histogram2d" } ], "histogram2dcontour": [ { "colorbar": { "outlinewidth": 0, "ticks": "" }, "colorscale": [ [ 0, "#0d0887" ], [ 0.1111111111111111, "#46039f" ], [ 0.2222222222222222, "#7201a8" ], [ 0.3333333333333333, "#9c179e" ], [ 0.4444444444444444, "#bd3786" ], [ 0.5555555555555556, "#d8576b" ], [ 0.6666666666666666, "#ed7953" ], [ 0.7777777777777778, "#fb9f3a" ], [ 0.8888888888888888, "#fdca26" ], [ 1, "#f0f921" ] ], "type": "histogram2dcontour" } ], "mesh3d": [ { "colorbar": { "outlinewidth": 0, "ticks": "" }, "type": "mesh3d" } ], "parcoords": [ { "line": { "colorbar": { "outlinewidth": 0, "ticks": "" } }, "type": "parcoords" } ], "pie": [ { "automargin": true, "type": "pie" } ], "scatter": [ { "fillpattern": { "fillmode": "overlay", "size": 10, "solidity": 0.2 }, "type": "scatter" } ], "scatter3d": [ { "line": { "colorbar": { "outlinewidth": 0, "ticks": "" } }, "marker": { "colorbar": { "outlinewidth": 0, "ticks": "" } }, "type": "scatter3d" } ], "scattercarpet": [ { "marker": { "colorbar": { "outlinewidth": 0, "ticks": "" } }, "type": "scattercarpet" } ], "scattergeo": [ { "marker": { "colorbar": { "outlinewidth": 0, "ticks": "" } }, "type": "scattergeo" } ], "scattergl": [ { "marker": { "colorbar": { "outlinewidth": 0, "ticks": "" } }, "type": "scattergl" } ], "scattermapbox": [ { "marker": { "colorbar": { "outlinewidth": 0, "ticks": "" } }, "type": "scattermapbox" } ], "scatterpolar": [ { "marker": { "colorbar": { "outlinewidth": 0, "ticks": "" } }, "type": "scatterpolar" } ], "scatterpolargl": [ { "marker": { "colorbar": { "outlinewidth": 0, "ticks": "" } }, "type": "scatterpolargl" } ], "scatterternary": [ { "marker": { "colorbar": { "outlinewidth": 0, "ticks": "" } }, "type": "scatterternary" } ], "surface": [ { "colorbar": { "outlinewidth": 0, "ticks": "" }, "colorscale": [ [ 0, "#0d0887" ], [ 0.1111111111111111, "#46039f" ], [ 0.2222222222222222, "#7201a8" ], [ 0.3333333333333333, "#9c179e" ], [ 0.4444444444444444, "#bd3786" ], [ 0.5555555555555556, "#d8576b" ], [ 0.6666666666666666, "#ed7953" ], [ 0.7777777777777778, "#fb9f3a" ], [ 0.8888888888888888, "#fdca26" ], [ 1, "#f0f921" ] ], "type": "surface" } ], "table": [ { "cells": { "fill": { "color": "#EBF0F8" }, "line": { "color": "white" } }, "header": { "fill": { "color": "#C8D4E3" }, "line": { "color": "white" } }, "type": "table" } ] }, "layout": { "annotationdefaults": { "arrowcolor": "#2a3f5f", "arrowhead": 0, "arrowwidth": 1 }, "autotypenumbers": "strict", "coloraxis": { "colorbar": { "outlinewidth": 0, "ticks": "" } }, "colorscale": { "diverging": [ [ 0, "#8e0152" ], [ 0.1, "#c51b7d" ], [ 0.2, "#de77ae" ], [ 0.3, "#f1b6da" ], [ 0.4, "#fde0ef" ], [ 0.5, "#f7f7f7" ], [ 0.6, "#e6f5d0" ], [ 0.7, "#b8e186" ], [ 0.8, "#7fbc41" ], [ 0.9, "#4d9221" ], [ 1, "#276419" ] ], "sequential": [ [ 0, "#0d0887" ], [ 0.1111111111111111, "#46039f" ], [ 0.2222222222222222, "#7201a8" ], [ 0.3333333333333333, "#9c179e" ], [ 0.4444444444444444, "#bd3786" ], [ 0.5555555555555556, "#d8576b" ], [ 0.6666666666666666, "#ed7953" ], [ 0.7777777777777778, "#fb9f3a" ], [ 0.8888888888888888, "#fdca26" ], [ 1, "#f0f921" ] ], "sequentialminus": [ [ 0, "#0d0887" ], [ 0.1111111111111111, "#46039f" ], [ 0.2222222222222222, "#7201a8" ], [ 0.3333333333333333, "#9c179e" ], [ 0.4444444444444444, "#bd3786" ], [ 0.5555555555555556, "#d8576b" ], [ 0.6666666666666666, "#ed7953" ], [ 0.7777777777777778, "#fb9f3a" ], [ 0.8888888888888888, "#fdca26" ], [ 1, "#f0f921" ] ] }, "colorway": [ "#636efa", "#EF553B", "#00cc96", "#ab63fa", "#FFA15A", "#19d3f3", "#FF6692", "#B6E880", "#FF97FF", "#FECB52" ], "font": { "color": "#2a3f5f" }, "geo": { "bgcolor": "white", "lakecolor": "white", "landcolor": "#E5ECF6", "showlakes": true, "showland": true, "subunitcolor": "white" }, "hoverlabel": { "align": "left" }, "hovermode": "closest", "mapbox": { "style": "light" }, "paper_bgcolor": "white", "plot_bgcolor": "#E5ECF6", "polar": { "angularaxis": { "gridcolor": "white", "linecolor": "white", "ticks": "" }, "bgcolor": "#E5ECF6", "radialaxis": { "gridcolor": "white", "linecolor": "white", "ticks": "" } }, "scene": { "xaxis": { "backgroundcolor": "#E5ECF6", "gridcolor": "white", "gridwidth": 2, "linecolor": "white", "showbackground": true, "ticks": "", "zerolinecolor": "white" }, "yaxis": { "backgroundcolor": "#E5ECF6", "gridcolor": "white", "gridwidth": 2, "linecolor": "white", "showbackground": true, "ticks": "", "zerolinecolor": "white" }, "zaxis": { "backgroundcolor": "#E5ECF6", "gridcolor": "white", "gridwidth": 2, "linecolor": "white", "showbackground": true, "ticks": "", "zerolinecolor": "white" } }, "shapedefaults": { "line": { "color": "#2a3f5f" } }, "ternary": { "aaxis": { "gridcolor": "white", "linecolor": "white", "ticks": "" }, "baxis": { "gridcolor": "white", "linecolor": "white", "ticks": "" }, "bgcolor": "#E5ECF6", "caxis": { "gridcolor": "white", "linecolor": "white", "ticks": "" } }, "title": { "x": 0.05 }, "xaxis": { "automargin": true, "gridcolor": "white", "linecolor": "white", "ticks": "", "title": { "standoff": 15 }, "zerolinecolor": "white", "zerolinewidth": 2 }, "yaxis": { "automargin": true, "gridcolor": "white", "linecolor": "white", "ticks": "", "title": { "standoff": 15 }, "zerolinecolor": "white", "zerolinewidth": 2 } } }, "xaxis": { "showgrid": false, "zeroline": false } } }, "text/html": [ "
" ] }, "metadata": {}, "output_type": "display_data" } ], "source": [ "# Help order the cureves in an increasing order.\n", "traits_ordered_by_median_of_price = (\n", " pd.DataFrame(\n", " [[trait, df[df[trait] == 1][\"pricepercent\"].median()] for trait in traits],\n", " columns=[\"trait\", \"median\"],\n", " )\n", " .sort_values(\"median\")[\"trait\"]\n", " .values\n", ")\n", "\n", "colors = n_colors(\"rgb(5, 200, 200)\", \"rgb(200, 10, 10)\", len(traits), colortype=\"rgb\")\n", "\n", "fig = go.Figure()\n", "for trait, color in zip(traits_ordered_by_median_of_price, colors):\n", " fig.add_trace(\n", " go.Violin(x=df[df[trait] == 1].pricepercent, line_color=color, name=trait)\n", " )\n", " fig.update_annotations()\n", "\n", "fig.update_traces(\n", " orientation=\"h\", side=\"positive\", width=3, points=\"suspectedoutliers\",\n", ")\n", "fig.update_layout(xaxis_showgrid=False, xaxis_zeroline=False, height=800)\n", "fig.show()" ] }, { "cell_type": "markdown", "metadata": {}, "source": [ "### Price vs. winning\n", "\n", "Note that traits linked to higher win percentage are also more expansive." ] }, { "cell_type": "code", "execution_count": 10, "metadata": {}, "outputs": [ { "ename": "ModuleNotFoundError", "evalue": "No module named 'statsmodels'", "output_type": "error", "traceback": [ "\u001b[0;31m---------------------------------------------------------------------------\u001b[0m", "\u001b[0;31mModuleNotFoundError\u001b[0m Traceback (most recent call last)", "\u001b[1;32m/Users/drorata/My Drive/dev/candy-analysis/candy-analysis.ipynb Cell 19\u001b[0m in \u001b[0;36m\u001b[0;34m()\u001b[0m\n\u001b[0;32m----> 1\u001b[0m px\u001b[39m.\u001b[39;49mscatter(\n\u001b[1;32m 2\u001b[0m df,\n\u001b[1;32m 3\u001b[0m x\u001b[39m=\u001b[39;49m\u001b[39m\"\u001b[39;49m\u001b[39mpricepercent\u001b[39;49m\u001b[39m\"\u001b[39;49m,\n\u001b[1;32m 4\u001b[0m y\u001b[39m=\u001b[39;49m\u001b[39m\"\u001b[39;49m\u001b[39mwinpercent\u001b[39;49m\u001b[39m\"\u001b[39;49m,\n\u001b[1;32m 5\u001b[0m trendline\u001b[39m=\u001b[39;49m\u001b[39m\"\u001b[39;49m\u001b[39mols\u001b[39;49m\u001b[39m\"\u001b[39;49m,\n\u001b[1;32m 6\u001b[0m trendline_color_override\u001b[39m=\u001b[39;49m\u001b[39m\"\u001b[39;49m\u001b[39mgray\u001b[39;49m\u001b[39m\"\u001b[39;49m,\n\u001b[1;32m 7\u001b[0m )\n", "File \u001b[0;32m~/.local/share/virtualenvs/candy-analysis-2Bzwo_Fd/lib/python3.10/site-packages/plotly/express/_chart_types.py:66\u001b[0m, in \u001b[0;36mscatter\u001b[0;34m(data_frame, x, y, color, symbol, size, hover_name, hover_data, custom_data, text, facet_row, facet_col, facet_col_wrap, facet_row_spacing, facet_col_spacing, error_x, error_x_minus, error_y, error_y_minus, animation_frame, animation_group, category_orders, labels, orientation, color_discrete_sequence, color_discrete_map, color_continuous_scale, range_color, color_continuous_midpoint, symbol_sequence, symbol_map, opacity, size_max, marginal_x, marginal_y, trendline, trendline_options, trendline_color_override, trendline_scope, log_x, log_y, range_x, range_y, render_mode, title, template, width, height)\u001b[0m\n\u001b[1;32m 12\u001b[0m \u001b[39mdef\u001b[39;00m \u001b[39mscatter\u001b[39m(\n\u001b[1;32m 13\u001b[0m data_frame\u001b[39m=\u001b[39m\u001b[39mNone\u001b[39;00m,\n\u001b[1;32m 14\u001b[0m x\u001b[39m=\u001b[39m\u001b[39mNone\u001b[39;00m,\n\u001b[0;32m (...)\u001b[0m\n\u001b[1;32m 60\u001b[0m height\u001b[39m=\u001b[39m\u001b[39mNone\u001b[39;00m,\n\u001b[1;32m 61\u001b[0m ) \u001b[39m-\u001b[39m\u001b[39m>\u001b[39m go\u001b[39m.\u001b[39mFigure:\n\u001b[1;32m 62\u001b[0m \u001b[39m\"\"\"\u001b[39;00m\n\u001b[1;32m 63\u001b[0m \u001b[39m In a scatter plot, each row of `data_frame` is represented by a symbol\u001b[39;00m\n\u001b[1;32m 64\u001b[0m \u001b[39m mark in 2D space.\u001b[39;00m\n\u001b[1;32m 65\u001b[0m \u001b[39m \"\"\"\u001b[39;00m\n\u001b[0;32m---> 66\u001b[0m \u001b[39mreturn\u001b[39;00m make_figure(args\u001b[39m=\u001b[39;49m\u001b[39mlocals\u001b[39;49m(), constructor\u001b[39m=\u001b[39;49mgo\u001b[39m.\u001b[39;49mScatter)\n", "File \u001b[0;32m~/.local/share/virtualenvs/candy-analysis-2Bzwo_Fd/lib/python3.10/site-packages/plotly/express/_core.py:2167\u001b[0m, in \u001b[0;36mmake_figure\u001b[0;34m(args, constructor, trace_patch, layout_patch)\u001b[0m\n\u001b[1;32m 2164\u001b[0m \u001b[39melif\u001b[39;00m args[\u001b[39m\"\u001b[39m\u001b[39mecdfnorm\u001b[39m\u001b[39m\"\u001b[39m] \u001b[39m==\u001b[39m \u001b[39m\"\u001b[39m\u001b[39mpercent\u001b[39m\u001b[39m\"\u001b[39m:\n\u001b[1;32m 2165\u001b[0m group[var] \u001b[39m=\u001b[39m \u001b[39m100.0\u001b[39m \u001b[39m*\u001b[39m group[var] \u001b[39m/\u001b[39m group_sum\n\u001b[0;32m-> 2167\u001b[0m patch, fit_results \u001b[39m=\u001b[39m make_trace_kwargs(\n\u001b[1;32m 2168\u001b[0m args, trace_spec, group, mapping_labels\u001b[39m.\u001b[39;49mcopy(), sizeref\n\u001b[1;32m 2169\u001b[0m )\n\u001b[1;32m 2170\u001b[0m trace\u001b[39m.\u001b[39mupdate(patch)\n\u001b[1;32m 2171\u001b[0m \u001b[39mif\u001b[39;00m fit_results \u001b[39mis\u001b[39;00m \u001b[39mnot\u001b[39;00m \u001b[39mNone\u001b[39;00m:\n", "File \u001b[0;32m~/.local/share/virtualenvs/candy-analysis-2Bzwo_Fd/lib/python3.10/site-packages/plotly/express/_core.py:358\u001b[0m, in \u001b[0;36mmake_trace_kwargs\u001b[0;34m(args, trace_spec, trace_data, mapping_labels, sizeref)\u001b[0m\n\u001b[1;32m 356\u001b[0m trace_patch[\u001b[39m\"\u001b[39m\u001b[39mx\u001b[39m\u001b[39m\"\u001b[39m] \u001b[39m=\u001b[39m sorted_trace_data[args[\u001b[39m\"\u001b[39m\u001b[39mx\u001b[39m\u001b[39m\"\u001b[39m]][non_missing]\n\u001b[1;32m 357\u001b[0m trendline_function \u001b[39m=\u001b[39m trendline_functions[attr_value]\n\u001b[0;32m--> 358\u001b[0m y_out, hover_header, fit_results \u001b[39m=\u001b[39m trendline_function(\n\u001b[1;32m 359\u001b[0m args[\u001b[39m\"\u001b[39;49m\u001b[39mtrendline_options\u001b[39;49m\u001b[39m\"\u001b[39;49m],\n\u001b[1;32m 360\u001b[0m sorted_trace_data[args[\u001b[39m\"\u001b[39;49m\u001b[39mx\u001b[39;49m\u001b[39m\"\u001b[39;49m]],\n\u001b[1;32m 361\u001b[0m x,\n\u001b[1;32m 362\u001b[0m y,\n\u001b[1;32m 363\u001b[0m args[\u001b[39m\"\u001b[39;49m\u001b[39mx\u001b[39;49m\u001b[39m\"\u001b[39;49m],\n\u001b[1;32m 364\u001b[0m args[\u001b[39m\"\u001b[39;49m\u001b[39my\u001b[39;49m\u001b[39m\"\u001b[39;49m],\n\u001b[1;32m 365\u001b[0m non_missing,\n\u001b[1;32m 366\u001b[0m )\n\u001b[1;32m 367\u001b[0m \u001b[39massert\u001b[39;00m \u001b[39mlen\u001b[39m(y_out) \u001b[39m==\u001b[39m \u001b[39mlen\u001b[39m(\n\u001b[1;32m 368\u001b[0m trace_patch[\u001b[39m\"\u001b[39m\u001b[39mx\u001b[39m\u001b[39m\"\u001b[39m]\n\u001b[1;32m 369\u001b[0m ), \u001b[39m\"\u001b[39m\u001b[39mmissing-data-handling failure in trendline code\u001b[39m\u001b[39m\"\u001b[39m\n\u001b[1;32m 370\u001b[0m trace_patch[\u001b[39m\"\u001b[39m\u001b[39my\u001b[39m\u001b[39m\"\u001b[39m] \u001b[39m=\u001b[39m y_out\n", "File \u001b[0;32m~/.local/share/virtualenvs/candy-analysis-2Bzwo_Fd/lib/python3.10/site-packages/plotly/express/trendline_functions/__init__.py:43\u001b[0m, in \u001b[0;36mols\u001b[0;34m(trendline_options, x_raw, x, y, x_label, y_label, non_missing)\u001b[0m\n\u001b[1;32m 37\u001b[0m \u001b[39mif\u001b[39;00m k \u001b[39mnot\u001b[39;00m \u001b[39min\u001b[39;00m valid_options:\n\u001b[1;32m 38\u001b[0m \u001b[39mraise\u001b[39;00m \u001b[39mValueError\u001b[39;00m(\n\u001b[1;32m 39\u001b[0m \u001b[39m\"\u001b[39m\u001b[39mOLS trendline_options keys must be one of [\u001b[39m\u001b[39m%s\u001b[39;00m\u001b[39m] but got \u001b[39m\u001b[39m'\u001b[39m\u001b[39m%s\u001b[39;00m\u001b[39m'\u001b[39m\u001b[39m\"\u001b[39m\n\u001b[1;32m 40\u001b[0m \u001b[39m%\u001b[39m (\u001b[39m\"\u001b[39m\u001b[39m, \u001b[39m\u001b[39m\"\u001b[39m\u001b[39m.\u001b[39mjoin(valid_options), k)\n\u001b[1;32m 41\u001b[0m )\n\u001b[0;32m---> 43\u001b[0m \u001b[39mimport\u001b[39;00m \u001b[39mstatsmodels\u001b[39;00m\u001b[39m.\u001b[39;00m\u001b[39mapi\u001b[39;00m \u001b[39mas\u001b[39;00m \u001b[39msm\u001b[39;00m\n\u001b[1;32m 45\u001b[0m add_constant \u001b[39m=\u001b[39m trendline_options\u001b[39m.\u001b[39mget(\u001b[39m\"\u001b[39m\u001b[39madd_constant\u001b[39m\u001b[39m\"\u001b[39m, \u001b[39mTrue\u001b[39;00m)\n\u001b[1;32m 46\u001b[0m log_x \u001b[39m=\u001b[39m trendline_options\u001b[39m.\u001b[39mget(\u001b[39m\"\u001b[39m\u001b[39mlog_x\u001b[39m\u001b[39m\"\u001b[39m, \u001b[39mFalse\u001b[39;00m)\n", "\u001b[0;31mModuleNotFoundError\u001b[0m: No module named 'statsmodels'" ] } ], "source": [ "px.scatter(\n", " df,\n", " x=\"pricepercent\",\n", " y=\"winpercent\",\n", " trendline=\"ols\",\n", " trendline_color_override=\"gray\",\n", ")" ] }, { "cell_type": "markdown", "metadata": {}, "source": [ "The figure above suggests that there is a positive correlation between the price of the item and its win percent.\n", "From a business stand point, there are at least two possible tracks:\n", "- Favor \"quality\"; focus on more expansive candies that aim at higher customer satisfaction. The potential tradeoff in this case can be a reduced business volume.\n", "- Favor \"volume\"; aim at \"low\" end products that gain less winning percentage, but are cheaper and thus yield higher volumes.\n", "\n", "Deciding which track to take is kept out of scope for this analysis.\n", "\n", "# The environment\n", "\n", "```\n", "ipykernel\n", "pandas==1.4.2\n", "plotly==5.7.0\n", "ipywidgets==7.7.0\n", "statsmodels==0.13.2\n", "```\n", "\n", "\n", "# Oh no...\n", "\n", "I just realized that the lovely plots are not rendered when served in the blog 🤯.\n", "The notebook used to creating this notebook can be found [here](https://gist.github.com/drorata/120b25ec127a31f24e54d34ddbec08c5/858150285415ac997935a01a5ac9f613e5cbec34).\n", "\n", "The notebook can be opened using Colab [here](https://colab.research.google.com/github/drorata/drorata.github.io/blob/eeb65d9cc5eca4ae2f47769b9ec94ca82c707152/content/notebooks/candy-analysis.ipynb).\n", "Not optimal, but works..." ] } ], "metadata": { "kernelspec": { "display_name": "Python 3.10.6 ('candy-analysis-2Bzwo_Fd')", "language": "python", "name": "python3" }, "language_info": { "codemirror_mode": { "name": "ipython", "version": 3 }, "file_extension": ".py", "mimetype": "text/x-python", "name": "python", "nbconvert_exporter": "python", "pygments_lexer": "ipython3", "version": "3.10.6" }, "orig_nbformat": 4, "vscode": { "interpreter": { "hash": "9120b658278f5d925585dced387b6c8a214ba4fb7eb58d7e37d649d9d23aa2fd" } } }, "nbformat": 4, "nbformat_minor": 2 }