leafletThe leaflet R package is a wrapper of the Javascript leaflet.js library. It allows to build stunning interactive maps in minutes with R. Maps can be exported and standalong html files, or be embeded in a R markdown file or a shiny application. Check the 3 examples below to get the basics of interactive bubble maps with R.
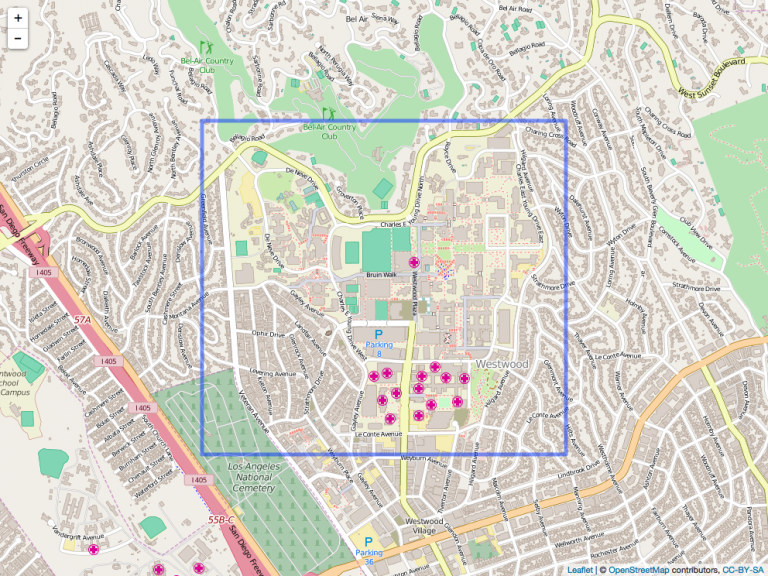
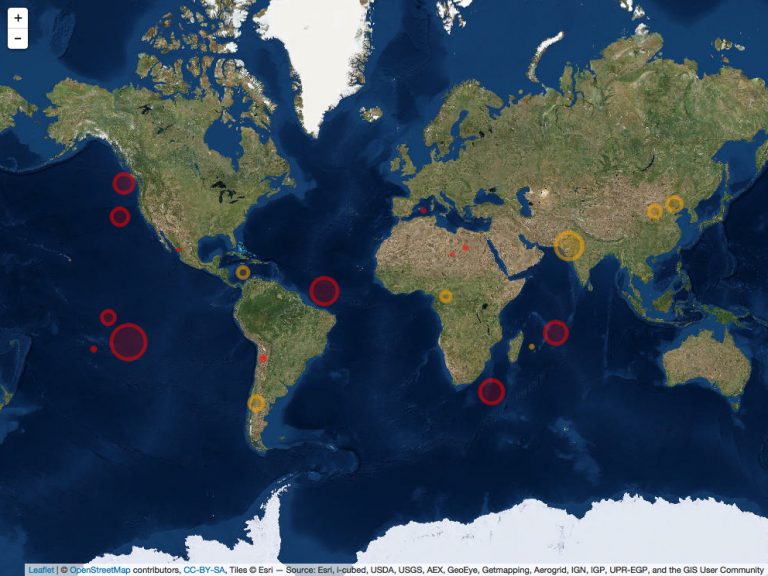
Leaflet maps are interactive. Try to zoom and drag the map below. Hover a circle to get more information about it. See Code
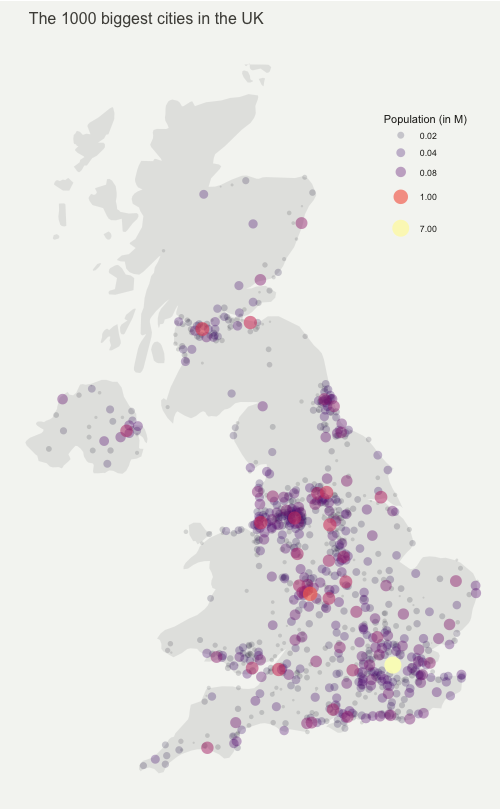
ggplot2ggplot2 is probably the best option if you're looking to build a static bubble map. It offers all the flexibility of the grammar of graphic, and allow to re-use all the knowledge you learned building other types of chart with it. If you don't know about ggplot2, read this introduction.
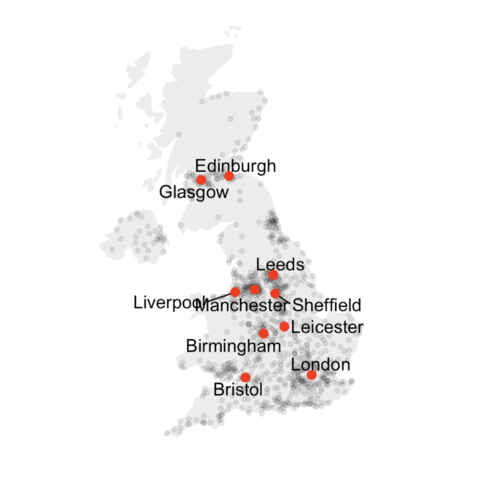
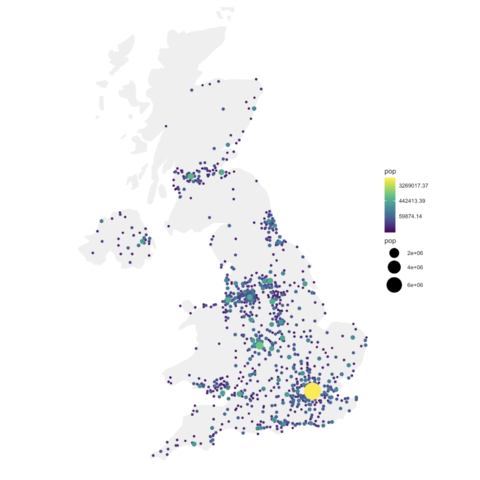
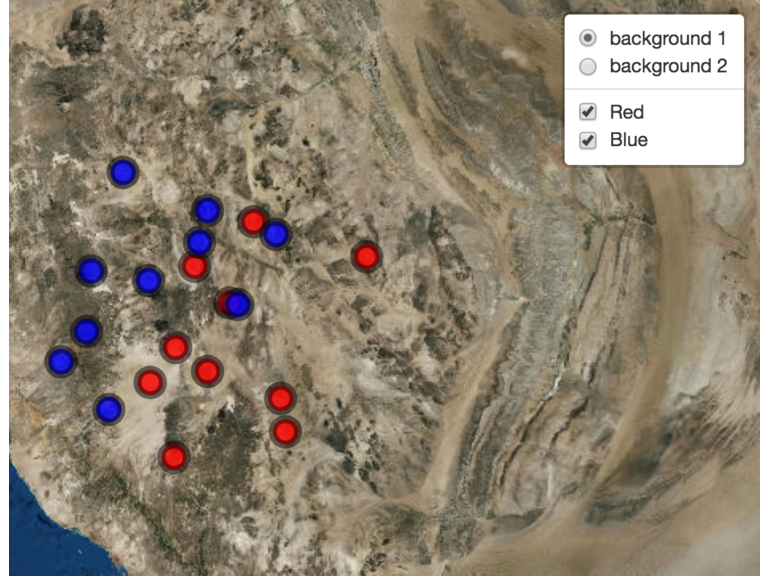
ggplot2 and plotly The plotly package provides the magic ggplotly() function. This function will turn any of your static bubble map made with ggplot2 interactive. With only one more line of code:
Note: try to zoom, drag, hover circle, select area and more.
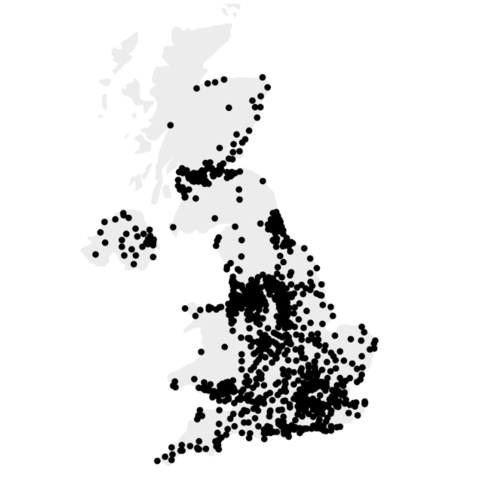
cartography package.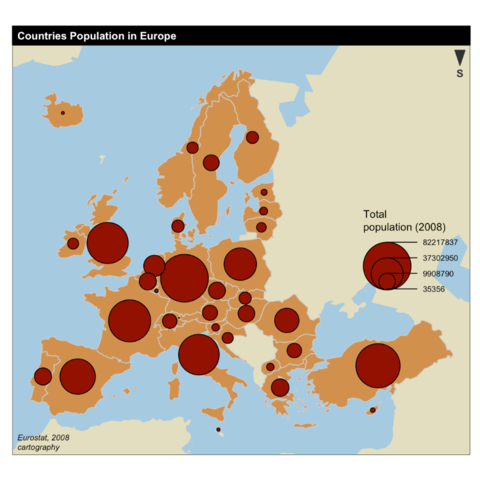
The cartography package is a great alternative to the tidyverse to build maps with R. It provides many helpers specially made for maps.