---
title: Overview
description: pivotkit is Excel's PivotTable for web applications and the command line - people load their own file, drag fields, filter, chart and export to Excel, and the report is a safe JSON view that renders again in CI. React, web component, engine, CLI, REST service and MCP server; MIT.
hide:
- navigation
- toc
---
Excel's PivotTable for your web application. People load their data, drag fields into rows, columns and values, and take the result to Excel. The same report runs again on the command line.
MIT · the report runs in the browser, nothing uploaded · React, web component, Node, command line, REST, MCP
[I build reports](use/index.md){ .md-button .md-button--primary title="For the people who build reports in an application: load data, fields, filters, charts, export" }
[I embed or automate pivotkit](embed/index.md){ .md-button .md-button--primary title="For developers: React, web component, engine, reports, the command line, REST and MCP" }
[Try the live demo](demo.md){ .md-button }
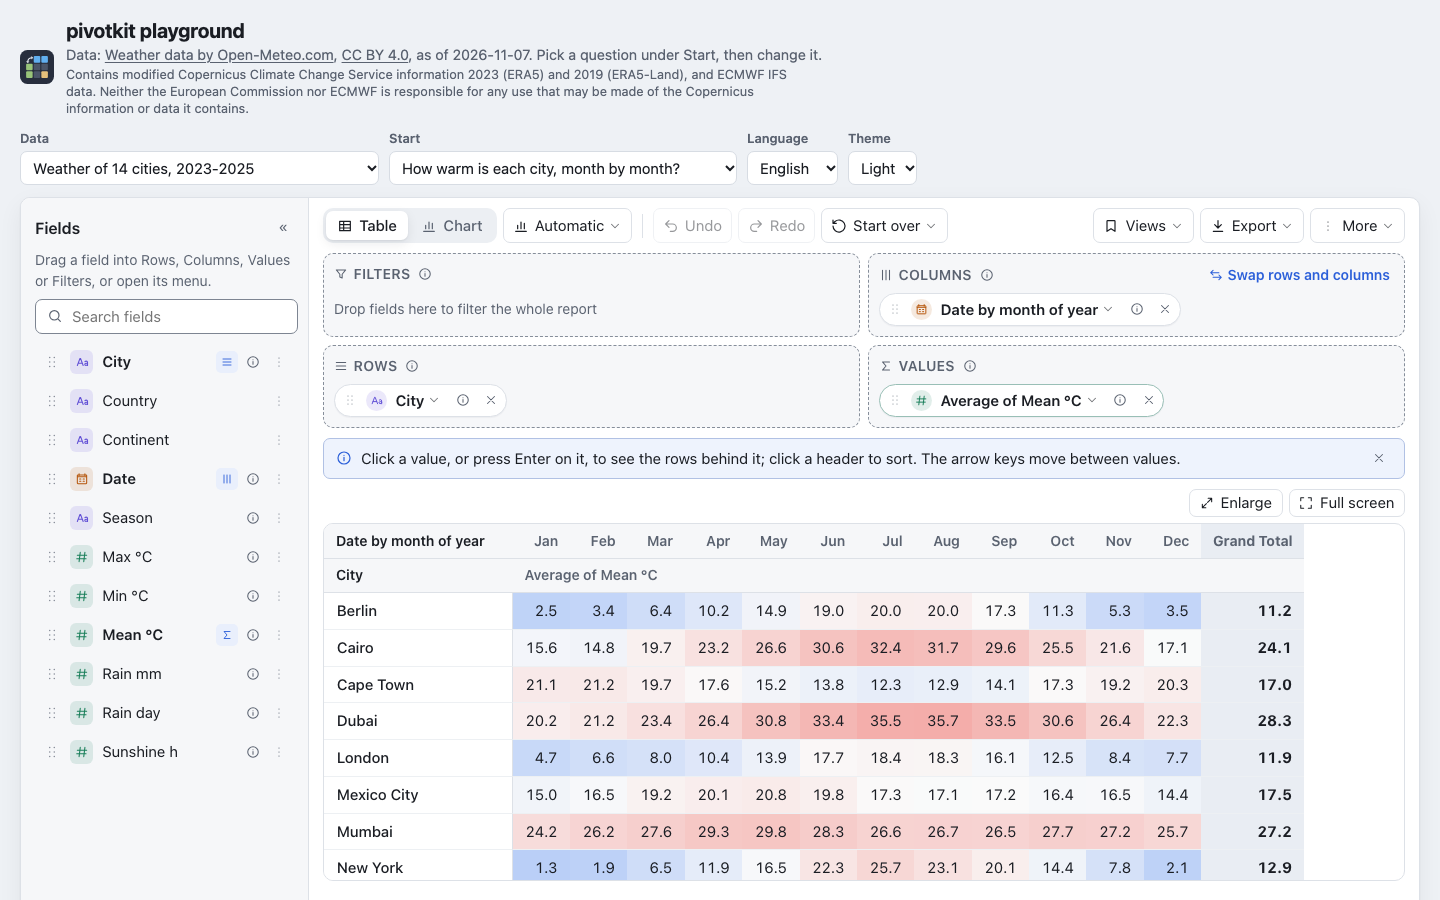
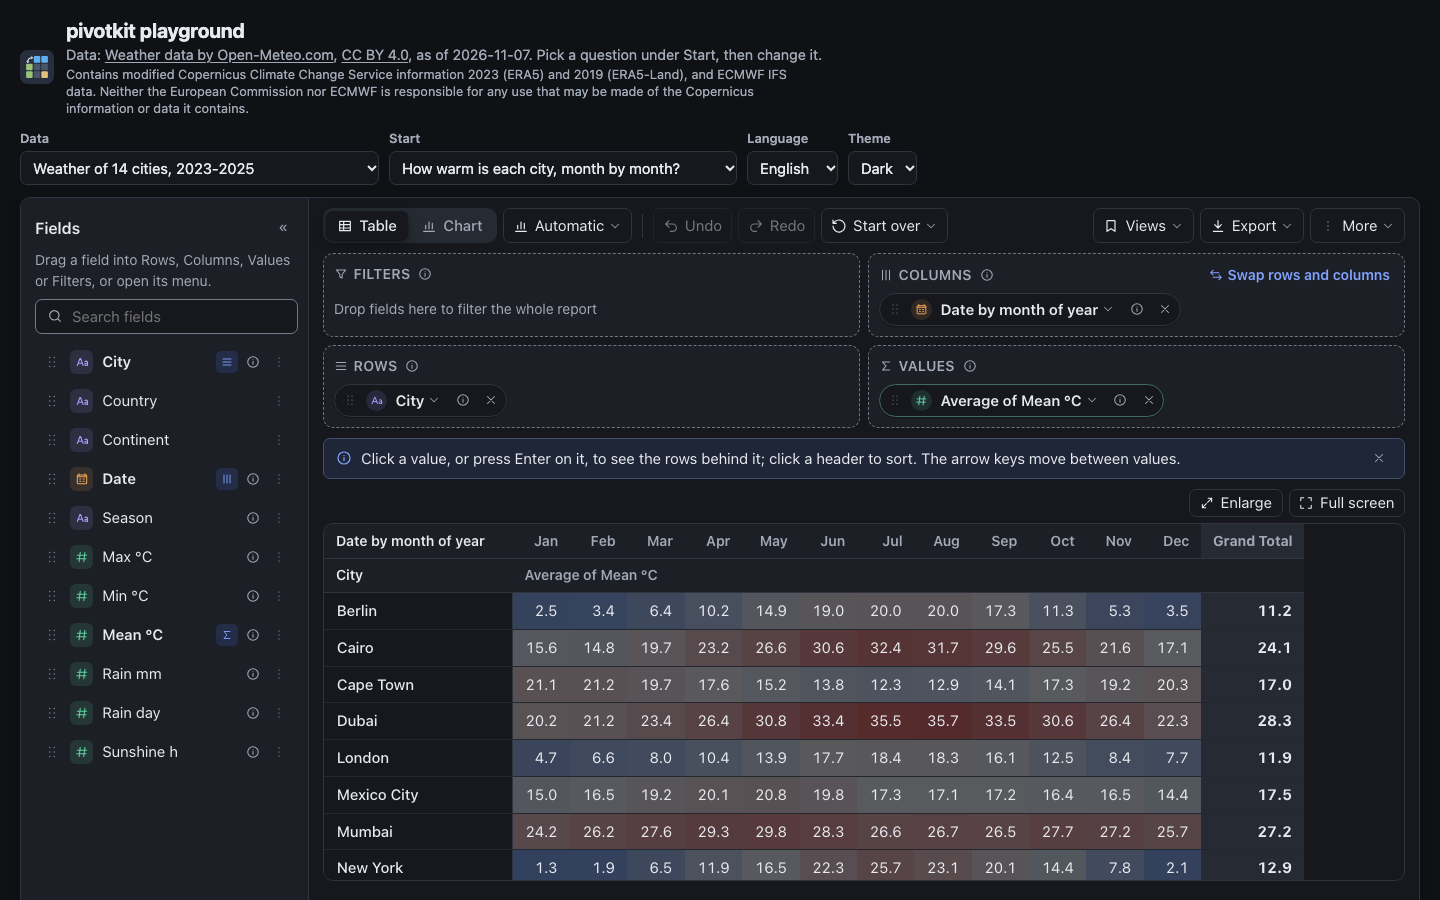
The report: fields in Rows, Columns and Values, a colour scale.
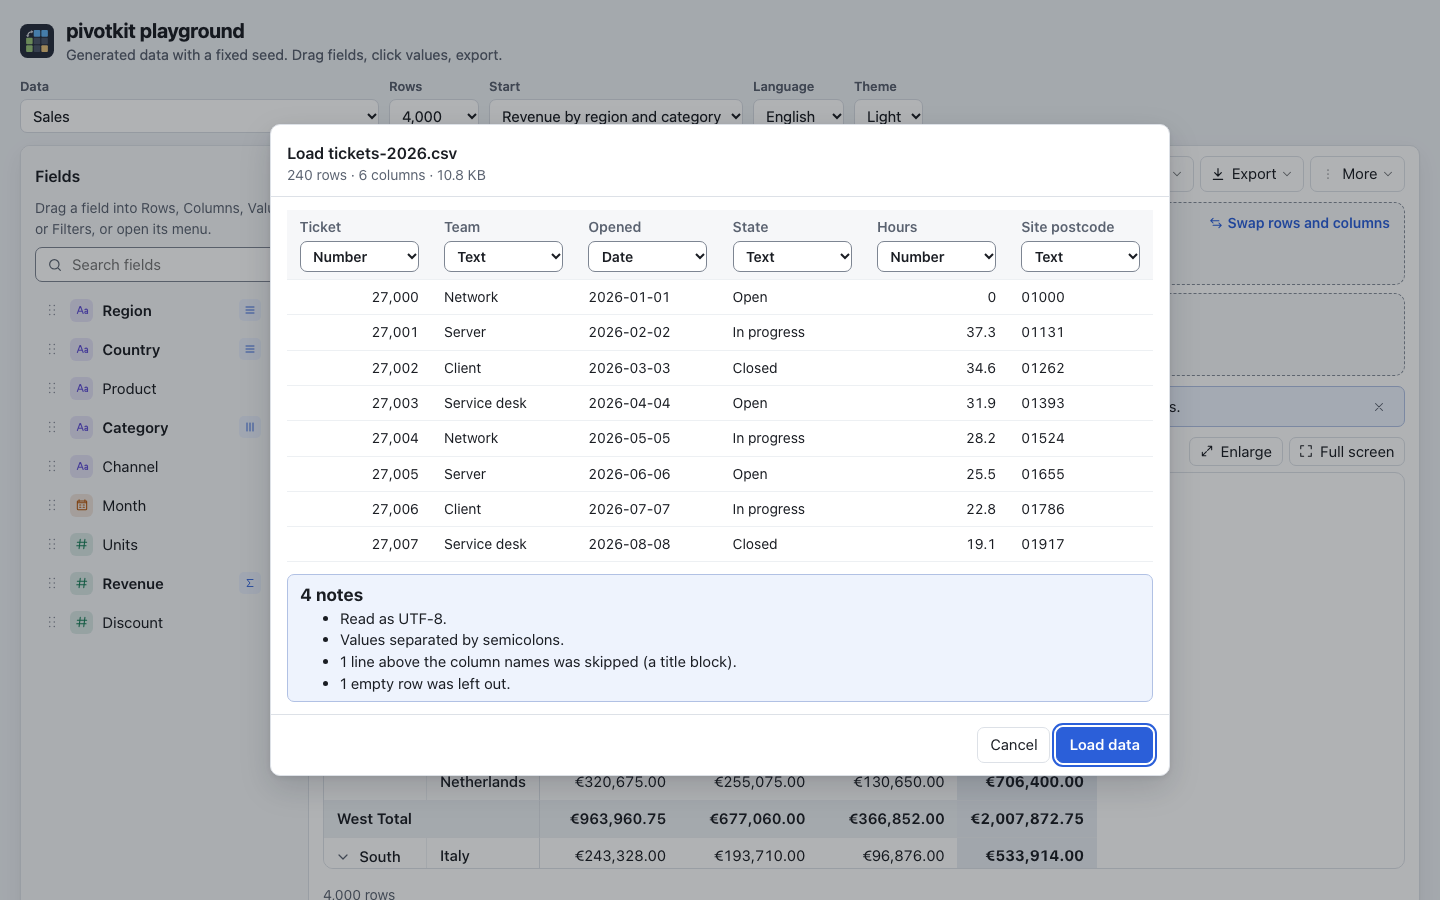
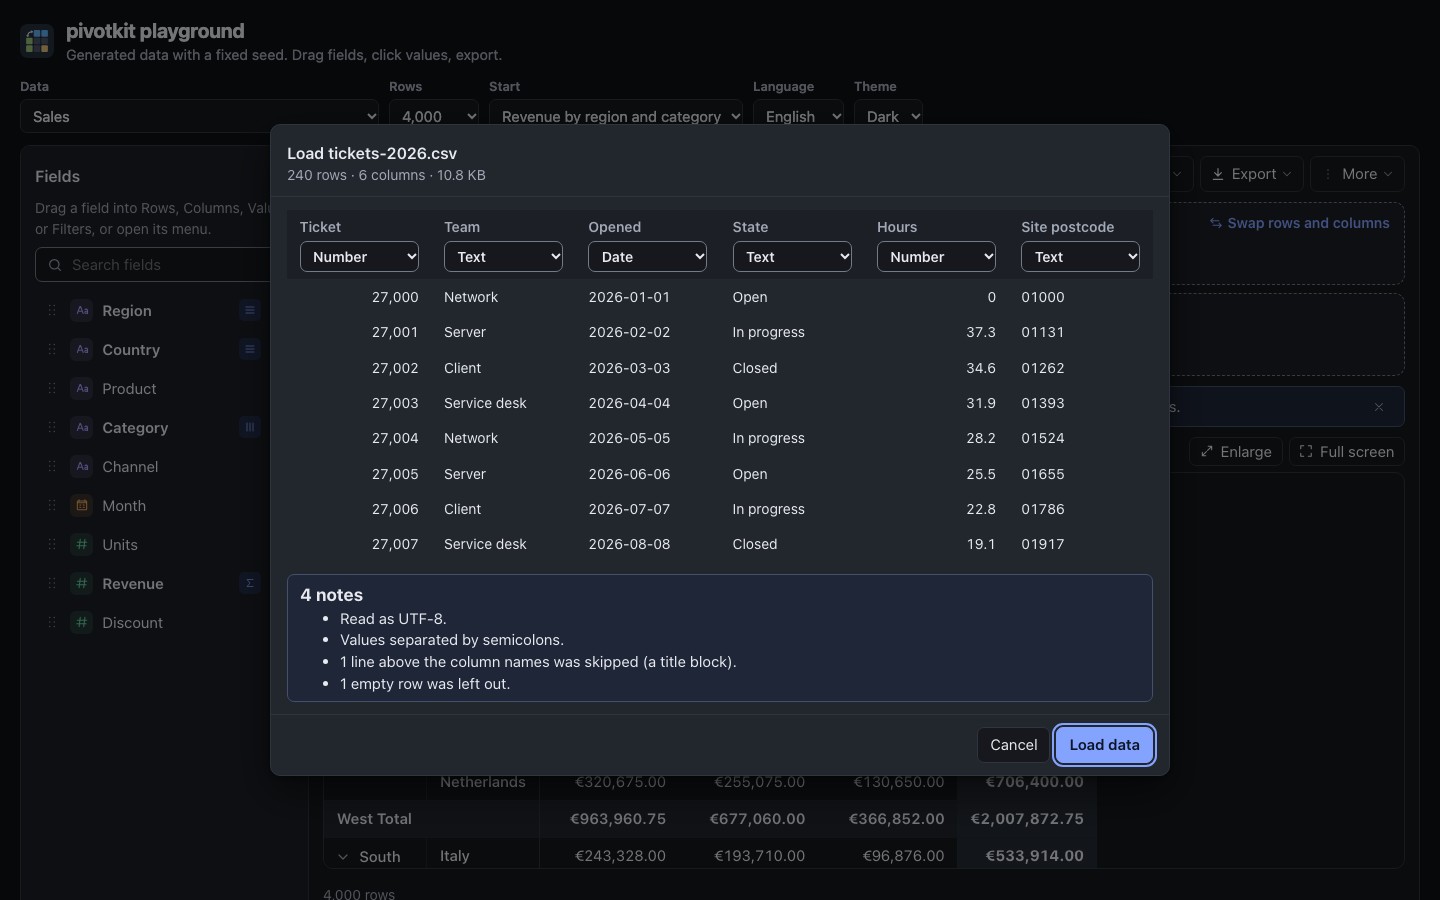
Your own file: a preview with a type per column before it replaces the data.
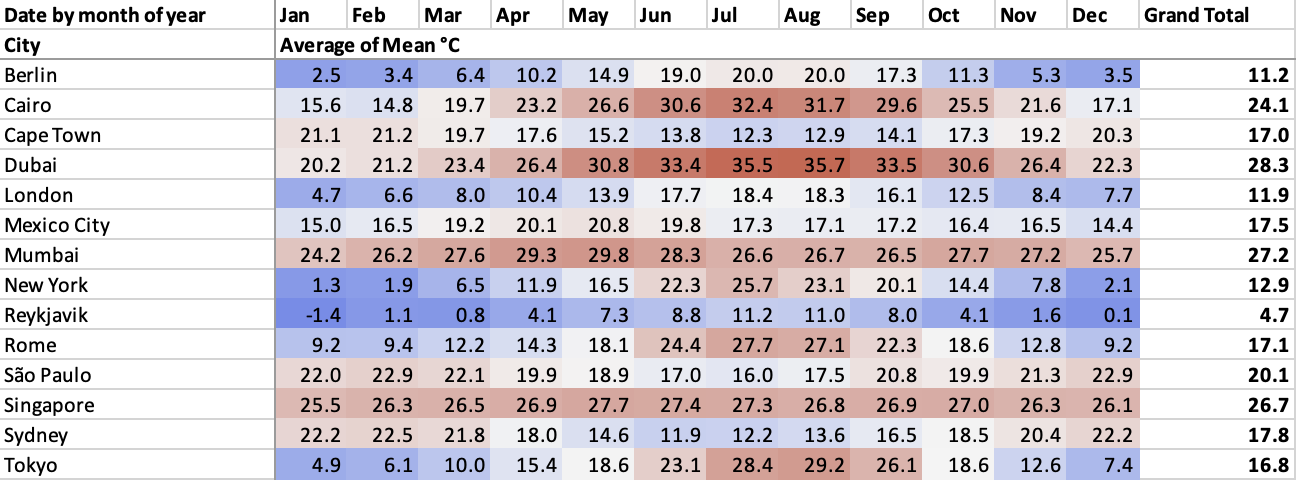
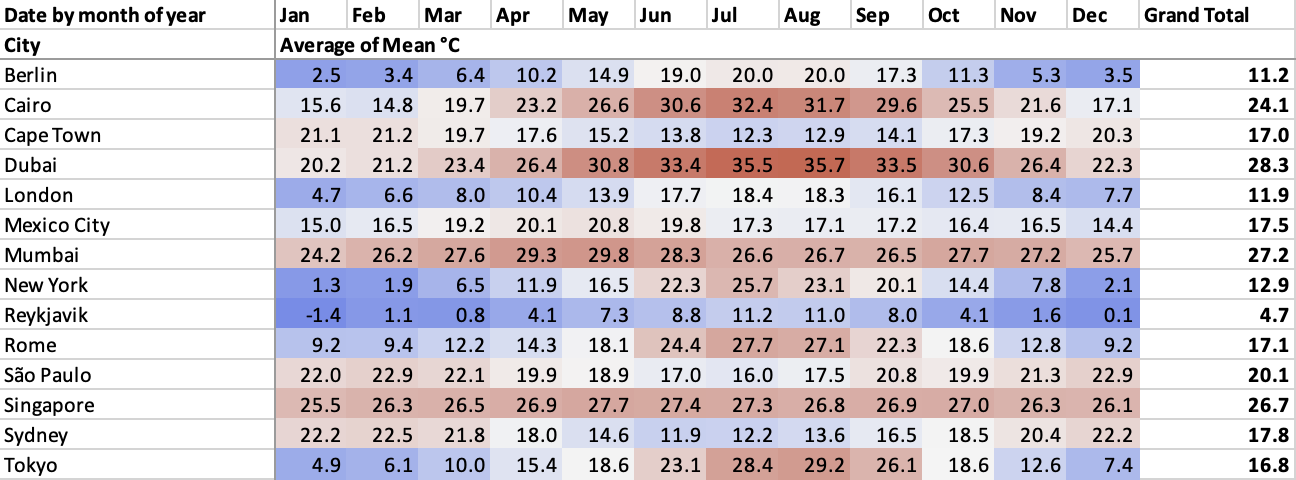
The same report as a workbook in Excel, colour scale included.
Weather data by [Open-Meteo.com](https://open-meteo.com/) ([CC BY 4.0](https://creativecommons.org/licenses/by/4.0/)); contains modified Copernicus Climate Change Service information ([attribution](learn.md#query-it-live)).
## What it does well
1. **Bring your own file.** Where the application allows it, drop a CSV, JSON or Excel file onto
the report. A preview shows a type under each column. You can change the type and pick the sheet
of a workbook. pivotkit reads German numbers and dates, title lines above the header and leading
zeros ("01067") correctly. Undo brings the application's data back. Nothing is uploaded. See
[load your own data](use/load-data.md).
2. **Filters that say what they keep.** Pick items from a list that shows each item's row count.
Take a range such as "last 3 months" or "this quarter" that stays right over time. Take a top 10
with ties, or a rule on a total ("Sum of Revenue > 1,000"). Each filter says how many items it
keeps. See [filters](use/filters.md).
3. **Excel with the layout kept.** The workbook keeps merged headers, bold totals and number
formats. Colour scales and data bars become Excel's own conditional formats. Besides the table's
exports, you can download the rows behind the table as CSV or JSON for your own analysis. See
[export](use/export.md) and [the table or the rows](use/export.md#the-table-or-the-rows-behind-it).
4. **Keyboard and screen reader for every action.** Every step has a button or a menu entry, so drag
and drop is never the only way. Chips move with the arrow keys and say where they are. See
[keyboard and screen readers](use/keyboard.md).
5. **Safe views, reports without a browser.** A report is a small JSON view. It holds names only
and cannot run code: see [security](security.md#views-are-untrusted-input). `pivotkit render`
makes the same report from the view on the command line or in CI, as HTML, CSV or Excel.
`pivotkit describe --suggest` makes a first view from the fields of a CSV or Excel file. See
[command line](getting-started/cli.md).
6. **Live data from files, HTTP APIs and code.** You run the REST service and the MCP server. They
read a file, call an [HTTP API](reference/sources.md#http) or run your
[own code](reference/sources.md#code) with the caller's parameters. They keep a load for a short
time per caller. An AI model gets field names and counts. It gets rows only where the policy
shows them: see [what reaches an AI model](model-data.md). Every result says when its data is
from: "Data as of" in the server's HTML reports, a document property in its Excel files.
7. **Reports that reach people.** A report the server writes comes with a
[download link](reference/delivery.md) that expires. Where the data is not open to everyone, the
link is bound to the person's sign-in. The server can also send the report to a
[store you run](reference/delivery.md#upload): S3, Azure Blob Storage or a file service of your
own. A small csv or json result over fields that are shown can also come back only in the
answer, saved nowhere. See [`save: false`](reference/mcp.md#inline-only).
## For the people who build reports { #for-the-people-who-build-reports }
Build your first report in six steps with the [quick start](use/quick-start.md). Then
[learn with real data](learn.md): weather, countries, earthquakes, Nobel laureates and software end
of life. Or [load your own](use/load-data.md). Every task has its page under
[Use a report](use/index.md). Every feature is in the [feature list](features.md).
## For developers { #for-developers }
| You want | Start here |
| --- | --- |
| The report in a React 18 or 19 app | [React](getting-started/react.md): `npm install pivotkit-react react react-dom echarts` |
| The report on a page without React, such as Angular, PHP or plain HTML | [Web component](getting-started/web-component.md): `` |
| Pivots, grids and exports in your own code, browser or Node | [Engine](getting-started/engine.md): `pivotkit-core` |
| Reports as files from a script or a server | [Reports in code](getting-started/report.md): `pivotkit-report` |
| Reports and view checks in a terminal or CI | [Command line](getting-started/cli.md): `pivotkit example` |
| Reports for programs over HTTP, such as scripts, PowerShell or schedulers, with an OpenAPI document | [REST service](getting-started/rest.md): `pivotkit-server serve`, the [container image](reference/container.md) or [Kubernetes](getting-started/kubernetes.md) |
| Reports from an AI client such as Claude or VS Code, without the model reading the data | [MCP server](getting-started/mcp.md): `npx -y pivotkit-mcp`; [what reaches the model](model-data.md) |
| A PowerShell Universal app | [PowerShell Universal](getting-started/react.md#powershell-universal): `New-UDPivotReport` |
[Embed pivotkit](embed/index.md) says which package fits and what a host switches on, and has the
recipes. [What works with pivotkit](compatibility.md) lists the hosts, sign-in providers, MCP clients
and platforms, and how each one was tested.
!!! note "What pivotkit does not do"
- The report in the browser fetches no data and makes no network request. The application
passes the rows, or a person loads a file. Only the REST service and the MCP server answer
requests and fetch data. You run them yourself, and they fetch the files and HTTP APIs
you configure, or run your code. See the
[FAQ](faq.md#my-data-is-on-a-server-does-pivotkit-fetch-it).
- It is not access control. Whoever sees the report can read every row the application passes.
See [security](security.md#pivotkit-is-not-access-control).
- The report in the browser computes on the page in JavaScript. The REST service and the MCP
server compute on your server. In the browser, pivotkit is measured up to 1,000,000 rows. At
that size the first table takes 1 to 2.5 s, and the page waits meanwhile. For more rows,
aggregate on the server first. See [limits](concepts/limits.md#measured-in-the-browser).
- It draws bars, lines, area, pie, donut and heatmap, not dozens of chart types. See
[charts](use/charts.md). It ships English and German, and you can replace every text. See
[localisation](reference/localisation.md).
- It is a pivot report, not a data grid, a dashboard tool or a BI server. See the
[comparison](compare.md).
## License
MIT. The source is on [GitHub](https://github.com/eizedev/pivotkit). pivotkit draws charts with
[Apache ECharts](https://echarts.apache.org/) (Apache-2.0). pivotkit-element bundles React, ReactDOM,
@dnd-kit, ECharts, zrender, tslib and fflate under their own licenses. Its
`dist/THIRD_PARTY_LICENSES.txt` lists them. The icon and header come from
[eizedev/brand](https://github.com/eizedev/brand) and are licensed under
[CC BY 4.0](https://creativecommons.org/licenses/by/4.0/).