# Embabel Agent Observability
[](https://openjdk.org/projects/jdk/21/)
[](https://spring.io/projects/spring-boot)
[](https://opentelemetry.io/)
[](LICENSE)
**Unified observability for Embabel AI Agents** — Automatic tracing, metrics, and LLM call integration with zero code changes.
---
## See It In Action
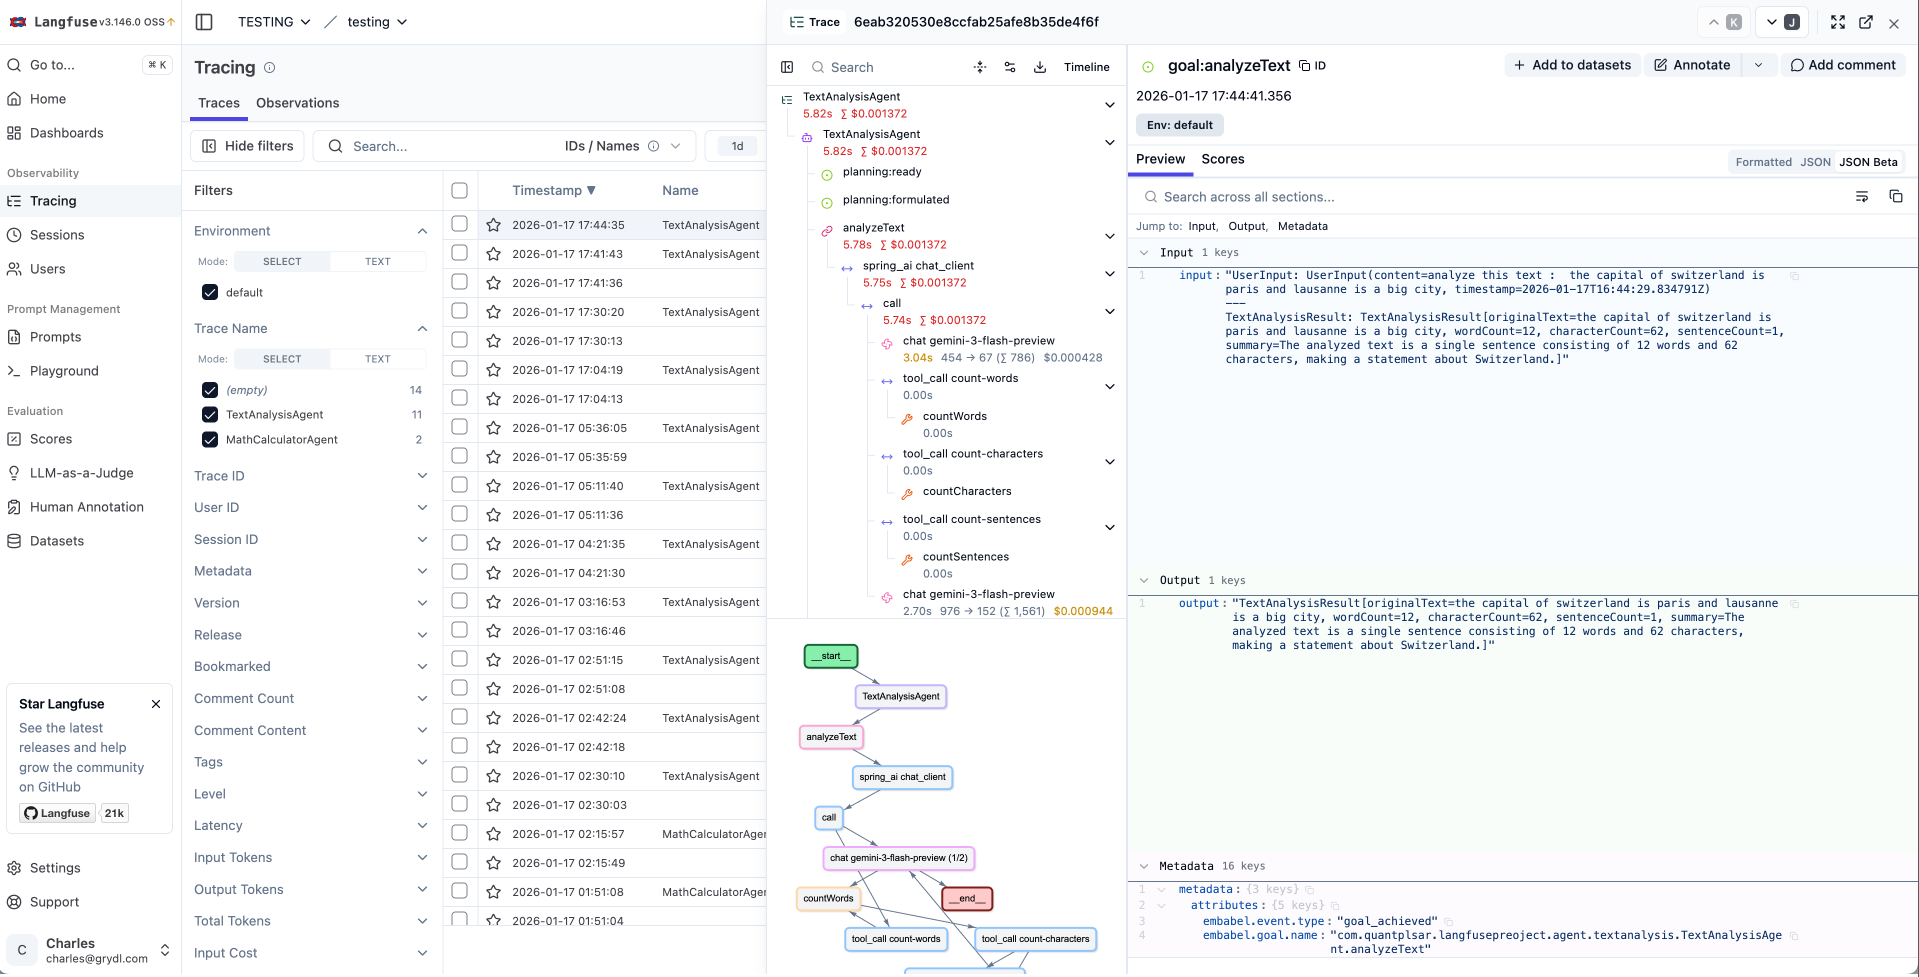
### Langfuse
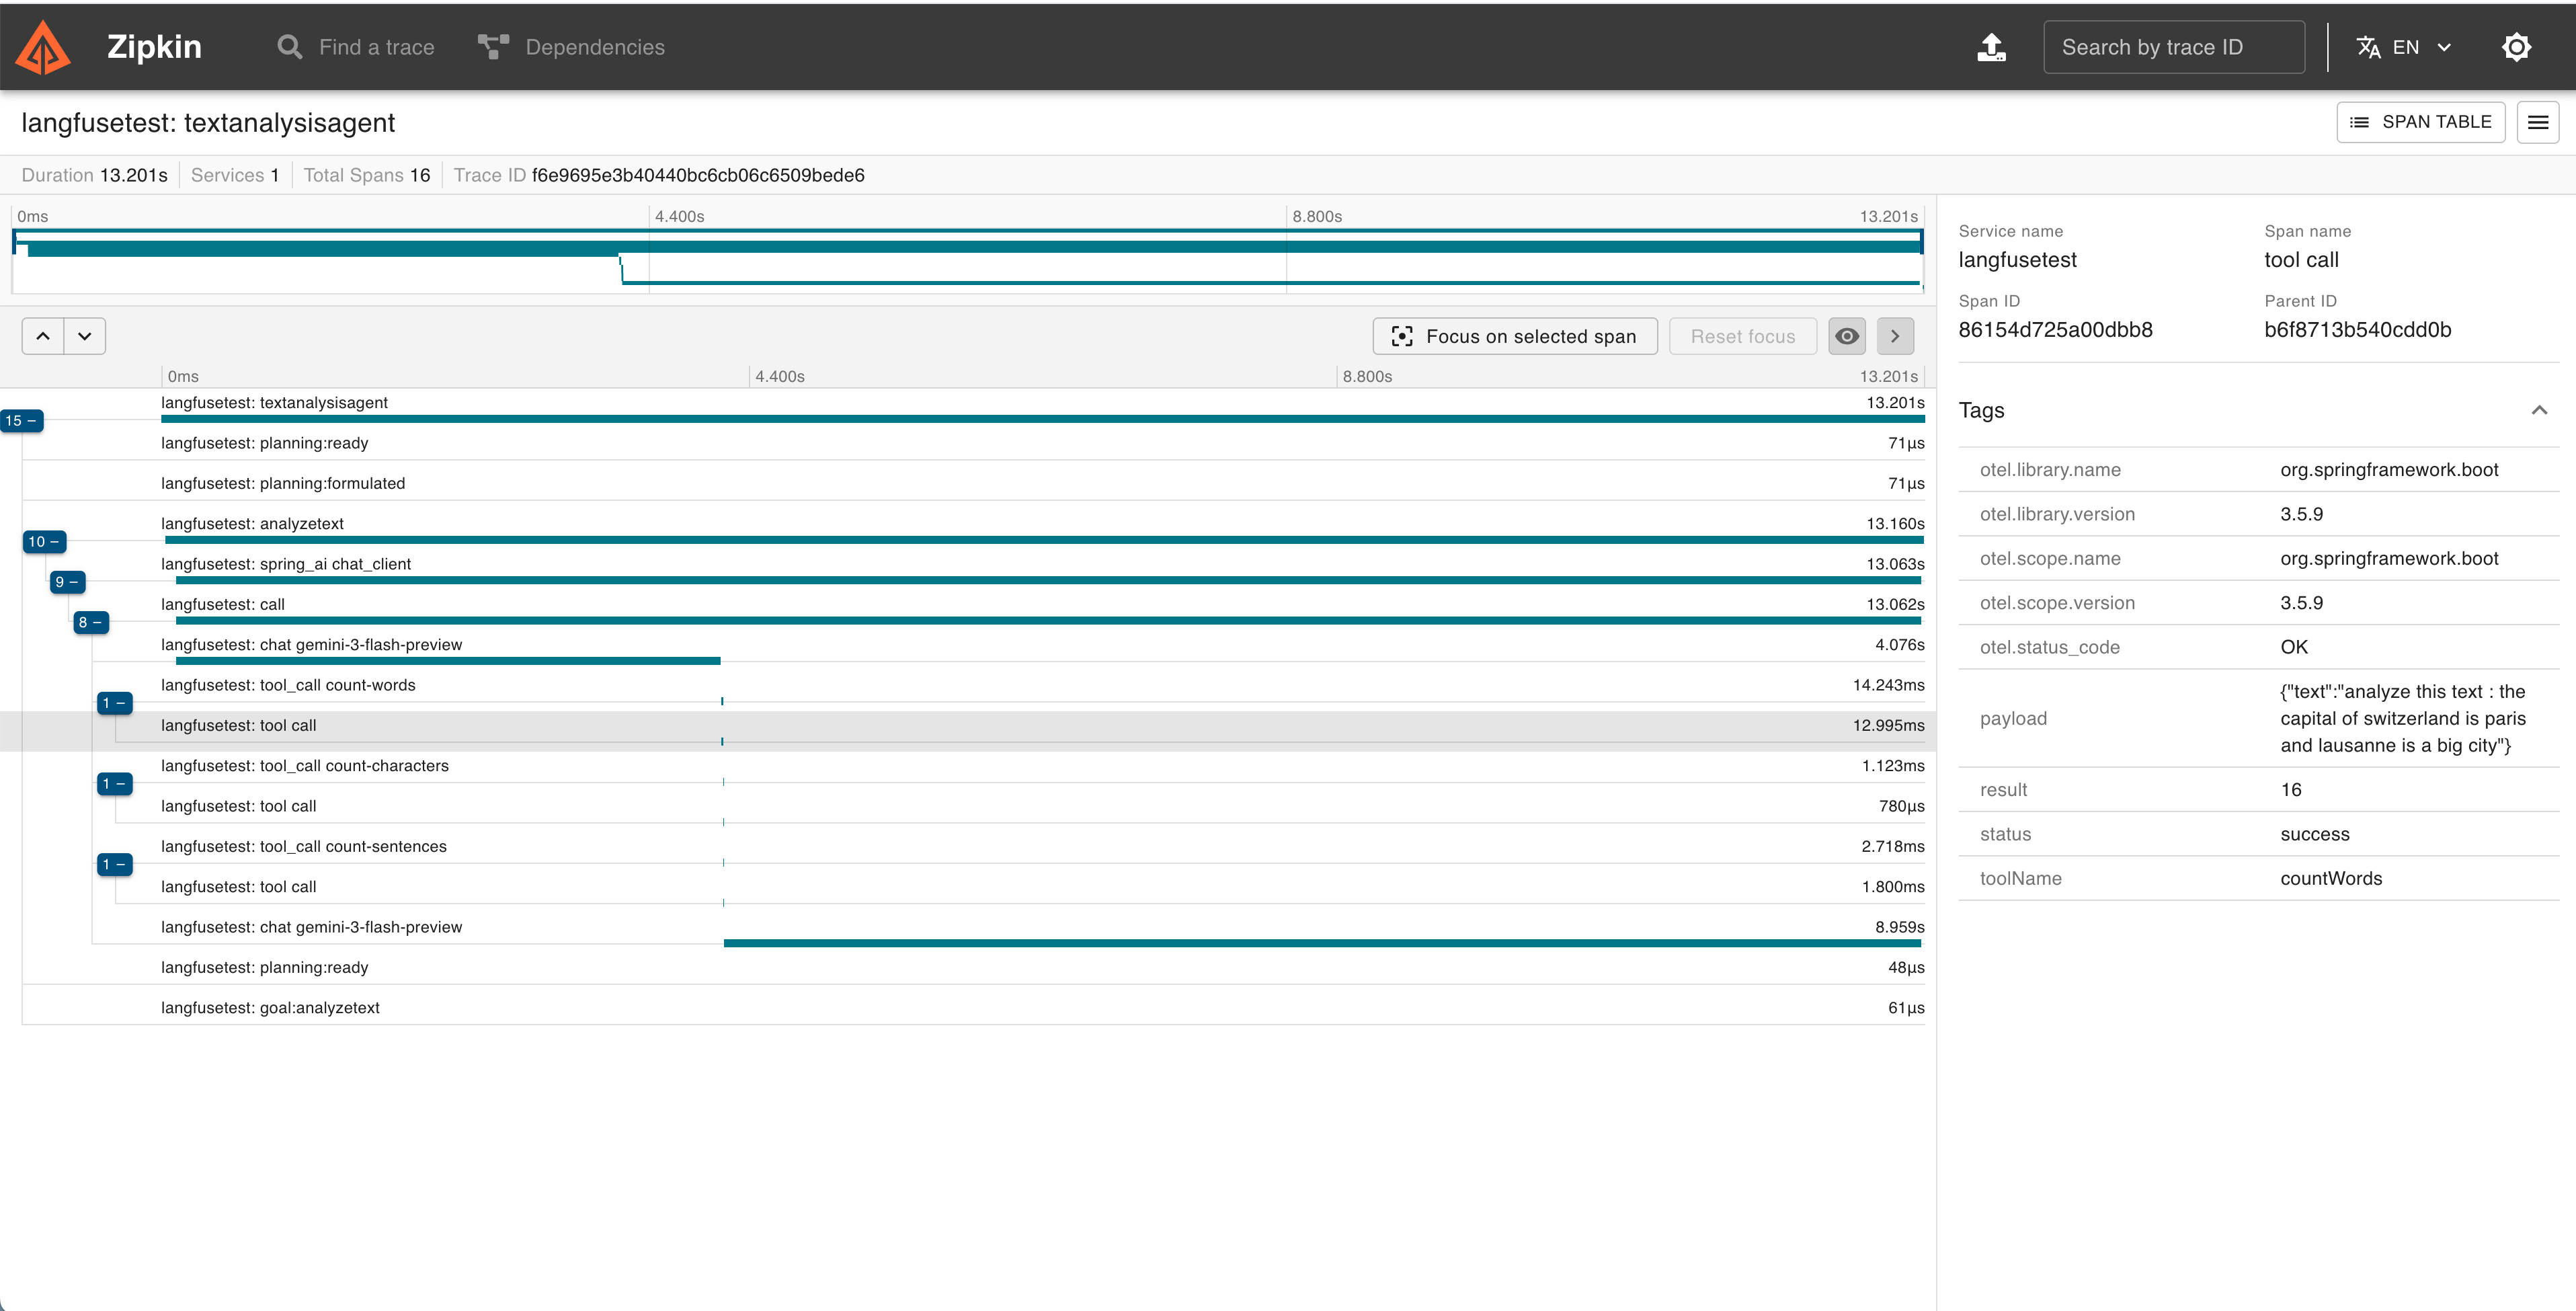
### Zipkin
---
## Quick Start
> **Note:** This library is published to the Embabel snapshot repository. Add the following repository to your `pom.xml`:
> ```xml
>
>
> embabel-snapshots
> https://repo.embabel.com/snapshots
>
> true
>
>
>
> ```
### 1. Add the core dependency
```xml
com.embabel.agent
embabel-agent-starter-observability
${embabel-agent.version}
```
### 2. Add common configuration
```yaml
# Embabel Observability
embabel:
observability:
enabled: true
service-name: my-agent-app
max-attribute-length: 4000
# Spring Boot Tracing (required)
management:
tracing:
enabled: true
sampling:
probability: 1.0 # 1.0 = 100%, 0.5 = 50%, etc.
```
### 3. Choose your exporter
Option A: Langfuse (LLM-focused observability)
```xml
com.quantpulsar
opentelemetry-exporter-langfuse
0.4.0
```
**For Langfuse Cloud:**
```yaml
management:
langfuse:
enabled: true
endpoint: https://cloud.langfuse.com/api/public/otel
public-key: pk-lf-...
secret-key: sk-lf-...
```
**For local Langfuse instance (self-hosted):**
```yaml
management:
langfuse:
enabled: true
endpoint: http://localhost:3000/api/public/otel
public-key: pk-lf-your-public-key
secret-key: sk-lf-your-secret-key
```
Option B: Zipkin (Distributed tracing)
```xml
io.opentelemetry
opentelemetry-exporter-zipkin
```
```yaml
management:
zipkin:
tracing:
endpoint: http://localhost:9411/api/v2/spans
```
Run Zipkin locally:
```bash
docker run -d -p 9411:9411 openzipkin/zipkin
```
Option C: Prometheus + Grafana (Metrics & dashboards)
```xml
io.micrometer
micrometer-registry-prometheus
```
```yaml
management:
endpoints:
web:
exposure:
include: prometheus, health, metrics
prometheus:
metrics:
export:
enabled: true
```
Metrics available at: `http://localhost:8080/actuator/prometheus`
Run Prometheus + Grafana locally:
```bash
docker run -d -p 9090:9090 prom/prometheus
docker run -d -p 3000:3000 grafana/grafana
```
Option D: OTLP (Jaeger, Grafana Tempo, etc.)
```xml
io.opentelemetry
opentelemetry-exporter-otlp
```
```yaml
management:
otlp:
tracing:
endpoint: http://localhost:4317
```
### 4. Done!
Your agents are now fully traced. No code changes required.
---
## Features
### Implemented
| Feature | Description |
|---------|-------------|
| **Agent Lifecycle Tracing** | Full trace of agent creation, execution, completion, failures, and process kill |
| **Sub-agent Hierarchy** | Proper parent-child span relationships for sub-agents |
| **Action Tracing** | Each action execution as a child span with duration, status, and declared inputs |
| **LLM Call Spans** | Dedicated spans per LLM interaction with model name, hyperparameters (`temperature`, `max_tokens`, `top_p`), provider, input messages, and output |
| **Tool Loop Tracing** | Spans for tool loop execution with iteration count, max iterations, tool list, and replan status |
| **Tool Call Tracing** | Every tool invocation with input/output capture, correlation ID, and tool group metadata |
| **LLM Call Integration** | Spring AI ChatModel calls automatically appear as child spans via `ChatModelObservationFilter` |
| **LLM Token Metrics** | Input/output token usage and cost via Spring AI observations |
| **Planning Events** | Track plan formulation, replanning iterations, and replan requests with reasons |
| **RAG Pipeline Tracing** | Full RAG event tracing: request, response, pipeline stages, and enhancement steps |
| **Ranking Events** | Agent routing decisions: ranking requests, choices made (with score), and failures (with confidence cutoff) |
| **Dynamic Agent Creation Tracing** | Platform events for dynamically created agents |
| **State Transitions** | Monitor workflow state changes |
| **Lifecycle States** | Visibility into WAITING, PAUSED, STUCK states |
| **Multi-Exporter Support** | Send traces to multiple backends simultaneously |
| **Automatic Metrics** | Duration and count metrics (Spring Observation mode) |
| **Business Metrics** | Micrometer counters/gauges: active agents, LLM tokens, cost, errors, replanning |
| **OpenTelemetry GenAI Semantic Conventions** | Consistent `gen_ai.*` attributes across all spans (`gen_ai.operation.name`, `gen_ai.request.model`, `gen_ai.tool.name`, etc.) |
| **ChatModel Observation Filter** | Enriches Spring AI observations with prompts, completions, token counts, and model info |
| **`@Tracked` Annotation** | Custom operation tracking with automatic span creation |
| **MDC Log Correlation** | Automatic SLF4J MDC propagation of agent context (run ID, agent name, action name) |
### Coming Soon
| Feature | Target |
|---------|--------|
| Pre-built Grafana Dashboards | v1.0.x |
---
## Supported Backends
| Backend | Type | Module |
|---------|------|--------|
| **Langfuse** | Traces | [`opentelemetry-exporter-langfuse`](https://github.com/quantpulsar/opentelemetry-exporter-langfuse) |
| **Zipkin** | Traces | [`opentelemetry-exporter-zipkin`](https://github.com/open-telemetry/opentelemetry-java) |
| **OTLP** (Jaeger, Tempo) | Traces | [`opentelemetry-exporter-otlp`](https://github.com/open-telemetry/opentelemetry-java) |
| **Prometheus** | Metrics | [`micrometer-registry-prometheus`](https://github.com/micrometer-metrics/micrometer) |
| **Custom** | Traces | Implement `SpanExporter` |
> **Tip:** You can use multiple exporters simultaneously (e.g., Langfuse for traces + Prometheus for metrics).
---
## Configuration
| Property | Default | Description |
|----------|---------|-------------|
| `embabel.observability.enabled` | `true` | Enable/disable observability |
| `embabel.observability.service-name` | `embabel-agent` | Service name in traces |
| `embabel.observability.trace-agent-events` | `true` | Trace agent lifecycle |
| `embabel.observability.trace-tool-calls` | `true` | Trace tool invocations (see note below) |
| `embabel.observability.trace-tool-loop` | `true` | Trace tool loop execution |
| `embabel.observability.trace-llm-calls` | `true` | Trace LLM calls |
| `embabel.observability.trace-planning` | `true` | Trace planning events |
| `embabel.observability.trace-state-transitions` | `true` | Trace state transitions |
| `embabel.observability.trace-lifecycle-states` | `true` | Trace WAITING/PAUSED/STUCK states |
| `embabel.observability.trace-rag` | `true` | Trace RAG events (request, response, pipeline) |
| `embabel.observability.trace-ranking` | `true` | Trace ranking/selection events (agent routing) |
| `embabel.observability.trace-dynamic-agent-creation` | `true` | Trace dynamic agent creation events |
| `embabel.observability.trace-http-details` | `true` | Trace HTTP request/response details (bodies, headers) |
| `embabel.observability.trace-tracked-operations` | `true` | Enable/disable `@Tracked` annotation aspect |
| `embabel.observability.mdc-propagation` | `true` | Propagate agent context into SLF4J MDC for log correlation |
| `embabel.observability.metrics-enabled` | `true` | Enable/disable Micrometer business metrics |
| `embabel.observability.max-attribute-length` | `4000` | Max attribute length before truncation |
### Tool Observability Note
> **Important:** Embabel Agent already includes built-in tool observability via `ObservabilityToolCallback`, which provides Micrometer observations for tool calls.
>
> If you prefer to use Embabel's native tool observability instead of this library's implementation, set:
> ```yaml
> embabel:
> observability:
> trace-tool-calls: false
> ```
> This avoids duplicate tool call spans and lets Embabel Agent handle tool tracing directly.
---
## How It Works
```
┌─────────────────────────────────────────────────────────────┐
│ EMBABEL AGENT │
│ ┌─────────┐ ┌─────────┐ ┌───────┐ ┌──────────┐ │
│ │ Agent │ │ Actions │ │ Tools │ │ Planning │ │
│ └────┬────┘ └────┬────┘ └───┬───┘ └────┬─────┘ │
└────────┼────────────┼───────────┼───────────┼──────────────┘
│ │ │ │
└────────────┴─────┬─────┴───────────┘
│
┌────────▼────────┐
│ Event Listeners │
└────────┬────────┘
│
┌───────────────────────┼───────────────────────┐
│ Tracing Listener │ Metrics Listener │
│ │ │
▼ ▼ │
┌────────────┐ ┌──────────────┐ │
│ SPRING │ │ MICROMETER │ │
│OBSERVATION │ │ BUSINESS │ │
│(traces + │ │ METRICS │ │
│ metrics) │ └──────┬───────┘ │
└───┬────────┘ │ │
│ ┌────────▼────────┐ │
│ │ MeterRegistry │ │
│ │ (Prometheus...) │ │
│ └─────────────────┘ │
│ │
▼ │
┌─────────────────────┐ │
│ OpenTelemetry │ │
│ SpanExporter │ │
└─────────┬───────────┘ │
│ │
┌────────┼──────────┬──────────┐ │
▼ ▼ ▼ ▼ │
┌────────┐┌────────┐┌────────┐┌────────┐ │
│Langfuse││ Zipkin ││ OTLP ││ Custom │ │
└────────┘└────────┘└────────┘└────────┘ │
└───────────────────────────────────────────────────┘
```
**Key Points:**
- Automatically captures all Embabel Agent events (agent lifecycle, actions, LLM calls, tool loops, tools, planning, RAG, ranking, dynamic agents)
- Spring AI LLM calls appear as children of action spans via `ChatModelObservationFilter` and `EmbabelTracingObservationHandler`
- Proper parent-child hierarchy: Agent → Action → LLM → Tool Loop → ChatModel → Tool
- Zero code instrumentation required
- Multiple exporters can run simultaneously
- OpenTelemetry GenAI semantic conventions (`gen_ai.*`) for interoperability with LLM observability platforms
---
## Trace Hierarchy Example
```
Agent: CustomerServiceAgent (trace root)
├── planning:formulated [iteration=1, actions=3]
├── Action: AnalyzeRequest
│ ├── llm:gpt-4 [temperature=0.7, max_tokens=4096]
│ │ ├── tool-loop:AnalyzeRequest-RequestAnalysis-1
│ │ │ ├── ChatModel: gpt-4 (Spring AI - via ChatModelObservationFilter)
│ │ │ └── tool:searchKnowledgeBase [status=success]
│ │ └── tool-loop completed [iterations=2, replan=false]
│ └── llm completed [duration=1200ms]
├── Action: GenerateResponse
│ ├── llm:gpt-4
│ │ ├── tool-loop:GenerateResponse-Response-2
│ │ │ └── ChatModel: gpt-4 (Spring AI)
│ │ └── tool-loop completed [iterations=1]
│ └── llm completed [duration=800ms]
├── goal:achieved [RequestProcessed]
└── status: completed [duration=2340ms]
```
### Sub-agent Hierarchy
```
Agent: OrchestratorAgent (trace root)
├── Action: DelegateToSpecialist
│ └── Agent: SpecialistAgent (sub-agent, child of parent action)
│ ├── Action: SpecializedTask
│ │ └── llm:claude-3.5-sonnet
│ └── status: completed
└── status: completed
```
---
## Custom Operation Tracking with `@Tracked`
For tracking custom operations in your agent code, use the `@Tracked` annotation. It automatically creates observability spans capturing inputs, outputs, duration, and errors.
### Basic Usage
```java
@Tracked("enrichCustomer")
public Customer enrich(Customer input) {
// Your logic here
}
```
### With Type and Description
```java
@Tracked(value = "callPaymentApi", type = TrackType.EXTERNAL_CALL, description = "Payment gateway call")
public PaymentResult processPayment(Order order) {
// ...
}
```
### Available Track Types
| Type | Description |
|------|-------------|
| `CUSTOM` | General-purpose (default) |
| `PROCESSING` | Data processing operation |
| `VALIDATION` | Validation or verification step |
| `TRANSFORMATION` | Data transformation |
| `EXTERNAL_CALL` | External service/API call |
| `COMPUTATION` | Computation or calculation |
### What Gets Captured
- **Operation name** (from `value` or method name)
- **Method arguments with parameter names** (e.g., `{query=hello, limit=10}`, truncated to `max-attribute-length`)
- **Return value** (truncated to 256 chars)
- **Duration** (automatic)
- **Errors** (automatic, with stack trace)
- **Agent context** (runId, agent name — when inside an agent process)
> **Note:** Parameter names are automatically resolved via the method signature. If parameter names are not available (e.g., compiled without `-parameters` flag and no debug info), the output falls back to array format: `[hello, 10]`.
### Trace Hierarchy
When `@Tracked` methods are called within an agent execution, spans are automatically nested under the current action or agent span:
```
Agent: CustomerServiceAgent
├── Action: ProcessOrder
│ ├── @Tracked: enrichCustomer (PROCESSING)
│ ├── ChatModel: gpt-4
│ └── @Tracked: callPaymentApi (EXTERNAL_CALL)
└── status: completed
```
### Important: Spring AOP Proxy Limitation
`@Tracked` uses Spring AOP, which is proxy-based. This means **internal method calls within the same class are not intercepted**:
```java
@Component
public class MyService {
@Tracked("step1")
public String step1() { return "ok"; }
public void process() {
step1(); // this.step1() — bypasses the proxy, @Tracked NOT triggered!
}
}
```
**Workarounds** (from simplest to most complete):
**1. Extract to a separate bean (recommended):**
```java
@Component
public class MyService {
private final MyTrackedOps ops; // injected by Spring
public void process() {
ops.step1(); // goes through the proxy — @Tracked works!
}
}
@Component
public class MyTrackedOps {
@Tracked("step1")
public String step1() { return "ok"; }
}
```
**2. Self-injection:**
```java
@Component
public class MyService {
@Autowired
private MyService self; // Spring injects the proxy, not this
public void process() {
self.step1(); // goes through the proxy — @Tracked works!
}
@Tracked("step1")
public String step1() { return "ok"; }
}
```
---
## MDC Propagation for Log Correlation
Embabel Agent context is automatically propagated into SLF4J MDC, making it easy to filter and correlate application logs by agent run or action.
### MDC Keys
| MDC Key | Description | Set on | Removed on |
|---------|-------------|--------|------------|
| `embabel.agent.run_id` | Agent process ID | Agent creation | Agent completed/failed/killed |
| `embabel.agent.name` | Agent name | Agent creation | Agent completed/failed/killed |
| `embabel.action.name` | Current action name | Action start | Action result |
### Logback Pattern Example
```xml
%d{HH:mm:ss.SSS} [%thread] %-5level %logger{36} [runId=%X{embabel.agent.run_id} agent=%X{embabel.agent.name} action=%X{embabel.action.name}] - %msg%n
```
This produces logs like:
```
14:23:45.123 [main] INFO c.e.MyService [runId=abc-123 agent=CustomerServiceAgent action=AnalyzeRequest] - Processing request
```
To disable MDC propagation:
```yaml
embabel:
observability:
mdc-propagation: false
```
---
## Business Metrics (Micrometer)
When a `MeterRegistry` is available (e.g. via `micrometer-registry-prometheus`), the module automatically registers the following business metrics, independent of the tracing implementation chosen:
| Metric | Type | Tags | Description |
|--------|------|------|-------------|
| `embabel.agent.active` | Gauge | — | Number of agent processes currently running |
| `embabel.agent.errors.total` | Counter | `agent` | Total agent process failures |
| `embabel.llm.tokens.total` | Counter | `agent`, `direction` (input/output) | LLM tokens consumed |
| `embabel.llm.cost.total` | Counter | `agent` | Estimated LLM cost in USD |
| `embabel.tool.errors.total` | Counter | `tool` | Tool call failures by tool name |
| `embabel.planning.replanning.total` | Counter | `agent` | Replanning events |
These metrics are exploitable by **Prometheus** and **Grafana** out of the box. To disable:
```yaml
embabel:
observability:
metrics-enabled: false
```
---
## Roadmap
| Phase | Version | Features |
|-------|---------|----------|
| **Current** | v0.3.x | Agent, Action, Tool, LLM, Tool Loop, Planning, State, RAG, Ranking, Dynamic Agent Creation tracing. Business metrics, MDC propagation, `@Tracked` annotation, ChatModel filter, GenAI semantic conventions. |
| **Long Term** | v1.0.x | Pre-built Grafana dashboards, alerting, cost analytics |
---
## Documentation
For detailed technical documentation, architecture details, and API reference:
**[Technical Guide](docs/TECHNICAL_GUIDE.md)**
---
## Requirements
- Java 21+
- Spring Boot 3.5+
- Embabel Agent 0.3.3+
---
## License
Apache License 2.0 - See [LICENSE](LICENSE) for details.
---
## Contributing
Contributions are welcome! You can help by:
- Reporting bugs or suggesting features
- Submitting pull requests
- Adding or improving tests
---