---
`playwright-opentelemetry` records a Playwright test as OpenTelemetry spans, captures the browser activity around it, and propagates W3C trace context from browser requests into your instrumented backend. The result is one connected trace, shaped by a named test, that you can view alongside Playwright's screenshot filmstrip.

## Why
A failing end-to-end test shows you everything the browser saw and nothing about why it failed. The real cause is usually beyond the network boundary: an application handler, a failed queue consumer, a database query that never ran.
When the test itself starts a distributed trace, it becomes the root of every instrumented service the user journey touched:
```text
Playwright test
-> test step
-> browser request + traceparent
-> application request
-> service call
-> database query
```
One trace ID connects the failed step to everything that ran beneath it.
## How it works
A trace is produced by three sources of spans:
- The **reporter** turns each retained test attempt into a root `playwright.test` span, with steps, hooks, fixtures, and actions as child spans.
- The **fixture** records browser activity (navigations, requests, console messages, page errors) as spans and injects a W3C `traceparent` header into browser requests.
- Your **backend spans**: the fixture's reach stops at the browser, but any service already instrumented with OpenTelemetry that honors the propagated `traceparent` header attaches its spans beneath the test automatically.
This repo ships the reporter and fixture, plus tooling for viewing and storing the traces they produce:
| Package | What it does |
| --------------------------------------------------------- | ------------------------------------------------------------------------------------------------------------------------------------------------------------------------------------------------------------------------------------------------------------------- |
| [`playwright-opentelemetry`](reporter/) | The **reporter** and **fixture** to produce OpenTelemetry traces. |
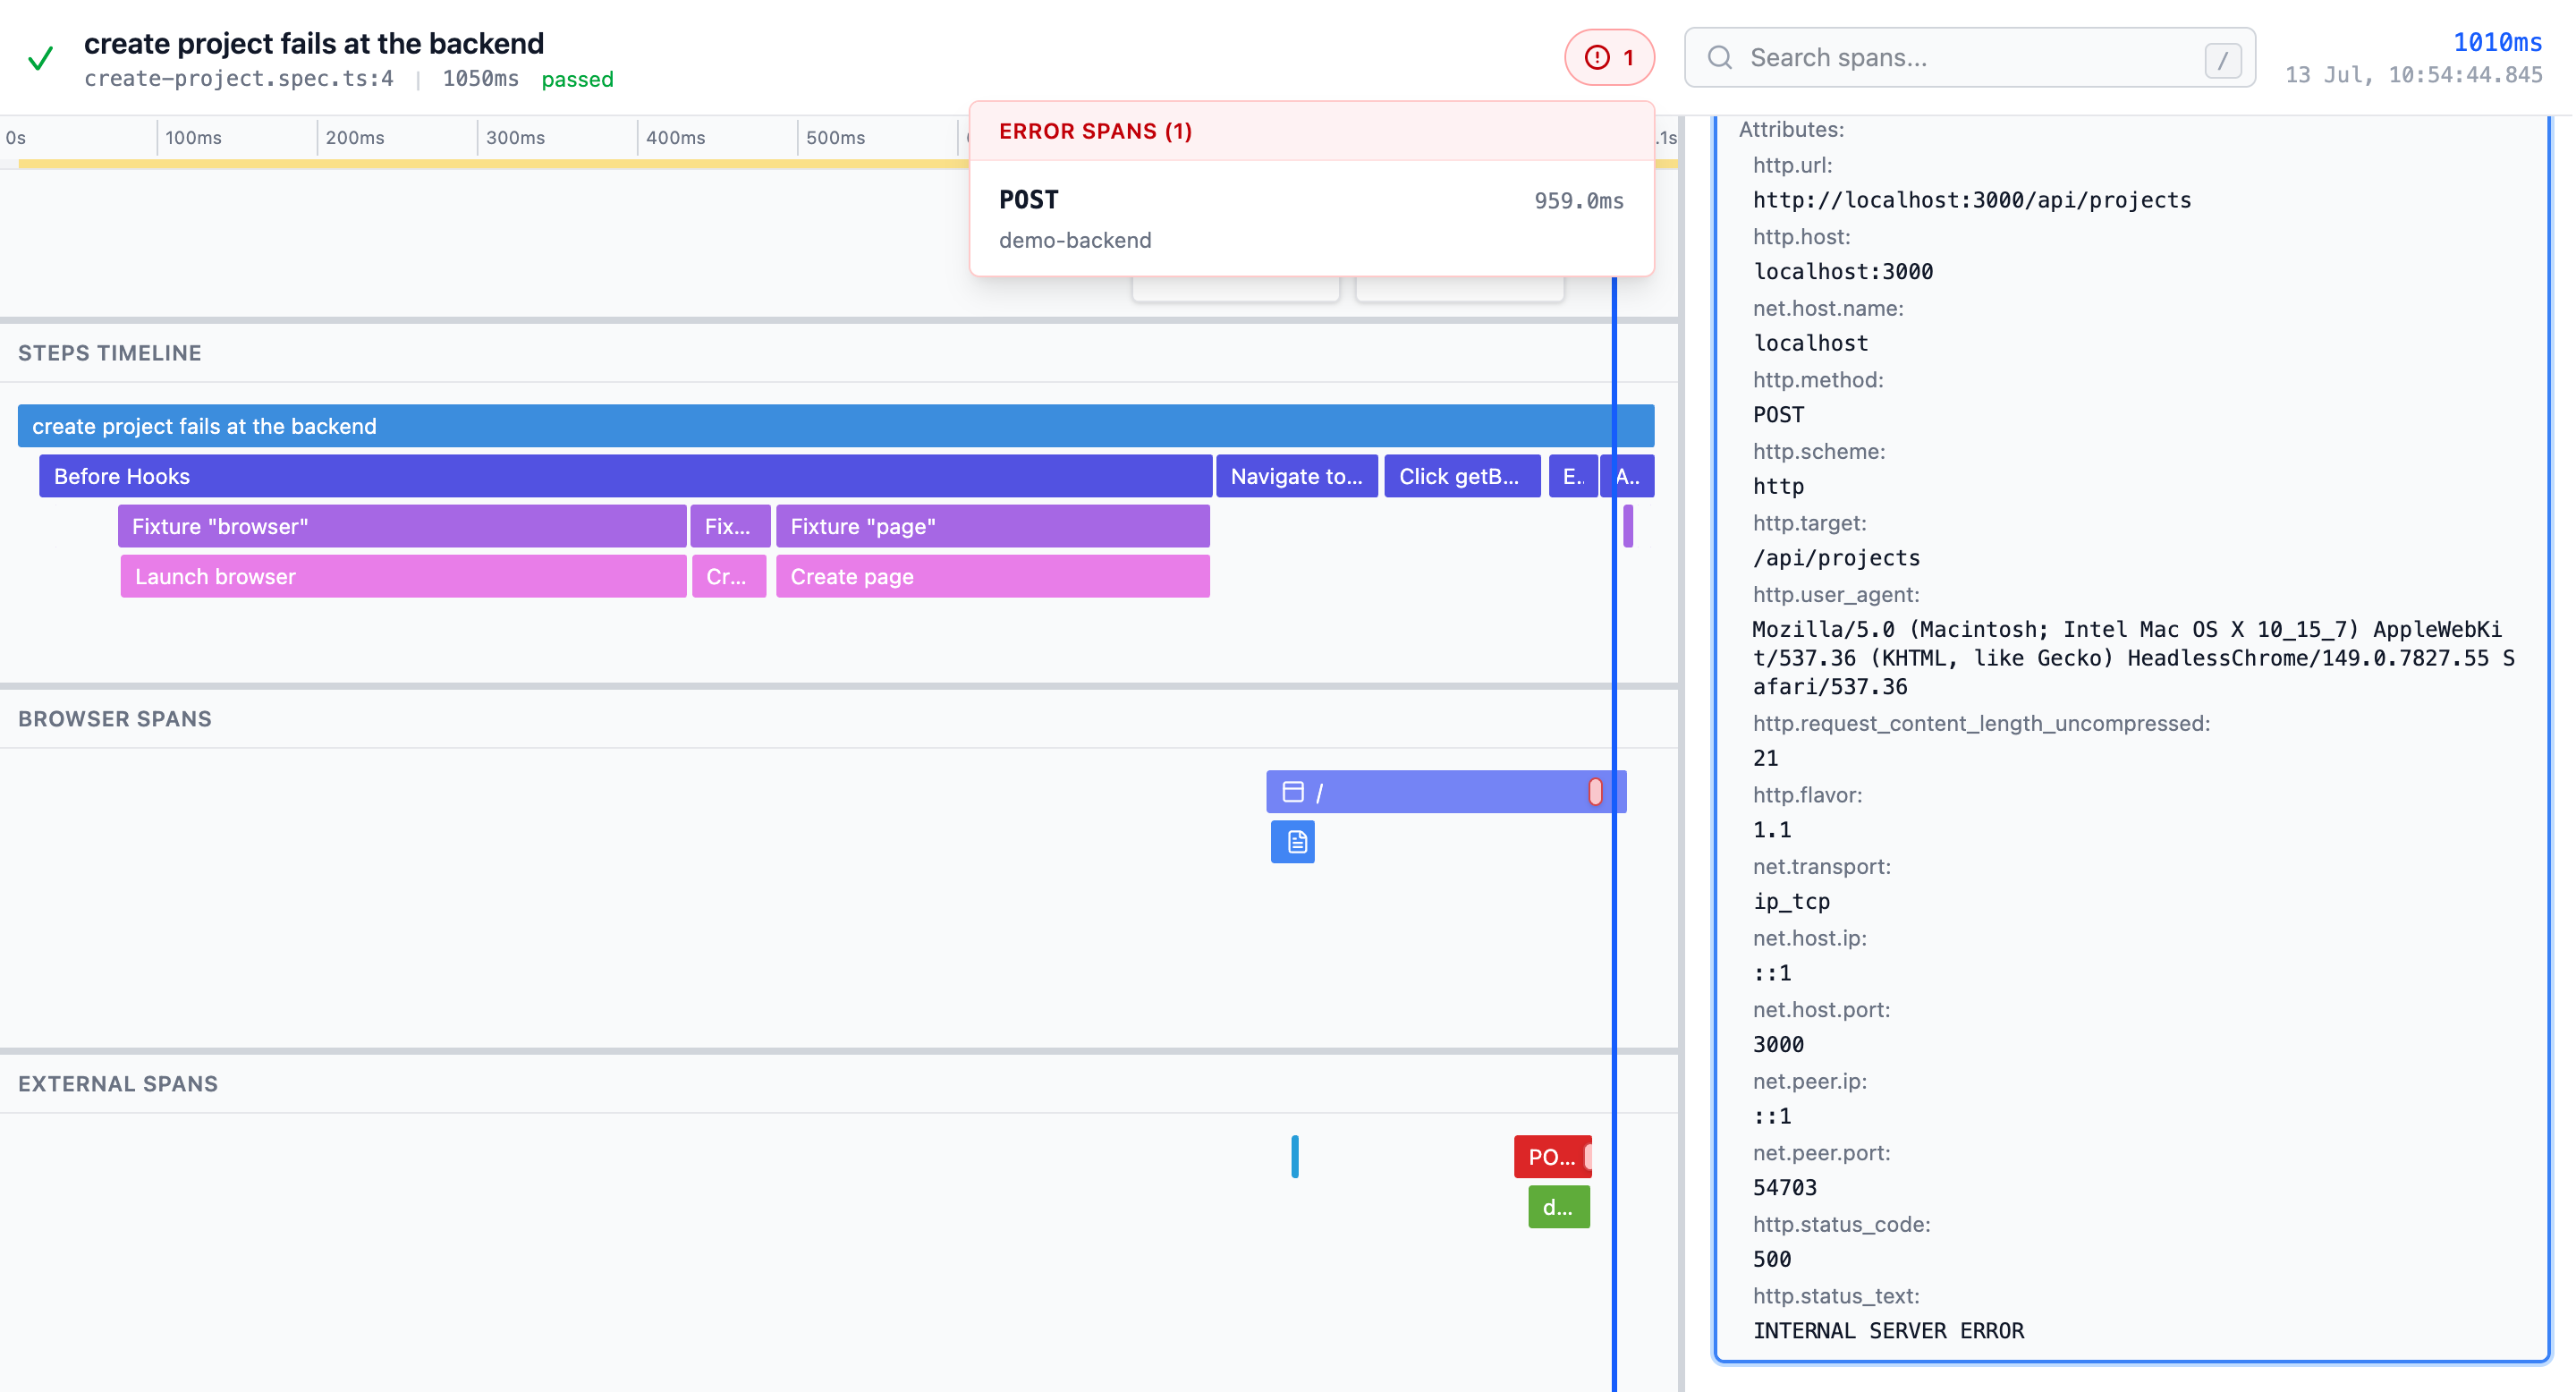
| [`@playwright-opentelemetry/trace-viewer`](trace-viewer/) | A **trace viewer** for OpenTelemetry trace data rendered alongside Playwright's screenshot filmstrip: a time-aligned flame graph split into test steps, browser spans, and external (backend) spans. Also [hosted at trace.endform.dev](https://trace.endform.dev). |
| [`@playwright-opentelemetry/trace-api`](trace-api/) | An **OTLP-compatible Trace API** that makes it easy to store trace data together with the screenshot artifacts, backed by S3-compatible object storage. Deployable to Cloudflare Workers, Deno, Bun, or Node.js. |
## Quick start
Install the package:
```bash
npm install --save-dev playwright-opentelemetry
```
Add the reporter and choose where the trace data goes in your Playwright config:
```ts
import { defineConfig } from "@playwright/test";
import type {
PlaywrightOpentelemetryConfig,
PlaywrightOpentelemetryUseOptions,
} from "playwright-opentelemetry/fixture";
const playwrightOpentelemetry: PlaywrightOpentelemetryConfig = {
// Send to any OTLP destination, for example, Honeycomb.
// You can also set the OTEL_EXPORTER_OTLP_ENDPOINT environment variable,
// which takes precedence over this otlpEndpoint if both are set.
otlpEndpoint: {
url: "https://api.eu1.honeycomb.io/v1/traces",
headers: {
"x-honeycomb-team": "your-api-key",
},
},
// Or write a local OpenTelemetry trace ZIP instead of, or alongside, OTLP.
storeTraceZip: true,
};
export default defineConfig({
reporter: [["playwright-opentelemetry/reporter"]],
use: {
playwrightOpentelemetry,
// OpenTelemetry output follows Playwright's trace retention.
trace: "retain-on-failure",
},
});
```
Switch your tests to the instrumented fixture:
```ts
import { expect } from "@playwright/test";
import { test } from "playwright-opentelemetry/fixture";
test("has title", async ({ page }) => {
await page.goto("https://playwright.dev/");
await expect(page).toHaveTitle(/Playwright/);
});
```
Run your suite, then open the resulting trace ZIP in the [hosted viewer](https://trace.endform.dev). To see the result before configuring anything, [open the example trace](https://trace.endform.dev/?traceSource=https%3A%2F%2Fdemo-traces.endform.dev%2Fotel-traces%2Fplaywright-tutorial%2Fpayment-server-error%2Fv1.zip).
You can also boot the viewer locally:
```bash
npx @playwright-opentelemetry/trace-viewer
```
Two things set the boundary on what you will see. Connected backend spans require services that are already instrumented with OpenTelemetry and honor the propagated trace context. Screenshots are captured by the fixture, so tests need to use its `test`.
## Usage
Two things need to be set up for complete OpenTelemetry tracing:
1. A **reporter** that sends traces to your provider of choice
2. A **fixture** that propagates trace context to enable nested spans
### Configure the reporter
```ts
import { defineConfig, devices } from "@playwright/test";
import type {
PlaywrightOpentelemetryConfig,
PlaywrightOpentelemetryUseOptions,
} from "playwright-opentelemetry/fixture";
const playwrightOpentelemetry: PlaywrightOpentelemetryConfig = {
// Or use environment variable OTEL_EXPORTER_OTLP_ENDPOINT
otlpEndpoint: {
url: "https://api.eu1.honeycomb.io/v1/traces",
// Or use environment variable OTEL_EXPORTER_OTLP_HEADERS
headers: {
"x-honeycomb-team": "xxxabc",
},
},
// Add more OTLP traces endpoints:
// otlpEndpoints: [{ url: "https://collector-a.example.com/v1/traces", trace: "on" }],
// Or output an opentelemetry report zip
storeTraceZip: true,
// Defaults to true. When enabled, browser requests receive a W3C
// traceparent header that makes downstream spans children of the
// Playwright-generated test trace. Export Playwright telemetry to the
// same backend as your app telemetry to avoid missing root spans.
propagateTraceHeaders: true,
// Optional. Defaults to following Playwright's trace setting below.
// trace: "on",
};
export default defineConfig({
// ... other Playwright config
reporter: [["playwright-opentelemetry/reporter"]],
use: {
playwrightOpentelemetry,
// Playwright trace retention. OpenTelemetry output follows this unless
// playwrightOpentelemetry.trace is configured above.
trace: "retain-on-failure",
},
// ... rest of Playwright config
});
```
The current implementation sends OTLP/HTTP JSON payloads to configurable trace endpoints, so check that your destination accepts that transport before you wire it up.
### Configure the fixture
```ts
import { expect } from "@playwright/test";
import { test } from "playwright-opentelemetry/fixture";
test("has title", async ({ page }) => {
await page.goto("https://playwright.dev/");
await expect(page).toHaveTitle(/Playwright/);
});
```
### Screenshots
The fixture captures screenshots of every page in a test through Playwright's [`page.screencast`](https://playwright.dev/docs/api/class-screencast) API, sharing the browser's existing screencast rather than starting a second one. They are stored with the trace and follow the [trace retention](#trace-retention) settings. They don't depend on Playwright's own trace screenshots, so you can set `screenshots: false` in Playwright's `trace` option.
Tests can still use `page.screencast` themselves. To turn screenshots off, set `use.playwrightOpentelemetry.screenshots` to `false`.
> On Playwright versions before 1.61, screenshots are read from Playwright's trace instead, so keep Playwright's trace screenshots on (for example `trace: "on"`).
### Trace retention
By default, reporter output follows Playwright trace retention. If Playwright does not produce or retain a `trace` attachment for a test, `playwright-opentelemetry` will not send OTLP data, upload Trace API data, or write a local `*-pw-otel.zip` for that test.
Configure `use.trace` to control when Playwright traces and OpenTelemetry output are produced:
- `trace: "on"` exports every test.
- `trace: "retain-on-failure"` exports failed or unexpected tests.
- `trace: "on-first-retry"` exports first retries.
- `trace: "off"` exports nothing.
To control OpenTelemetry output independently, set `use.playwrightOpentelemetry.trace`. It accepts the same values as Playwright's `use.trace` and overrides Playwright's trace setting for both the fixture and reporter:
```ts
export default defineConfig({
use: {
playwrightOpentelemetry: {
trace: "on",
},
trace: "retain-on-failure",
},
});
```
You can also override trace retention for individual OpenTelemetry destinations. A destination-level `trace` setting overrides `use.playwrightOpentelemetry.trace` for that endpoint only. For example, you can keep local trace zips limited to failures while sending every test attempt to a specific OTLP backend:
```ts
export default defineConfig({
use: {
playwrightOpentelemetry: {
trace: "retain-on-failure",
storeTraceZip: true,
otlpEndpoint: {
url: "https://all-traces.example.com/v1/traces",
trace: "on",
},
},
trace: "retain-on-failure",
},
});
```
Note: `storeTraceZip` follows only the top-level trace setting.
### Viewing a trace
Open the [example trace](https://trace.endform.dev/?traceSource=https%3A%2F%2Fdemo-traces.endform.dev%2Fotel-traces%2Fplaywright-tutorial%2Fpayment-server-error%2Fv1.zip) to explore a complete failure with connected Playwright, browser, and backend spans, or go to the [hosted trace viewer](https://trace.endform.dev) to load your own trace ZIP.
Or boot your own locally:
```bash
npx @playwright-opentelemetry/trace-viewer
```
This boots the trace viewer on `localhost:9294`. Then load your ZIP file or an API URL responding with telemetry.
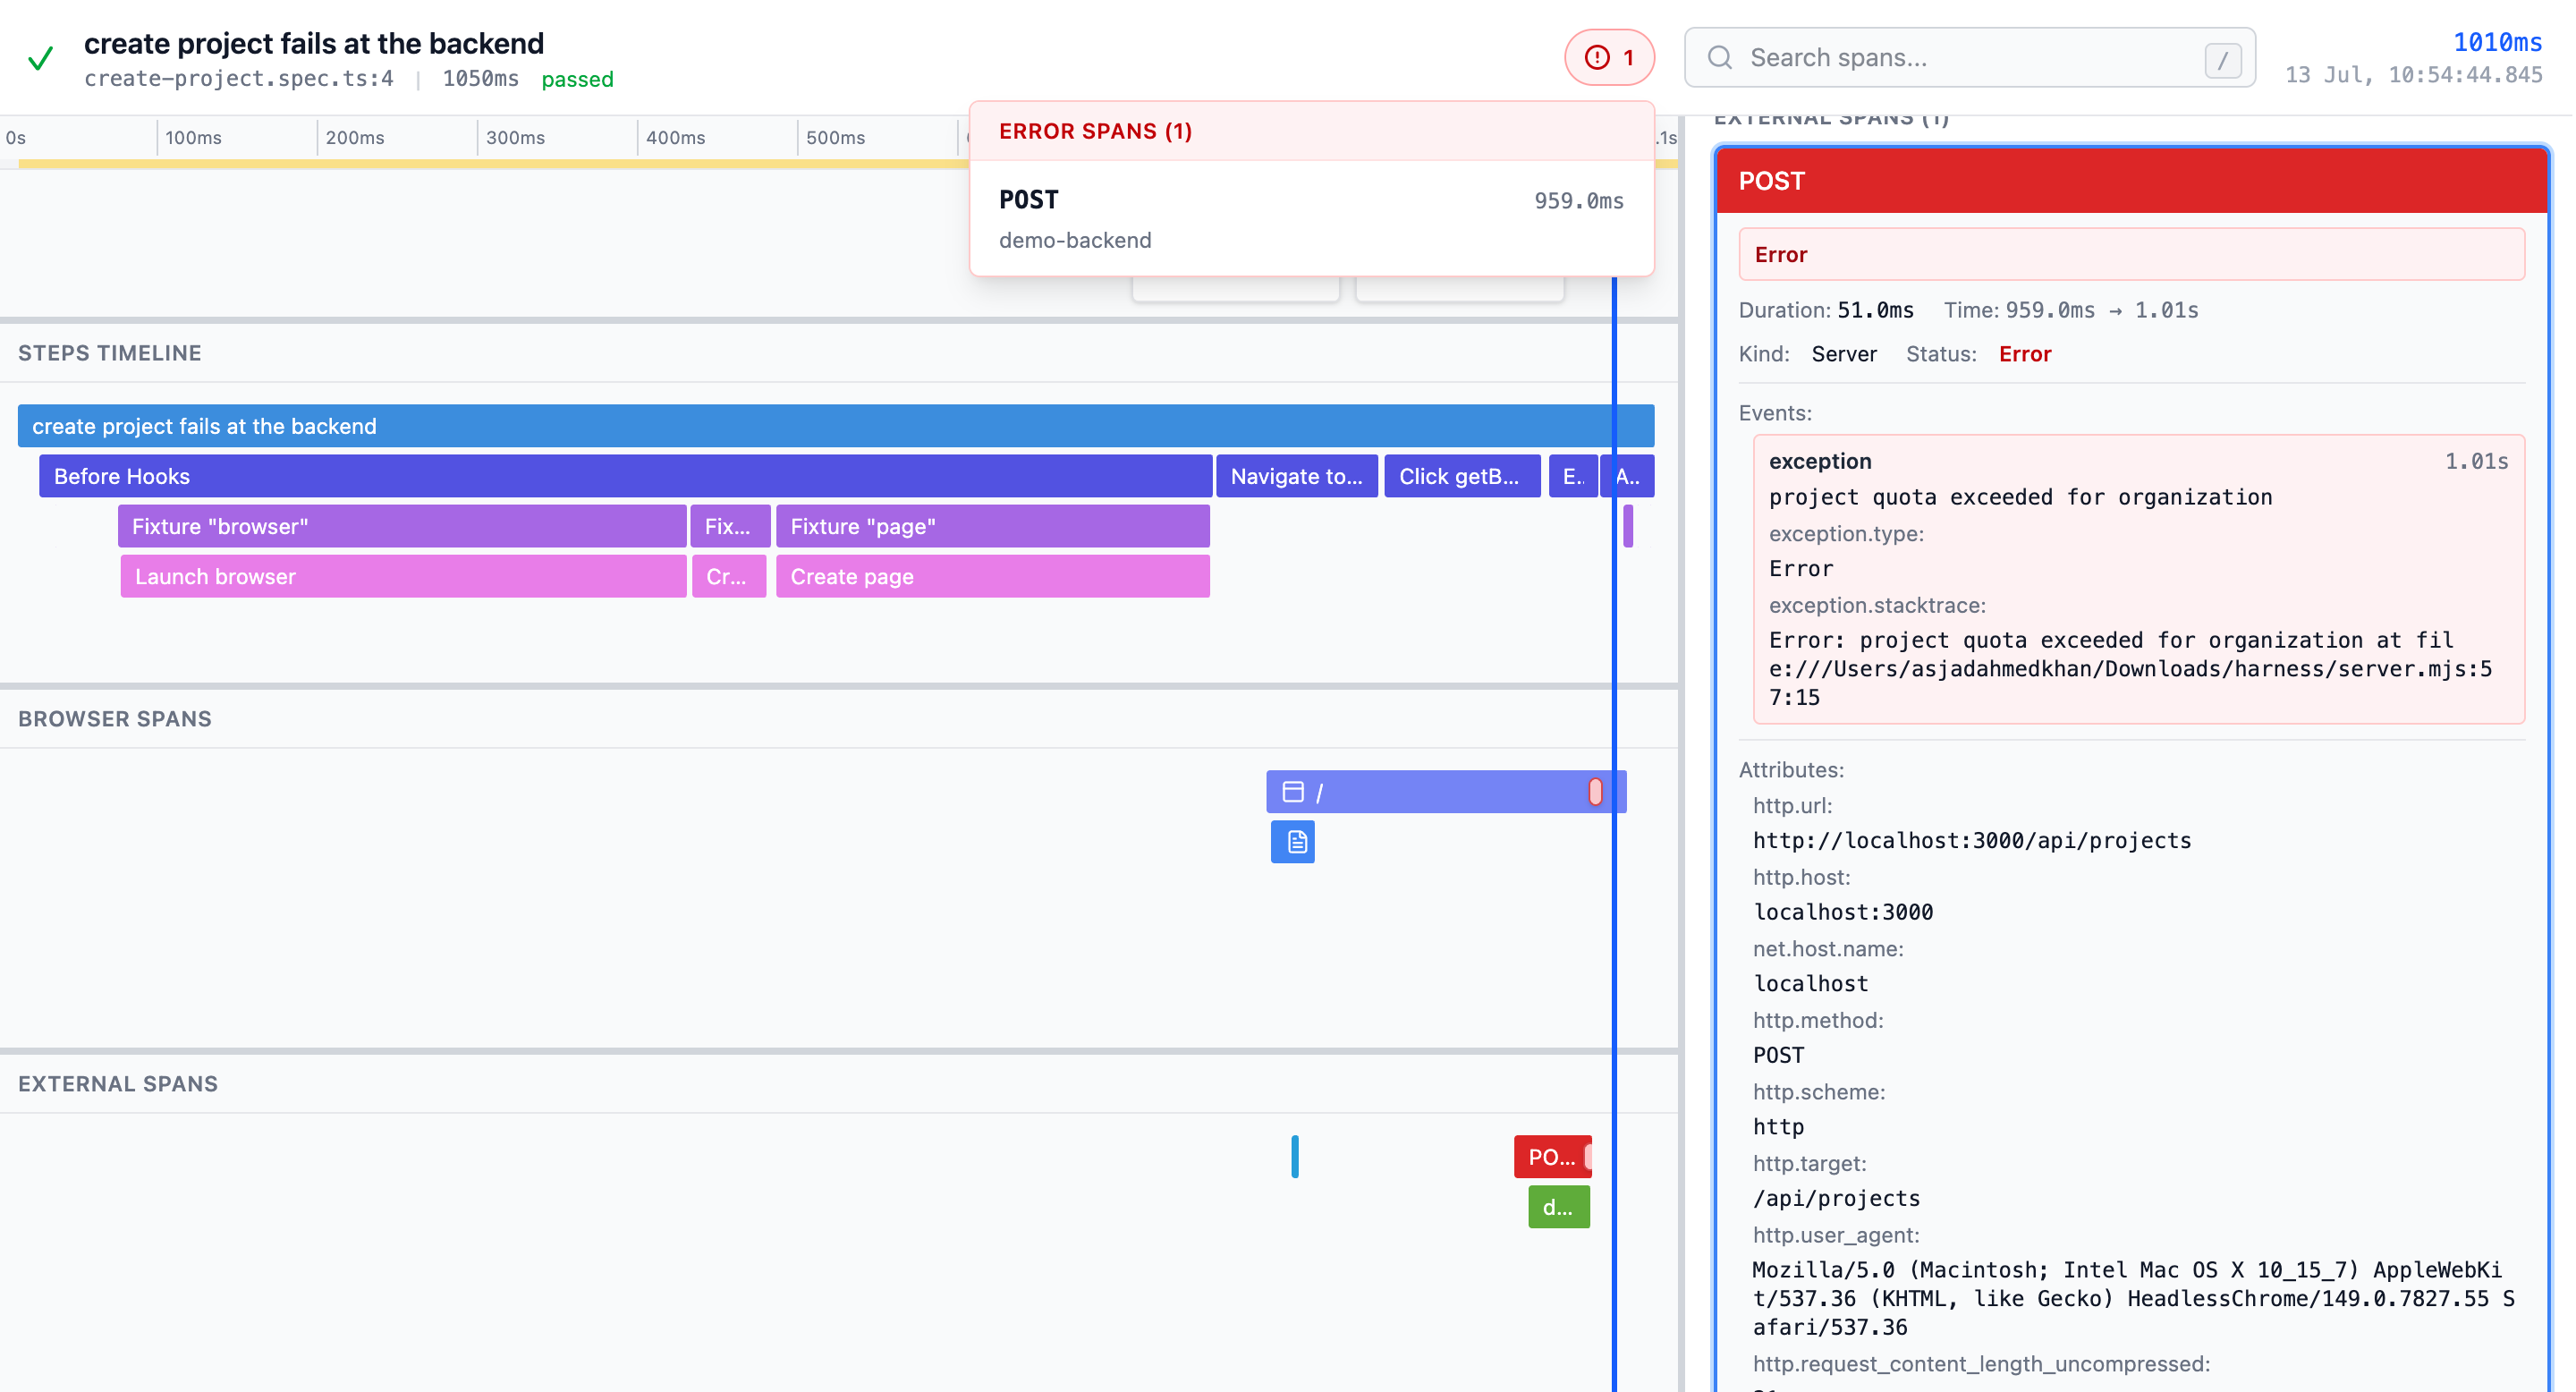
The viewer separates the trace into three views that match how you investigate a failure:
- **Test steps** for the Playwright test, hooks, fixtures, and actions
- **Browser spans** for navigation, routes, JavaScript, fonts, images, fetches, and other requests
- **External spans** for your instrumented application and backend services
Console messages and uncaught browser errors appear as span events on the timeline, and the error navigator jumps straight to failing spans and their recorded exceptions.
### Using trace IDs in other reporters
Reporters configured after `playwright-opentelemetry/reporter` can read the trace ID from `TestResult.annotations` in `onTestEnd`:
```ts
const traceId = result.annotations.find(
(annotation) => annotation.type === "playwrightOpentelemetryTraceId",
)?.description;
```
The annotation type is `playwrightOpentelemetryTraceId`. Its `description` is the 32-character OpenTelemetry trace ID, and it is only present when a trace was created for that test attempt.
## Output formats
### `opentelemetry-trace.zip` format
When `storeTraceZip: true` and Playwright retained a trace for the test, a local copy of trace data will be stored to your results folder with the format:
```
{file.spec}:{linenumber}-{testId}-pw-otel.zip
- traces/
- playwright-opentelemetry.json <-- the OTLP request body of all trace data collected by the reporter related to this test. Test metadata is stored on the root `playwright.test` span.
- manifest.json <-- screenshot metadata with timestamps and ZIP paths
- screenshots/ <-- the screenshots captured during the test run
- {pageId}-{timestamp}.jpeg <-- pageId matches the page's `browser.page.id` span attribute
```
### Trace API
The trace viewer can also load traces from a trace-specific API base URL, for example `/playwright-otel-trace-viewer/v1/{traceId}`. That base URL must respond to the following endpoints:
- `GET {baseUrl}/traces` - merged OTLP trace export response
- Response format `{ "resourceSpans": [...] }`
- Returns `404` when the trace does not exist
- `GET {baseUrl}/screenshots.zip` - ZIP containing root `manifest.json` and `screenshots/*`, or `404` when there are no screenshots
Reporter step spans in Before Hooks carry `playwright.test.phase: "before"`; spans in After Hooks and Worker Cleanup carry `playwright.test.phase: "after"`. This custom attribute is inherited by nested hooks, fixtures, and steps. Test-body steps and the root test span omit it.
The trace viewer derives base test information from the root `playwright.test` span attributes, including `test.case.title`, `playwright.test.describes`, `playwright.test.status`, `code.file.path`, and `code.line.number`.
### Deploying your own Trace API
The `@playwright-opentelemetry/trace-api` package provides a customizable H3-based library for storing and serving traces from S3-compatible storage. You can deploy it to Cloudflare Workers, Deno, Bun, Node.js, or any platform supporting web-standard Request/Response handlers.
See the [trace-api README](trace-api/README.md) for installation, usage examples, and deployment instructions.
## Project status
The project is in early development and still on a `0.x` release, so expect breaking changes between minor versions. The core workflow described above works today: test spans, browser spans, trace propagation, screenshot capture, OTLP export, local ZIPs, the Trace API, and the viewer.
The trace reaches only as far as your instrumentation does. The most useful thing you can tell us is where the trace still goes dark: [open an issue](https://github.com/endformdev/playwright-opentelemetry/issues).
## Contributing
See [CONTRIBUTING.md](CONTRIBUTING.md) for development setup, commands, and the release process.
## License
[Apache-2.0](LICENSE).
Playwright and OpenTelemetry are trademarks of their respective owners. This project is not affiliated with or endorsed by the Playwright or OpenTelemetry projects.
---



