A cross-platform SQL Server execution plan analyzer with built-in MCP server for AI-assisted analysis. Parses `.sqlplan` XML, identifies performance problems, suggests missing indexes, and provides actionable warnings — from the command line or a desktop GUI.
Built for developers and DBAs who want fast, automated plan analysis without clicking through SSMS.
## Screenshots
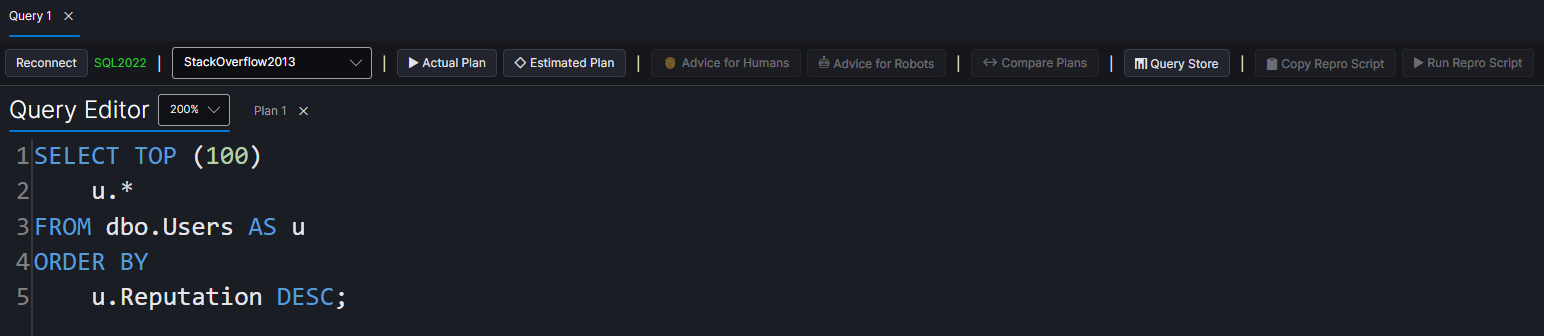
### Query Editor
Write queries with syntax highlighting and SQL keyword completion, connect to any SQL Server, and capture plans with one click.
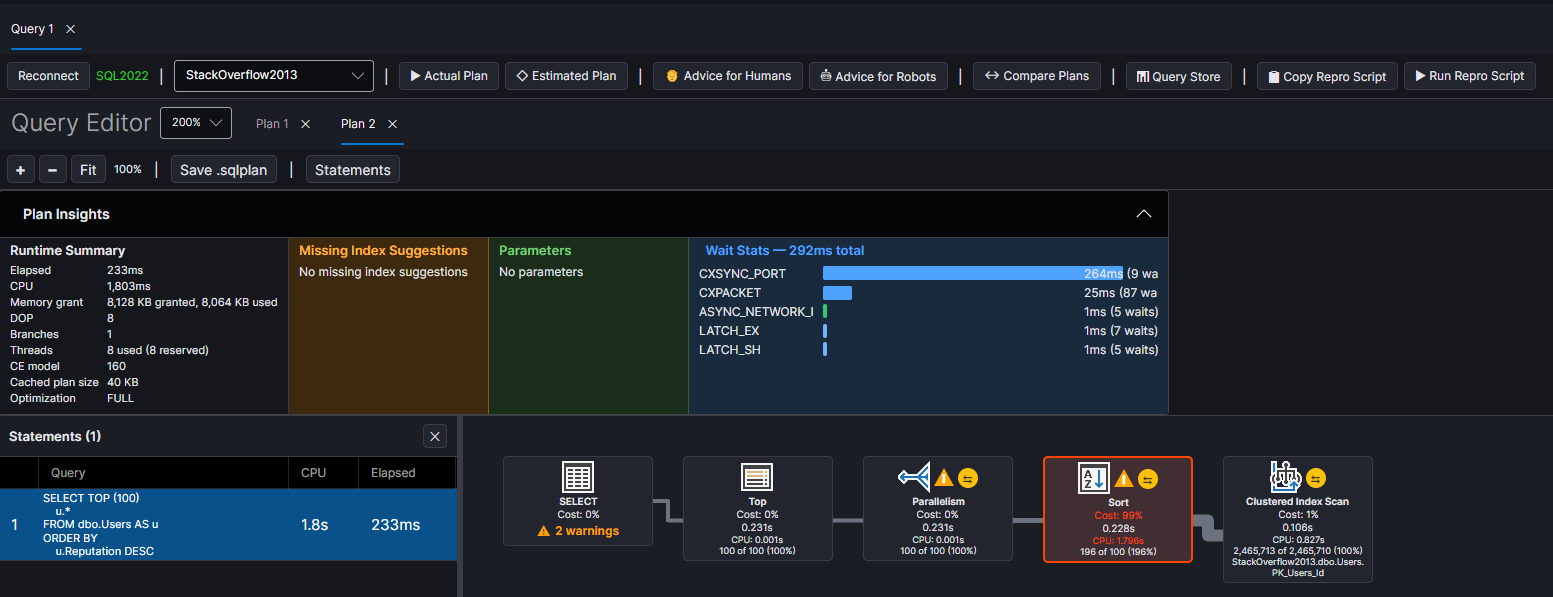
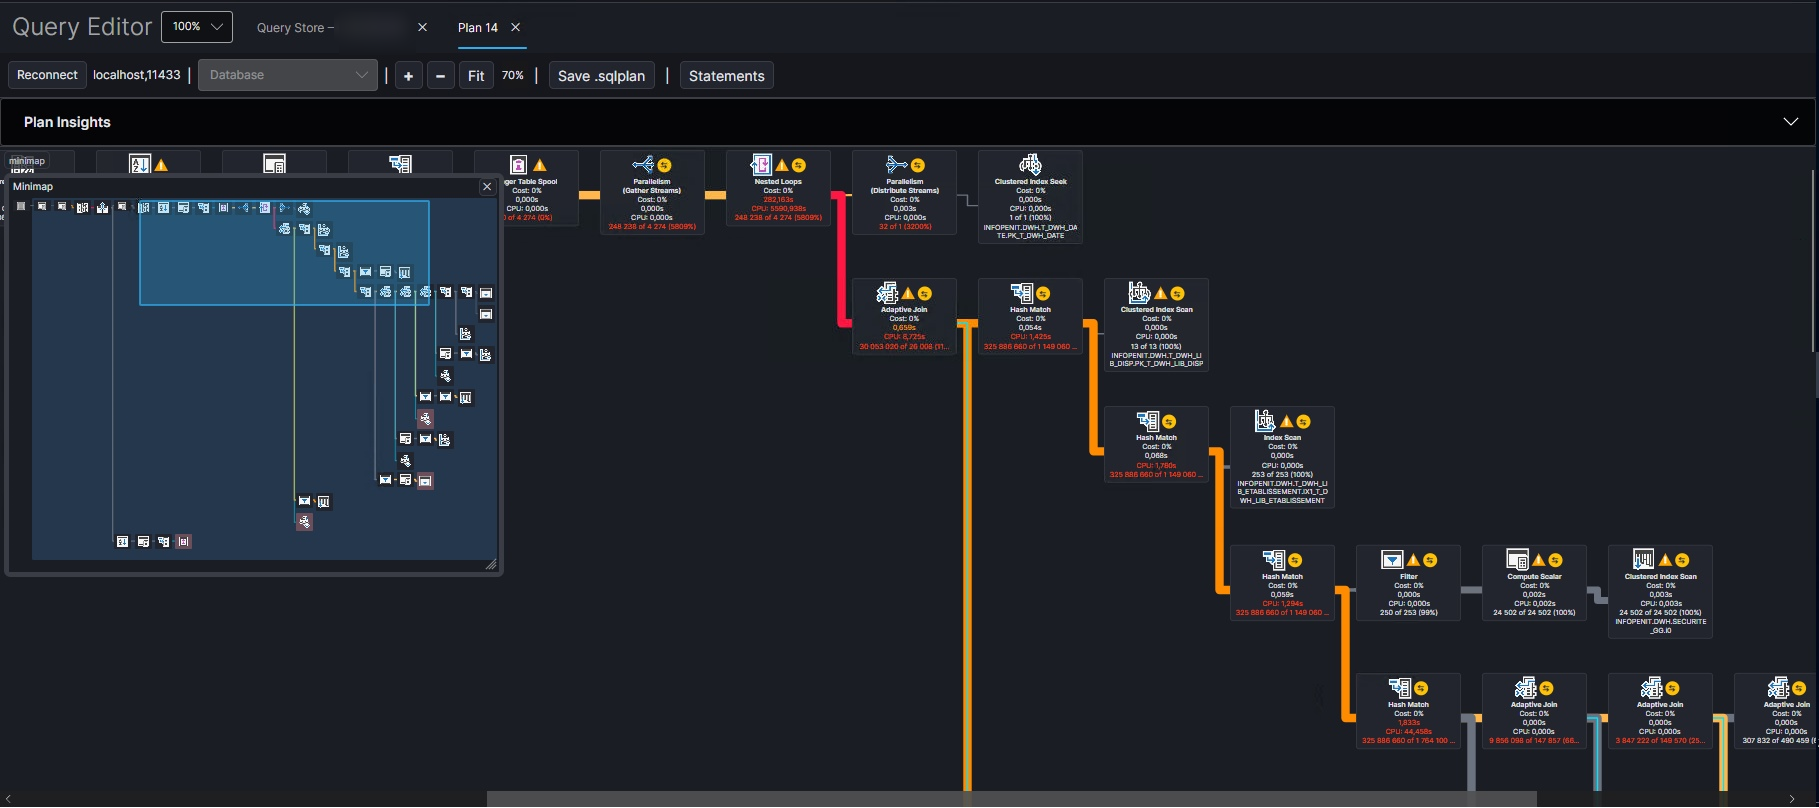
### Actual Execution Plan with Plan Insights
Graphical plan tree with SSMS-style operator icons, cost percentages, row counts, and warning badges. The Plan Insights panel shows runtime summary, missing indexes, parameters, and wait stats at a glance.
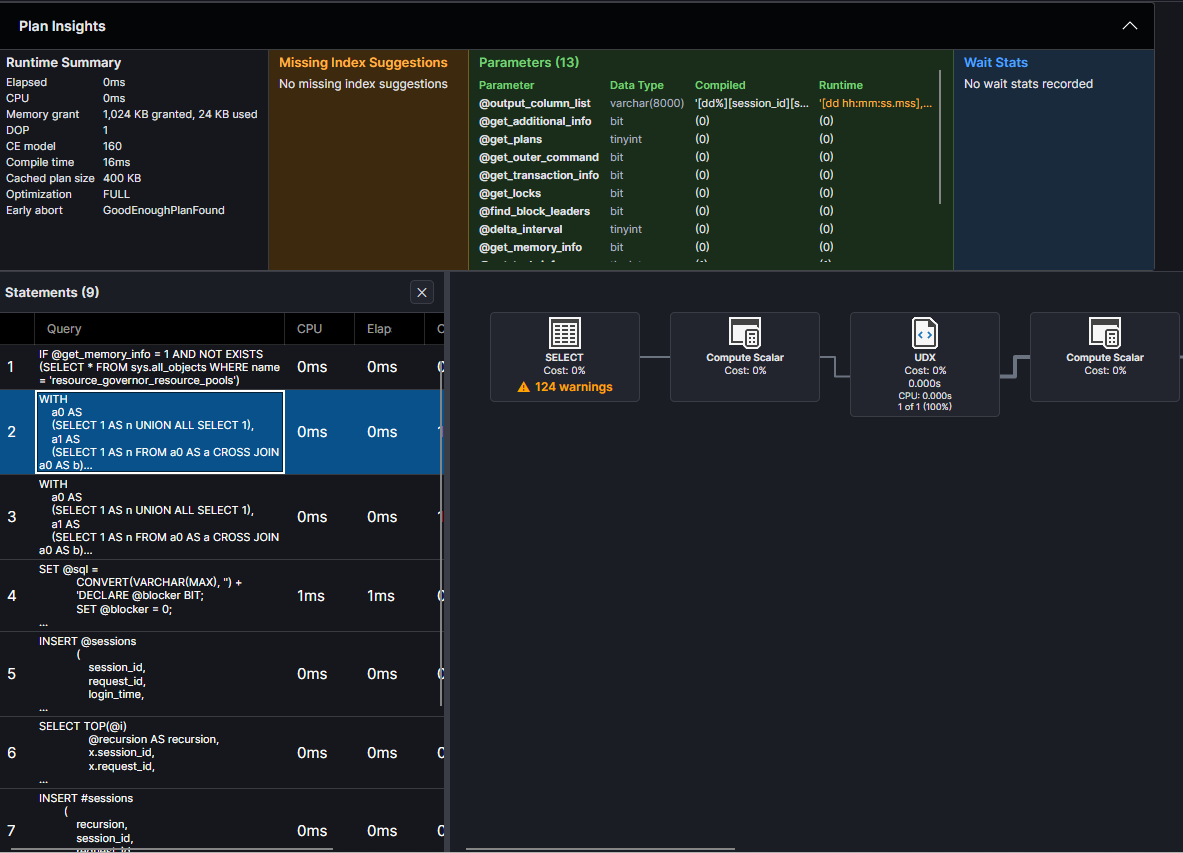
### Multi-Statement Navigation
Navigate stored procedures and batches with multiple statements. Click any statement in the grid to jump to its plan. Plan Insights shows parameters with compiled vs runtime values.
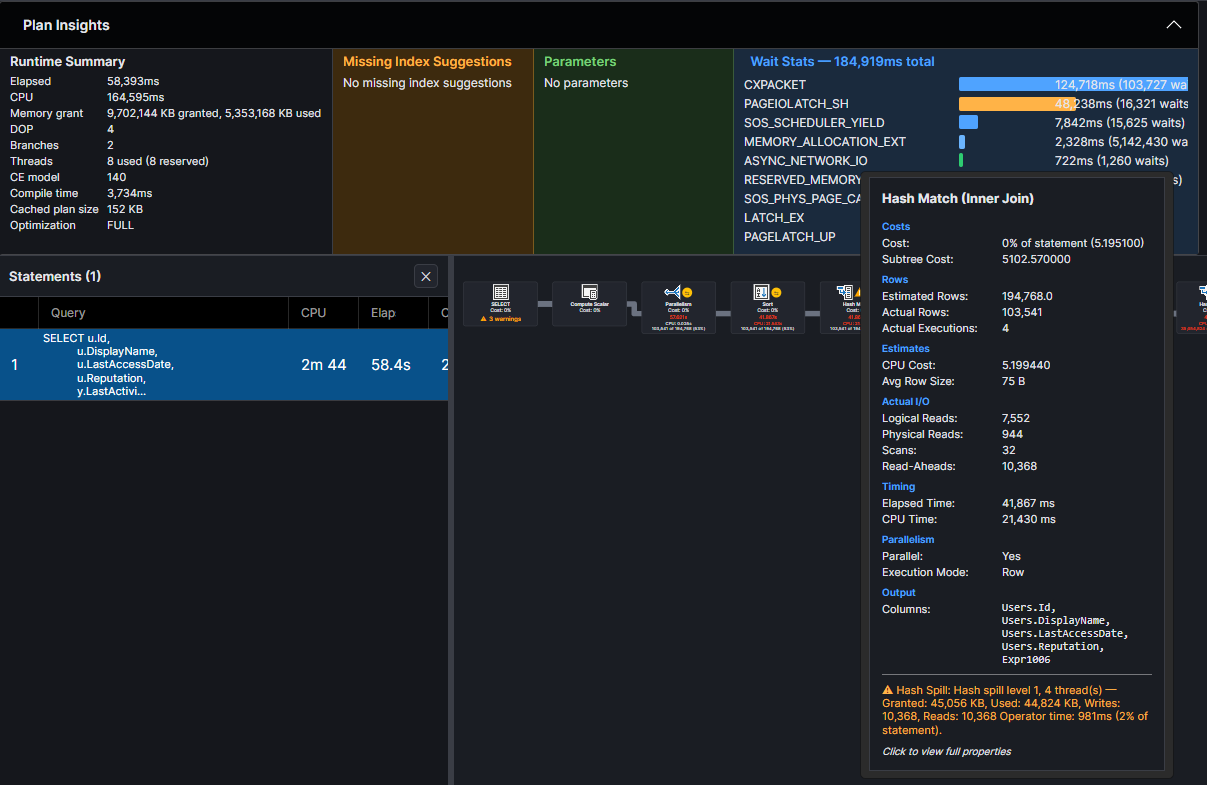
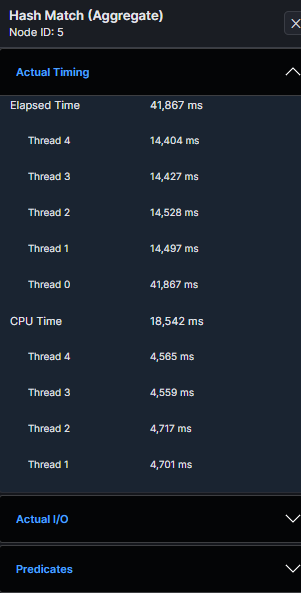
### Operator Tooltip and Properties
Hover over any operator for a detailed tooltip with costs, rows, I/O, timing, parallelism, and warnings. Click to open the full properties panel with per-thread timing, predicates, and more.
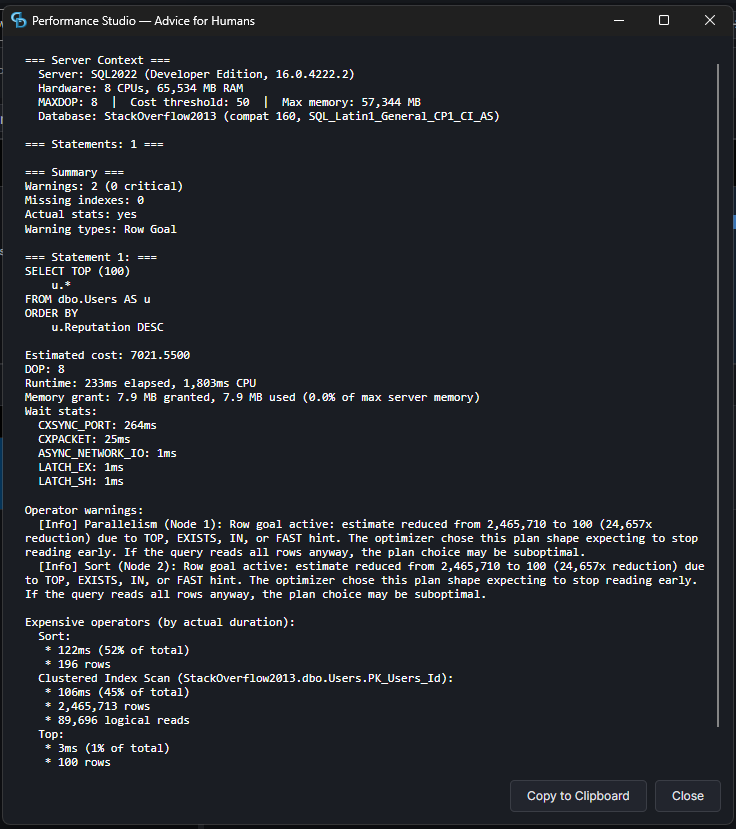
### Advice for Humans
One-click text report with server context, warnings, wait stats, and expensive operators — ready to read or share.
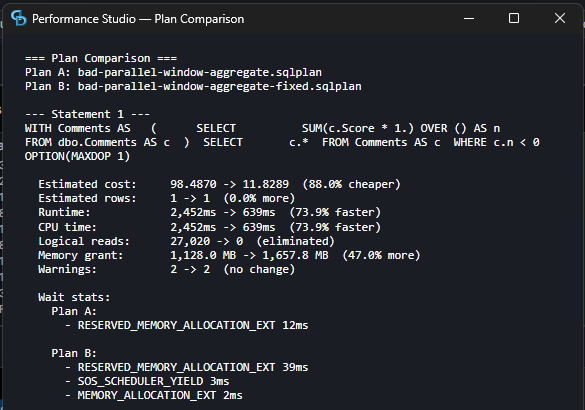
### Plan Comparison
Side-by-side comparison of two plans showing cost, runtime, I/O, memory, and wait stat differences.
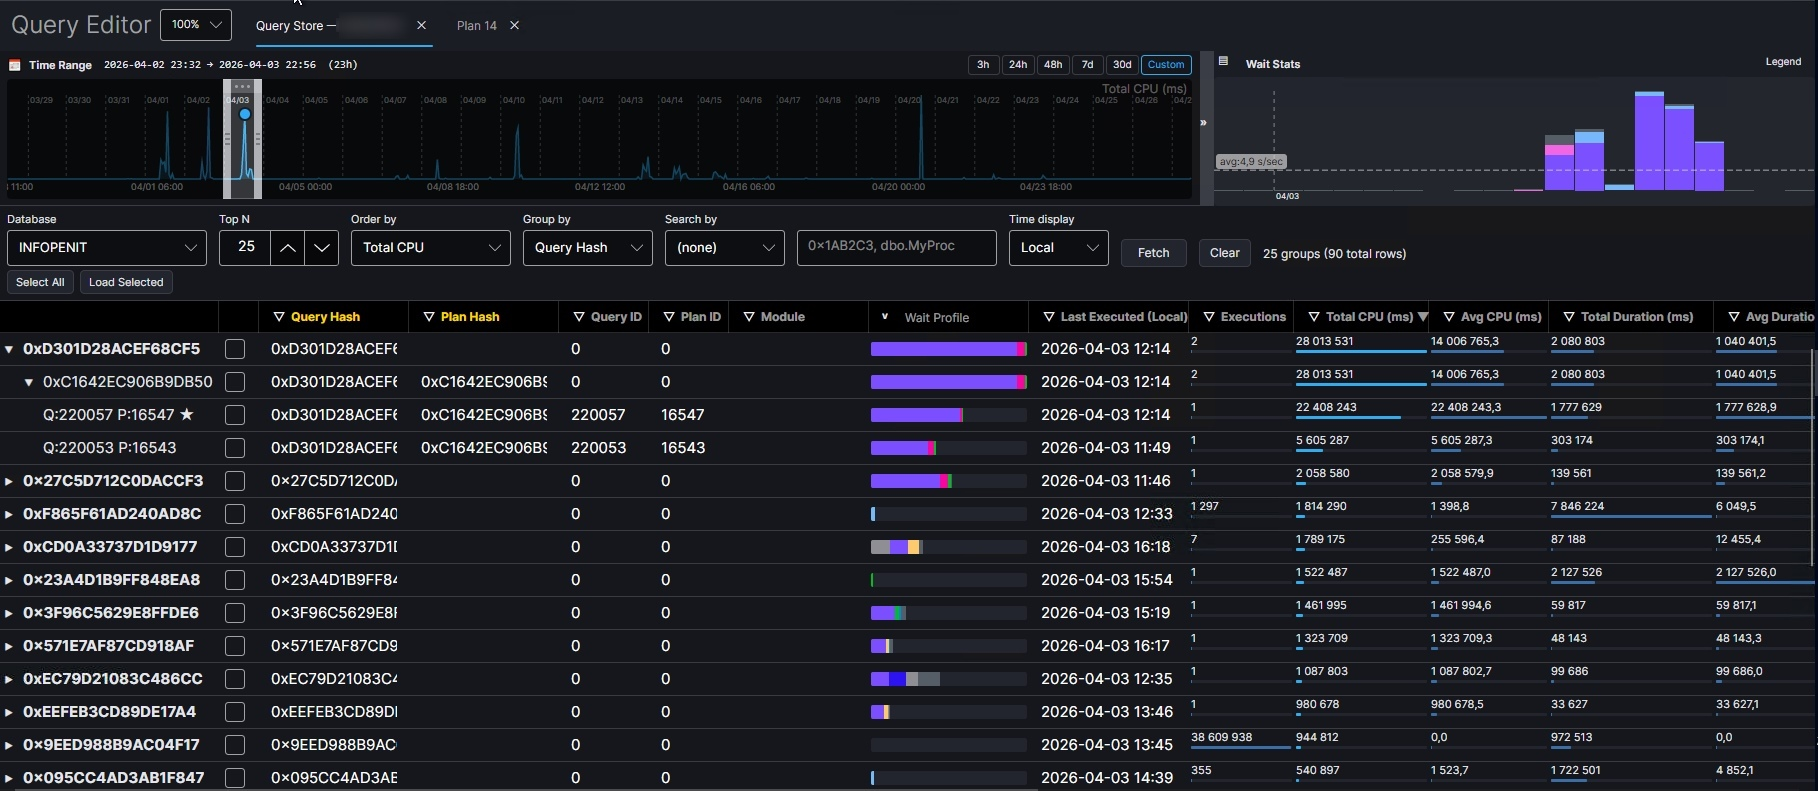
### Query Store Integration
Fetch top queries by CPU, duration, logical reads, physical reads, writes, memory, or executions from Query Store and load their plans directly into the analyzer.
### Minimap and colored links by accuracy ratio divergence
The minimap provides a high-level overview of the entire plan, allowing you to quickly navigate to areas of interest. Colored links between operators indicate accuracy ratio divergence, helping you identify where estimates are most off from actuals.
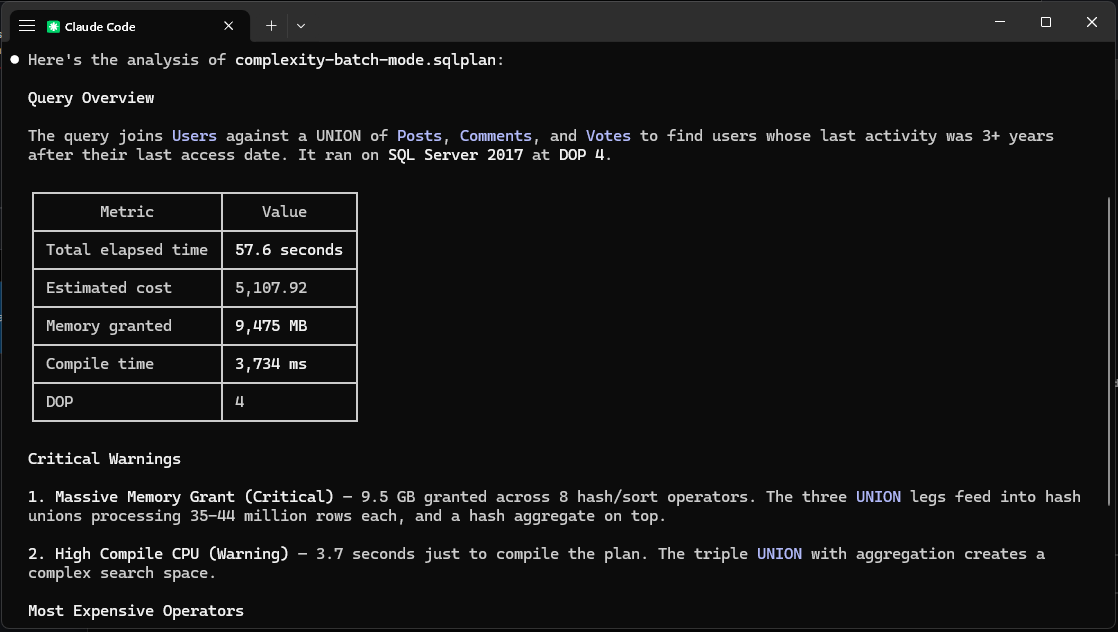
### MCP Integration
Ask Claude Code to analyze loaded plans, identify warnings, suggest indexes, and compare plans — all through the built-in MCP server.
## What It Does
Feed it a query plan and it tells you what's wrong:
- **Large memory grants** — flags queries hoarding memory they don't use
- **Row estimate mismatches** — finds operators where estimates are 10x+ off from actuals
- **Missing indexes** — extracts SQL Server's index suggestions with ready-to-run CREATE statements
- **Hash, sort, and exchange spills** — identifies operators spilling to TempDB with severity based on volume
- **Parallel skew** — detects threads doing all the work while others sit idle
- **Scan predicates** — warns when scans filter rows with residual predicates
- **Key and RID lookups** — flags lookups back to the base table, distinguishes heaps from clustered indexes
- **Late filters** — finds Filter operators discarding rows deep in the plan
- **Nested loop concerns** — flags high-execution nested loops that might be better as hash joins
- **Parameter sniffing** — compares compiled vs runtime parameter values
- **Scalar UDFs** — warns about T-SQL and CLR scalar functions in execution paths
- **Implicit conversions** — detects type mismatches, upgrades severity when a seek plan is prevented
- **Anti-patterns** — OPTIMIZE FOR UNKNOWN, NOT IN with nullable columns, leading wildcards, function-wrapped predicates, and more
Each warning includes severity (Info, Warning, or Critical), the operator node ID, and enough context to act on immediately.
## Prerequisites
- [.NET 10 SDK](https://dotnet.microsoft.com/download/dotnet/10.0) (only needed to build from source — the pre-built binaries below are self-contained and require no SDK)
- SQL Server instance (optional — only needed for live plan capture; file analysis works without one)
- Docker (optional — macOS/Linux users can run SQL Server locally via Docker)
## Download
Pre-built binaries are available on the [Releases](https://github.com/erikdarlingdata/PerformanceStudio/releases/latest) page:
| Platform | Download |
|----------|----------|
| Windows (x64) | [PerformanceStudio-win-x64.zip](https://github.com/erikdarlingdata/PerformanceStudio/releases/latest/download/PerformanceStudio-win-x64.zip) |
| macOS (Apple Silicon) | [PerformanceStudio-osx-arm64.zip](https://github.com/erikdarlingdata/PerformanceStudio/releases/latest/download/PerformanceStudio-osx-arm64.zip) |
| macOS (Intel) | [PerformanceStudio-osx-x64.zip](https://github.com/erikdarlingdata/PerformanceStudio/releases/latest/download/PerformanceStudio-osx-x64.zip) |
| Linux (x64) | [PerformanceStudio-linux-x64.zip](https://github.com/erikdarlingdata/PerformanceStudio/releases/latest/download/PerformanceStudio-linux-x64.zip) |
These are self-contained — no .NET SDK required. Extract the zip and run.
**macOS note:** macOS may block the app because it isn't signed with an Apple Developer certificate. If you see a warning that the app "can't be opened," run this after extracting:
```bash
xattr -cr PerformanceStudio.app
```
Then open the app normally.
## Build from Source
Clone and build:
```bash
git clone https://github.com/erikdarlingdata/PerformanceStudio.git
cd PerformanceStudio
dotnet build
```
To verify the build:
```bash
dotnet test tests/PlanViewer.Core.Tests # 37 tests should pass
dotnet run --project src/PlanViewer.Cli -- analyze --help
```
## Quick Start
### Analyze an existing .sqlplan file
If you already have a `.sqlplan` file (saved from SSMS, Azure Data Studio, or another tool):
```bash
# JSON output (default) — full operator tree, suitable for automation
planview analyze my_query.sqlplan
# Human-readable text output
planview analyze my_query.sqlplan --output text
# Text output, warnings and missing indexes only (skip operator tree)
planview analyze my_query.sqlplan --output text --warnings-only
```
### Capture and analyze plans from a live server
Connect to a SQL Server instance, run queries, and capture their execution plans automatically.
**Quickest way** — pass credentials directly:
```bash
# Capture an actual execution plan (the query WILL run)
planview analyze --server sql2022 --database AdventureWorks \
--login sa --password YourPassword \
--query "SELECT * FROM Sales.SalesOrderHeader WHERE OrderDate > '2024-01-01'" \
--trust-cert --output-dir ./results/
# Capture an estimated plan (safe for production — query is NOT executed)
planview analyze --server sql2022 --database AdventureWorks \
--login sa --password YourPassword \
--query "SELECT * FROM Sales.SalesOrderHeader" \
--estimated --trust-cert --output-dir ./results/
```
**Using a .env file** — drop a `.env` in your working directory to avoid repeating connection details:
```bash
# .env
PLANVIEW_SERVER=sql2022
PLANVIEW_DATABASE=AdventureWorks
PLANVIEW_LOGIN=sa
PLANVIEW_PASSWORD=YourPassword
PLANVIEW_TRUST_CERT=true
```
Then just run:
```bash
planview analyze --query "SELECT * FROM Sales.SalesOrderHeader"
planview analyze ./queries/ --output-dir ./results/
```
CLI arguments override `.env` values when both are provided.
**Using the credential store** — for longer-term use, store credentials in your OS keychain:
```bash
# Store credentials (once per server)
planview credential add sql2022 --user sa
# You'll be prompted for the password — it's stored in your OS credential store
# Now connect without --login/--password
planview analyze --server sql2022 --database AdventureWorks \
--query "SELECT * FROM Sales.SalesOrderHeader" \
--trust-cert --output-dir ./results/
```
**Batch processing** a folder of .sql files:
```bash
planview analyze ./queries/ --server sql2022 --database StackOverflow2013 \
--login sa --password YourPassword \
--trust-cert --output-dir ./results/
```
Batch mode produces three files per query:
- `query_name.sqlplan` — the raw execution plan XML (openable in SSMS or the Performance Studio GUI)
- `query_name.analysis.json` — structured analysis with warnings, missing indexes, and operator tree
- `query_name.analysis.txt` — human-readable text report
### Manage credentials
```bash
planview credential add my-server --user sa # prompts for password
planview credential add my-server --user sa -p pwd # non-interactive
planview credential list # show stored credentials
planview credential remove my-server # delete credential
```
Credentials are stored in the OS credential store — Windows Credential Manager on Windows, Apple Keychain on macOS. Nothing is written to disk in plaintext.
## Example Output
These examples were generated against StackOverflow2013 on SQL Server 2022. Source queries are in [`examples/queries/`](examples/queries/), plans and analysis in [`examples/output/`](examples/output/).
### Text output (`--output text`)
```
Plan: 04_comment_heavy_posts.sqlplan
SQL Server: 1.564 (build 16.0.4222.2)
Statements: 1
--- Statement 1: SELECT ---
Query: SELECT p.Id, p.Title, p.Score, COUNT(c.Id) AS CommentCount
FROM dbo.Posts AS p JOIN dbo.Comments AS c ON c.PostId = p.Id
WHERE p.PostTypeId = 1 GROUP BY p.Id, p.Title, p.Score
HAVING COUNT(c.Id) > 20 ORDER BY CommentCount DESC
Estimated cost: 4069.8700
DOP: 8
Runtime: 4551ms elapsed, 15049ms CPU
Memory grant: 8,022,664 KB granted, 2,514,944 KB used
Warnings:
[Critical] Large Memory Grant: Query granted 7835 MB of memory.
Operator warnings:
[Critical] Parallelism (Node 0): Estimated 1 rows, actual 2,889 (2889x underestimated).
[Critical] Sort (Node 1): Estimated 1 rows, actual 2,889 (2889x underestimated).
[Warning] Sort (Node 1): Thread 1 processed 100% of rows. Work is heavily skewed.
[Warning] Filter (Node 2): Filter discards rows late in the plan.
Missing indexes:
StackOverflow2013.dbo.Posts (impact: 74%)
CREATE NONCLUSTERED INDEX [IX_Posts_PostTypeId]
ON dbo.Posts (PostTypeId) INCLUDE (Score, Title)
StackOverflow2013.dbo.Comments (impact: 19%)
CREATE NONCLUSTERED INDEX [IX_Comments_PostId]
ON dbo.Comments (PostId)
=== Summary ===
Warnings: 8 (4 critical)
Missing indexes: 2
Actual stats: yes
Warning types: Filter Operator, Large Memory Grant, Parallel Skew,
Row Estimate Mismatch, Scan With Predicate
```
### JSON output (default)
The default JSON output includes the full operator tree, making it suitable for CI pipelines, LLM consumption, or further processing. See [`examples/output/`](examples/output/) for complete examples.
### Batch processing
```
$ planview analyze ./examples/queries/ --server sql2022 \
--database StackOverflow2013 --trust-cert --output-dir ./results/
Capturing actual plans from sql2022/StackOverflow2013
[1/5] 01_top_users_by_posts ... OK (1.8s)
[2/5] 02_recent_questions ... OK (0.8s)
[3/5] 03_unanswered_high_score ... OK (0.7s)
[4/5] 04_comment_heavy_posts ... OK (4.7s)
[5/5] 05_user_vote_summary ... OK (4.3s)
Processed 5 files: 5 succeeded, 0 failed
Output: ./results/
```
## Desktop GUI
The Avalonia-based GUI renders execution plans visually with the same operator icons as SSMS. Open `.sqlplan` files via File > Open or drag-and-drop.
Features:
- Graphical plan tree with cost percentages and row counts
- Warning badge on root node showing total warning count
- Plan Insights panel — three-column view with runtime summary, missing indexes, and wait stats visualization
- Zoom and pan (mouse wheel + middle-click drag)
- Minimap for quick navigation of large plans
- Color-coded links between operators based on accuracy ratio divergence (estimates vs actuals)
- Click any operator to see full properties (30 sections)
- Statement grid with sortable columns (cost, rows, DOP, warnings)
- Tooltips on hover with key operator metrics
- **Advice for Humans** — one-click text analysis report you can read or share
- **Advice for Robots** — one-click JSON export designed for LLMs and automation
- **Plan Comparison** — compare two plans side-by-side (cost, runtime, I/O, memory, wait stats)
- **Copy Repro Script** — extracts parameters, SET options, and query text into a runnable `sp_executesql` script
- **Get Actual Plan** — connect to a server and re-execute the query to capture runtime stats
- **Query Store Analysis** — connect to a server and analyze top queries by CPU, duration, or reads
- **Query History** — view a history of executed queries with their plans along the timeline and metrics from query store
- **MCP Server** — built-in Model Context Protocol server for AI-assisted plan analysis (opt-in)
- Dark theme
```bash
dotnet run --project src/PlanViewer.App
```
## SSMS Extension
A VSIX extension that adds **"Open in Performance Studio"** to the execution plan right-click context menu in SSMS 18-22.
### How it works
1. Right-click on any execution plan in SSMS
2. Click "Open in Performance Studio"
3. The extension extracts the plan XML via reflection and saves it to a temp file
4. Performance Studio opens with the plan loaded
### Installation
1. Download `PlanViewer.Ssms.vsix` and `InstallSsmsExtension.exe` from the [latest release](https://github.com/erikdarlingdata/PerformanceStudio/releases/latest)
2. Place them in the same folder
3. Double-click `InstallSsmsExtension.exe` and approve the UAC prompt
4. The installer auto-detects SSMS 21 and/or SSMS 22 and installs into both
5. Restart SSMS to activate the extension
### First run
On first use, if Performance Studio isn't found automatically, the extension will prompt you to locate `PlanViewer.App.exe`. The path is saved to the registry (`HKCU\SOFTWARE\DarlingData\SQLPerformanceStudio\InstallPath`) so you only need to do this once.
The extension searches for the app in this order:
1. Registry key (set automatically after first browse)
2. System PATH
3. Common install locations (`%LOCALAPPDATA%\Programs\SQLPerformanceStudio\`, `Program Files`, etc.)
## MCP Server (LLM Integration)
The desktop GUI includes an embedded [Model Context Protocol](https://modelcontextprotocol.io) server that exposes loaded execution plans and Query Store data to LLM clients like Claude Code and Cursor.
### Setup
1. Enable the MCP server in `~/.planview/settings.json`:
```json
{
"mcp_enabled": true,
"mcp_port": 5152
}
```
2. Register with Claude Code:
```
claude mcp add --transport http --scope user performance-studio http://localhost:5152/
```
3. Open a new Claude Code session and ask questions like:
- "What plans are loaded in the application?"
- "Analyze the execution plan and tell me what's wrong"
- "Are there any missing index suggestions?"
- "Compare these two plans — which is better?"
- "Fetch the top 10 queries by CPU from Query Store"
### Available Tools
13 tools for plan analysis and Query Store data:
| Category | Tools |
|---|---|
| Discovery | `list_plans`, `get_connections` |
| Plan Analysis | `analyze_plan`, `get_plan_summary`, `get_plan_warnings`, `get_missing_indexes`, `get_plan_parameters`, `get_expensive_operators`, `get_plan_xml`, `compare_plans`, `get_repro_script` |
| Query Store | `check_query_store`, `get_query_store_top` |
Plan analysis tools work on plans loaded in the app (via file open, paste, query execution, or Query Store fetch). Query Store tools use a built-in read-only DMV query — no arbitrary SQL can be executed.
The MCP server binds to `localhost` only and does not accept remote connections. Disabled by default.
## Project Structure
```
PerformanceStudio/
├── src/
│ ├── PlanViewer.Core/ # Analysis engine (parser, 30 rules, layout)
│ ├── PlanViewer.App/ # Avalonia desktop GUI
│ ├── PlanViewer.Cli/ # CLI tool (planview command)
│ ├── PlanViewer.Ssms/ # SSMS extension (.vsix, .NET Framework 4.7.2)
│ └── PlanViewer.Ssms.Installer/ # SSMS extension installer (auto-detects SSMS 21/22)
├── tests/
│ └── PlanViewer.Core.Tests/ # 37 xUnit tests with real .sqlplan fixtures
├── examples/
│ ├── plans/ # Sample .sqlplan files for testing
│ ├── queries/ # Sample .sql files
│ └── output/ # Generated .sqlplan, .analysis.json, .txt
└── PlanViewer.sln
```
## CLI Reference
### `planview analyze`
```
Usage: planview analyze [] [options]
Arguments:
.sqlplan file, .sql file, or directory of .sql files
Options:
--stdin Read plan XML from stdin
-o, --output json (default) or text
--compact Compact JSON (no indentation)
--warnings-only Skip operator tree, only output warnings and indexes
-s, --server SQL Server name (matches credential store key)
-d, --database Database context for execution
-q, --query Inline SQL text to execute
--output-dir Directory for output files
--estimated Estimated plan only (query is NOT executed)
--auth windows, sql, or entra (default: auto-detect)
--trust-cert Trust server certificate
--timeout Query timeout (default: 60)
--login SQL Server login (bypasses credential store)
--password SQL Server password (bypasses credential store)
```
### `planview credential`
```
planview credential add --user [-p ]
planview credential list
planview credential remove
```
## Authentication
There are three ways to authenticate, in order of precedence:
1. **`--login` / `--password`** — passed directly on the command line (or via `.env` file). Simplest for dev/test.
2. **Credential store** — stored in Windows Credential Manager or Apple Keychain via `planview credential add`. Best for repeated use.
3. **Windows Authentication** — used automatically when no SQL credentials are found. Requires a valid Kerberos ticket.
Override the auto-detection with `--auth windows`, `--auth sql`, or `--auth entra`.
**macOS note:** Windows Authentication does not work on macOS (no Kerberos ticket by default). Use `--login`/`--password`, the credential store, or `--auth entra` instead.
## Platform Support
| Platform | GUI | CLI | Credential Store |
|----------|-----|-----|-----------------|
| Windows | Yes | Yes | Windows Credential Manager |
| macOS | Yes | Yes | Apple Keychain |
| Linux | Yes | Yes | Not yet (file analysis works) |
### macOS: SQL Server via Docker
macOS users need a SQL Server instance to use the live capture features. The easiest path is Docker:
```bash
docker run -e "ACCEPT_EULA=Y" -e "MSSQL_SA_PASSWORD=YourPassword123" \
-p 1433:1433 --name sql_server \
-d mcr.microsoft.com/mssql/server:2022-latest
# Store the credential
planview credential add localhost --user sa -p YourPassword123
# Test connectivity
planview analyze --server localhost --database master --trust-cert \
--query "SELECT @@VERSION" -o text
```
Always use `--trust-cert` with local Docker instances.
## Analysis Rules
The analyzer runs 30 rules against each plan, covering:
| Category | Rules |
|----------|-------|
| Memory | Large grants, grant vs used ratio, spills to TempDB (including exchange spills) |
| Estimates | Row estimate mismatches (10x+), zero-row actuals, row goals |
| Indexes | Missing index suggestions, key lookups, RID lookups, scan with residual predicates |
| Parallelism | Serial plan reasons, thread skew, ineffective parallelism, DOP reporting |
| Joins | Nested loop high executions, many-to-many merge join worktables |
| Filters | Late filter operators with impact quantification, function-wrapped predicates |
| Functions | Scalar UDF detection (T-SQL and CLR), UDF timing |
| Parameters | Compiled vs runtime values, sniffing issue detection |
| Patterns | Leading wildcards, implicit conversions (with seek plan severity upgrade), OPTIMIZE FOR UNKNOWN, NOT IN with nullable columns, OR expansion, CASE in predicates |
| Compilation | High compile CPU, compile memory exceeded, early abort |
| Objects | Table variables, table-valued functions, CTE multiple references, eager index spools, lazy spools, row count spools |
| Operators | Operator self-time calculation with per-thread awareness for parallel plans |
Rules can be disabled or have their severity overridden via a `.planview.json` config file. See the `--config` option.
## Sponsors
## License
MIT — see [LICENSE](LICENSE).
Execution plan operator icons are from Microsoft's [vscode-mssql](https://github.com/microsoft/vscode-mssql) extension (MIT). See [THIRD_PARTY_NOTICES.md](THIRD_PARTY_NOTICES.md) for details.


