
 ](https://eurostat.github.io/gridviz/docs/reference#shapecolorsize-style)
[
](https://eurostat.github.io/gridviz/docs/reference#shapecolorsize-style)
[ ](https://eurostat.github.io/gridviz/docs/reference#side-category-style)
[
](https://eurostat.github.io/gridviz/docs/reference#side-category-style)
[ ](https://eurostat.github.io/gridviz/docs/reference#shapecolorsize-style)
[
](https://eurostat.github.io/gridviz/docs/reference#shapecolorsize-style)
[ ](https://eurostat.github.io/gridviz/docs/reference#square-color-webgl-style)
[
](https://eurostat.github.io/gridviz/docs/reference#square-color-webgl-style)
[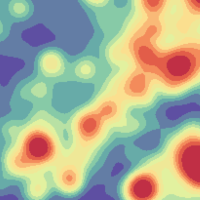 ](https://eurostat.github.io/gridviz/docs/reference#kernel-smoothing)
[
](https://eurostat.github.io/gridviz/docs/reference#kernel-smoothing)
[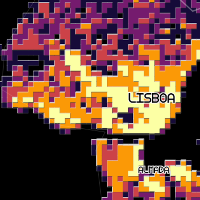 ](https://eurostat.github.io/gridviz/docs/reference#tanaka-style)
[
](https://eurostat.github.io/gridviz/docs/reference#tanaka-style)
[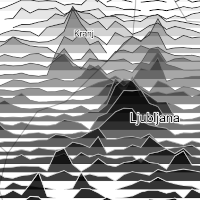 ](https://eurostat.github.io/gridviz/docs/reference#joyplot-style)
[
](https://eurostat.github.io/gridviz/docs/reference#joyplot-style)
[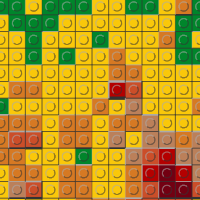 ](https://eurostat.github.io/gridviz/docs/reference#lego-style)
[
](https://eurostat.github.io/gridviz/docs/reference#lego-style)
[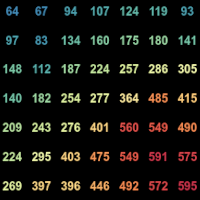 ](https://eurostat.github.io/gridviz/docs/reference#text-style)
[
](https://eurostat.github.io/gridviz/docs/reference#text-style)
[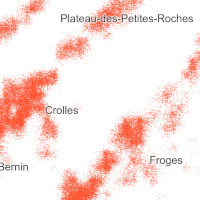 ](https://eurostat.github.io/gridviz/docs/reference#dot-density-style)
[
](https://eurostat.github.io/gridviz/docs/reference#dot-density-style)
[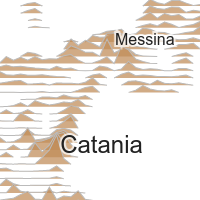 ](https://eurostat.github.io/gridviz/docs/reference#joyplot-style)
## Live Demos
- [**Europe** - 1km resolution - Census total population](https://ec.europa.eu/assets/estat/E/E4/gisco/website/grid_map/index.html)
- [**Europe** - 1km resolution - Census population composition](https://ec.europa.eu/assets/estat/E/E4/gisco/website/census_2021_grid_map/index.html)
- [**Europe** - 100m resolution - Accessibility to basic services](https://ec.europa.eu/assets/estat/E/E4/gisco/accessibility_maps/healthcare_education/index.html)
- [**Europe** - 100m resolution - Relief](https://eurostat.github.io/gridviz/examples/demos/EUR_relief.html)
- [**Germany** - 100m resolution - Zensus 2011](https://eurostat.github.io/gridviz/examples/demos/DE.html)
- [**France** - 200m resolution - INSEE Filosofi](https://eurostat.github.io/gridviz/examples/demos/FR.html). Focus on [total population](https://eurostat.github.io/gridviz/examples/demos/FR_pop.html) and [income](https://eurostat.github.io/gridviz/examples/demos/FR_income.html).
- [**Norway** - 250m resolution - SSB](https://eurostat.github.io/gridviz/examples/demos/NO.html)
- [**Croatia** - 1km resolution - DZS 2015 grid](https://eurostat.github.io/gridviz/examples/demos/HR.html)
- [**Belgium** population](https://eurostat.github.io/gridviz/examples/basics/mixed_resolution_BE.html), as mixed resolution layer.
## Installation
### Node.js
```Shell
npm install gridviz
```
then
```javascript
import * as gridviz from 'gridviz'
```
Or you can cherry-pick only the modules that you need, for example:
```javascript
import { Map, SquareColorWebGLStyle } from 'gridviz'
```
### Basic example
Here’s a basic example that loads a CSV file of a European population grid (5km resolution):
```javascript
//define map with initial view
const map = new gridviz.Map(document.getElementById('map'), { x: 4500000, y: 2900000, z: 3000 })
//define dataset
const dataset = new gridviz.CSVGrid(
map,
'https://raw.githubusercontent.com/eurostat/gridviz/master/assets/csv/Europe/pop_2018_10km.csv',
10000
)
//define color for each cell
const colorFunction = (cell) => {
if (cell.population > 150000) return '#993404'
else if (cell.population > 60000) return '#d95f0e'
else if (cell.population > 20000) return '#fe9929'
else if (cell.population > 6000) return '#fec44f'
else if (cell.population > 1500) return '#fee391'
else return '#ffffd4'
}
//define style
const style = new gridviz.ShapeColorSizeStyle({ color: colorFunction })
//add layer to map
map.layers = [new gridviz.GridLayer(dataset, [style])]
```
See the **[documentation page](https://eurostat.github.io/gridviz/docs/reference)** for more information.
### standalone
```javascript
```
## Documentation
See the **[gridviz documentation page](./docs/reference.md)**.
## Grid tiling
In order to visualize large grids efficiently, you can produce tiled grids in a [tiled grid format](https://eurostat.github.io/gridviz/docs/tiledformat) with **[GridTiler](https://github.com/eurostat/gridtiler)**.
## About
| | |
| -------------- | ------------------------------------------------------------------------------------------------------------------------------------------------------------------------------------- |
| _contributors_ | [
](https://eurostat.github.io/gridviz/docs/reference#joyplot-style)
## Live Demos
- [**Europe** - 1km resolution - Census total population](https://ec.europa.eu/assets/estat/E/E4/gisco/website/grid_map/index.html)
- [**Europe** - 1km resolution - Census population composition](https://ec.europa.eu/assets/estat/E/E4/gisco/website/census_2021_grid_map/index.html)
- [**Europe** - 100m resolution - Accessibility to basic services](https://ec.europa.eu/assets/estat/E/E4/gisco/accessibility_maps/healthcare_education/index.html)
- [**Europe** - 100m resolution - Relief](https://eurostat.github.io/gridviz/examples/demos/EUR_relief.html)
- [**Germany** - 100m resolution - Zensus 2011](https://eurostat.github.io/gridviz/examples/demos/DE.html)
- [**France** - 200m resolution - INSEE Filosofi](https://eurostat.github.io/gridviz/examples/demos/FR.html). Focus on [total population](https://eurostat.github.io/gridviz/examples/demos/FR_pop.html) and [income](https://eurostat.github.io/gridviz/examples/demos/FR_income.html).
- [**Norway** - 250m resolution - SSB](https://eurostat.github.io/gridviz/examples/demos/NO.html)
- [**Croatia** - 1km resolution - DZS 2015 grid](https://eurostat.github.io/gridviz/examples/demos/HR.html)
- [**Belgium** population](https://eurostat.github.io/gridviz/examples/basics/mixed_resolution_BE.html), as mixed resolution layer.
## Installation
### Node.js
```Shell
npm install gridviz
```
then
```javascript
import * as gridviz from 'gridviz'
```
Or you can cherry-pick only the modules that you need, for example:
```javascript
import { Map, SquareColorWebGLStyle } from 'gridviz'
```
### Basic example
Here’s a basic example that loads a CSV file of a European population grid (5km resolution):
```javascript
//define map with initial view
const map = new gridviz.Map(document.getElementById('map'), { x: 4500000, y: 2900000, z: 3000 })
//define dataset
const dataset = new gridviz.CSVGrid(
map,
'https://raw.githubusercontent.com/eurostat/gridviz/master/assets/csv/Europe/pop_2018_10km.csv',
10000
)
//define color for each cell
const colorFunction = (cell) => {
if (cell.population > 150000) return '#993404'
else if (cell.population > 60000) return '#d95f0e'
else if (cell.population > 20000) return '#fe9929'
else if (cell.population > 6000) return '#fec44f'
else if (cell.population > 1500) return '#fee391'
else return '#ffffd4'
}
//define style
const style = new gridviz.ShapeColorSizeStyle({ color: colorFunction })
//add layer to map
map.layers = [new gridviz.GridLayer(dataset, [style])]
```
See the **[documentation page](https://eurostat.github.io/gridviz/docs/reference)** for more information.
### standalone
```javascript
```
## Documentation
See the **[gridviz documentation page](./docs/reference.md)**.
## Grid tiling
In order to visualize large grids efficiently, you can produce tiled grids in a [tiled grid format](https://eurostat.github.io/gridviz/docs/tiledformat) with **[GridTiler](https://github.com/eurostat/gridtiler)**.
## About
| | |
| -------------- | ------------------------------------------------------------------------------------------------------------------------------------------------------------------------------------- |
| _contributors_ | [ ](https://github.com/jgaffuri) [
 ](https://github.com/JoeWDavies) |
| _version_ | See [npm](https://www.npmjs.com/package/gridviz?activeTab=versions) |
| _status_ | Since 2020 |
| _license_ | [EUPL 1.2](LICENSE) |
### Support and contribution
Feel free to [ask support](https://github.com/eurostat/gridviz/issues/new), fork the project or simply star it (it's always a pleasure).
### Copyright
The [Eurostat NUTS dataset](http://ec.europa.eu/eurostat/web/nuts/overview) is copyrighted. There are [specific provisions](https://ec.europa.eu/eurostat/web/gisco/geodata/statistical-units) for the usage of this dataset which must be respected. The usage of these data is subject to their acceptance. See the [Eurostat-GISCO website](https://ec.europa.eu/eurostat/web/gisco/geodata/statistical-units/territorial-units-statistics) for more information.
### Disclaimer
The designations employed and the presentation of material on these maps do not imply the expression of any opinion whatsoever on the part of the European Union concerning the legal status of any country, territory, city or area or of its authorities, or concerning the delimitation of its frontiers or boundaries. Kosovo*: This designation is without prejudice to positions on status, and is in line with UNSCR 1244/1999 and the ICJ Opinion on the Kosovo declaration of independence. Palestine*: This designation shall not be construed as recognition of a State of Palestine and is without prejudice to the individual positions of the Member States on this issue.
](https://github.com/JoeWDavies) |
| _version_ | See [npm](https://www.npmjs.com/package/gridviz?activeTab=versions) |
| _status_ | Since 2020 |
| _license_ | [EUPL 1.2](LICENSE) |
### Support and contribution
Feel free to [ask support](https://github.com/eurostat/gridviz/issues/new), fork the project or simply star it (it's always a pleasure).
### Copyright
The [Eurostat NUTS dataset](http://ec.europa.eu/eurostat/web/nuts/overview) is copyrighted. There are [specific provisions](https://ec.europa.eu/eurostat/web/gisco/geodata/statistical-units) for the usage of this dataset which must be respected. The usage of these data is subject to their acceptance. See the [Eurostat-GISCO website](https://ec.europa.eu/eurostat/web/gisco/geodata/statistical-units/territorial-units-statistics) for more information.
### Disclaimer
The designations employed and the presentation of material on these maps do not imply the expression of any opinion whatsoever on the part of the European Union concerning the legal status of any country, territory, city or area or of its authorities, or concerning the delimitation of its frontiers or boundaries. Kosovo*: This designation is without prejudice to positions on status, and is in line with UNSCR 1244/1999 and the ICJ Opinion on the Kosovo declaration of independence. Palestine*: This designation shall not be construed as recognition of a State of Palestine and is without prejudice to the individual positions of the Member States on this issue.