---
layout: paper-md
title: "Noncoding RNA-nucleated heterochromatin spreading is intrinsically labile and requires accessory elements for epigenetic stability."
paper_slug: 2018-07-18-heterochromatin-spreading-epigenetics
paper_url: /papers/paper/heterochromatin-spreading-epigenetics
source_url: https://pmc.ncbi.nlm.nih.gov/articles/PMC6070336/
pmcid: PMC6070336
---
**R. A. Greenstein, Stephen K. Jones, Eric C. Spivey, James R. Rybarski, Ilya J. Finkelstein, and Bassem Al-Sady**
*eLife*, Volume 7, e32948 (2018)
**DOI:** [10.7554/eLife.32948](https://doi.org/10.7554/eLife.32948)
---
## Table of Contents
- [Abstract](#abstract)
- [Introduction](#introduction)
- [Results](#results)
- [Discussion](#discussion)
- [Materials and Methods](#materials-and-methods)
- [Acknowledgements](#acknowledgements)
---
## Abstract
The heterochromatin spreading reaction is a central contributor to the formation of gene-repressive structures, which are re-established with high positional precision, or fidelity, following replication. How the spreading reaction contributes to this fidelity is not clear. To resolve the origins of stable inheritance of repression, we probed the intrinsic character of spreading events in fission yeast using a system that quantitatively describes the spreading reaction in live single cells. We show that spreading triggered by noncoding RNA-nucleated elements is stochastic, multimodal, and fluctuates dynamically across time. This lack of stability correlates with high histone turnover. At the mating type locus, this unstable behavior is restrained by an accessory _cis_-acting element _REIII_ , which represses histone turnover. Further, _REIII_ safeguards epigenetic memory against environmental perturbations. Our results suggest that the most prevalent type of spreading, driven by noncoding RNA-nucleators, is epigenetically unstable and requires collaboration with accessory elements to achieve high fidelity.
**Research organism:** _S. pombe_
---
## Introduction
The formation of gene-repressive heterochromatin domains is critical for genome integrity and for the establishment and maintenance of cell identity. Most heterochromatin formation occurs by a sequence-indifferent spreading reaction that propagates heterochromatic marks, structural proteins, and associated effector proteins outwards from nucleation sites. The precise extent of the spreading reaction has critical heritable consequences for cell identity. For example, in early pluripotent precursors, pre-existing heterochromatin domains spread, sometimes over megabases, to repress specifiers of inappropriate fates. Importantly, the final extent of spreading from a locus depends on the lineage pathway, hence it varies across different precursors ([Wen et al., 2009](#ref75); [Zhu et al., 2013](#ref80)) and has to be precise to achieve a stable cell fate and avoid disease ([Ceol et al., 2011](#ref13)). Similarly, spreading also specifies cell type in yeasts, where the cell type is maintained by repressing the mating cassettes at the mating type loci ([Ekwall et al., 1991](#ref18); [Rusche et al., 2003](#ref55)). Despite the centrality of the spreading reaction in shaping cell identity, its native and intrinsic cellular characteristics, as well as mechanisms for its inter-generational propagation, have remained opaque.
We have some understanding of how cells inherit silencing at nucleation sites, which constitute the DNA-sequence driven component of heterochromatin. Recent results in heterochromatin systems signaled by Histone 3 Lysine 9 and Lysine 27 methylation (H3K9me and H3K27me) indicate that several mechanisms act together to ensure intergenerational inheritance: continuous DNA-mediated recruitment of the histone methylase ([Audergon et al., 2015](#ref6); [Jia et al., 2004](#ref31); [Laprell et al., 2017](#ref36); [Ragunathan et al., 2015](#ref53); [Wang and Moazed, 2017](#ref74)), low histone turnover ([Aygün et al., 2013](#ref7); [Taneja et al., 2017](#ref66)), as well as the positive 'read-write' feedback loop for histone methylases ([Al-Sady et al., 2013](#ref2); [Zhang et al., 2008](#ref79)). Additionally, studies suggest that either the histone mark ([Gaydos et al., 2014](#ref22)) or the histone methylases ([Petruk et al., 2012](#ref51)) can persist trans-generationally.
These insights concerning nucleation sites do not necessarily account for how regions of heterochromatin distal to these sites are maintained. Unlike nucleation, which depends on DNA-based enzyme recruitment ([Bayne et al., 2010](#ref10); [Verdel et al., 2004](#ref70)), spreading depends on the ability of the system to propagate along the chromosome, independent of the underlying DNA sequence. Such propagation requires the 'read-write' positive feedback function of the system ([Al-Sady et al., 2013](#ref2); [Margueron et al., 2009](#ref39); [Müller et al., 2016](#ref42); [Noma et al., 2004](#ref48); [Zhang et al., 2008](#ref79)).
To determine how the spreading reaction acts in the maintenance of cell fate, it is central to understand the native behavior of two interconnected but separable phases of spreading: The initial spreading event, and the propagation of the states formed by this initial event through cell divisions. There is evidence that the initial spreading, at least in contexts outside the native chromosomal position, is stochastic, that is only some nucleation events result in a spreading event. This was first demonstrated by observing position effect variegation (PEV) in flies ([Elgin and Reuter, 2013](#ref19); [Muller, 1930](#ref41)). Such stochastic behavior would have to be mitigated across cells to achieve a coherent specification outcome.
Intergenerational propagation of spreading is straightforward to conceptualize when epigenetic information is strongly reinforced, but more challenging in situations where modified nucleosomes are less likely to persist. This is the case for H3K9me-signaled heterochromatin in the fission yeast system, which lacks DNA methylation that can reinforce the epigenetic state. Persistence of the modified state is opposed by an anti-silencing protein Epe1 ([Ayoub et al., 2003](#ref8); [Zofall and Grewal, 2006](#ref81)), which acts by antagonizing retention of H3K9me histones ([Aygün et al., 2013](#ref7); [Ragunathan et al., 2015](#ref53)), and passage through S-phase, which significantly weakens heterochromatin domains ([Chen et al., 2008](#ref14)). For fission yeast, there is evidence in favor of both high fidelity and stochastic propagation of the state formed by spreading. In support of a high fidelity model, theoretical work suggests that heterochromatin can display fundamentally bistable behavior, indicating that the 'ON' and 'OFF' states are intrinsically highly stable ([Dodd et al., 2007](#ref17)). Similar bistable behavior has also been experimentally observed in plants ([Angel et al., 2011](#ref4), [2015](#ref5)). Conversely, the telomere position effect (TPE) observed in budding and fission yeast supports a model where intergenerational inheritance is fundamentally stochastic. In TPE the heterochromatic state is switched at high frequencies in the inheriting generations ([Gottschling et al., 1990](#ref23); [Nimmo et al., 1994](#ref45)).
To distinguish whether spreading shapes and enables epigenetic maintenance of a cell identity locus via either of those modes, or combinations thereof, we focused on one of the most well understood heterochromatin loci, the fission yeast MAT locus, as a model. This locus remains tightly repressed to avoid simultaneous expression of both mating cassettes ([Ekwall et al., 1991](#ref18); [Noma et al., 2001](#ref46)). The MAT locus contains two _cis_ elements that directly recruit H3K9me. (1) _cenH,_ which is related to the _dg_ and _dh_ repeats at the pericentromere and _tlh2_ at the subtelomere ([Grewal and Klar, 1997](#ref25); [Hansen et al., 2006](#ref29)). These sequences nucleate H3K9me by at least two pathways, which depend on transcription of noncoding RNAs (ncRNAs): the RNAi pathway ([Hall et al., 2002](#ref27); [Volpe et al., 2002](#ref72)), and at least one separate pathway dependent on nascent RNA polymerase II transcripts, which requires the budding yeast Nrd1 homology Seb1 ([Marina et al., 2013](#ref40)) (collectively 'ncRNA-nucleation'). Separately and unique to the MAT locus, (2) a region downstream of _cenH_ including the _REIII_ element, which recruits the H3K9 histone methylase, HP1 proteins and histone deacetylases (HDACs). This is dependent on _REIII-_ bound transcription factors ([Jia et al., 2004](#ref31); [Kim et al., 2004](#ref34); [Yamada et al., 2005](#ref78)), but is independent of RNA processes. Heterochromatin formation within the MAT locus is confined by boundary elements ([Noma et al., 2001](#ref46), [2006](#ref47)).
In this work, we probe heterochromatin spreading nucleated both at the MAT locus as well as ectopically in the genome with a 'heterochromatin spreading sensor' (HSS), which enables quantitative examination of spreading separately from nucleation in single _S. pombe_ cells. Using the HSS, we show that ncRNA-dependent elements trigger epigenetically unstable spreading that is stabilized by an accessory RNA-independent _cis_-acting element. Both elements collaborate to form a high fidelity domain. The strategy we uncover has important implications for how heterochromatin spreading achieves and maintains 'epigenetic' character and can safeguard cell identity against environmental perturbations.
---
## Results
### A single-cell heterochromatin spreading sensor (HSS) controls for nucleation and cellular noise
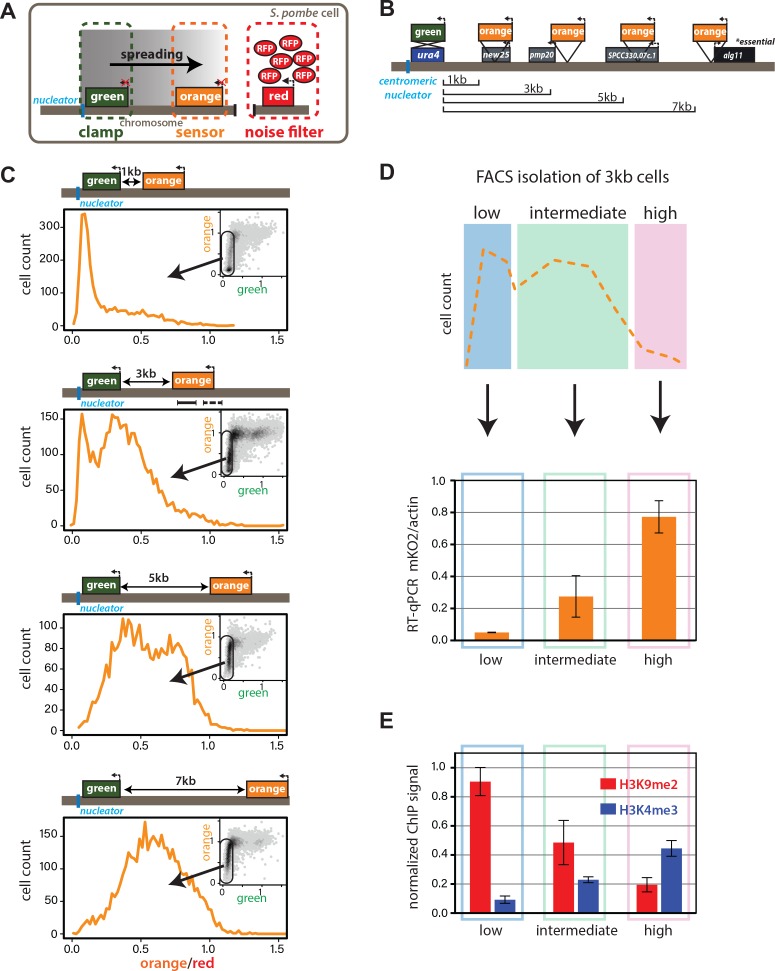
To assess the intrinsic behavior of heterochromatin spreading and what shapes its precise re-establishment with respect to position and extent of repression ('fidelity'), we employed transcriptionally encoded fluorescent reporters to read silencing by heterochromatin at a given locus, as previously reported. Several critical improvements over prior systems enable documentation of the spreading reaction at high sensitivity ([Bintu et al., 2016](#ref11); [Hathaway et al., 2012](#ref30); [Obersriebnig et al., 2016](#ref49); [Osborne et al., 2009](#ref50); [Xu et al., 2006](#ref77)). First, our system has high signal to noise and minimized delay from epigenetic changes to fluorescent output. We accomplish this using the weak, well-characterized _ade6_ gene promoter (_ade6p_) ([Allshire et al., 1994](#ref3); [Kagansky et al., 2009](#ref33)) to drive production of bright, fast-folding fluorescent proteins (XFPs) ([Al-Sady et al., 2016](#ref1)). Second, our system provides separate sensors for nucleation, spreading, and cellular noise. We used _ade6p-_ driven recoded super-folder GFP ([Pédelacq et al., 2006](#ref52)) ('green') and monomeric Kusabira Orange ([Sakaue-Sawano et al., 2008](#ref57)) ('orange') to report on nucleation and spreading, respectively ([Fig. 1A](#fig1)). A third XFP, an _ade6p_ -driven triple fusion of E2Crimson ([Strack et al., 2009](#ref63)) ('red', noise filter), is fully uncoupled from heterochromatin and inserted in a euchromatic locus. Here it reports on intrinsic or extrinsic noise that arises from cell-to-cell variation in the content of specific and general transcription factors and also translational efficiency ([Fig. 1A](#fig1)). To validate this reporter system, we characterized the non-heterochromatic state, via null mutation of _clr4_ (_Δclr4_), encoding the only _S. pombe_ H3K9 methyltransferase. We show that in the absence of heterochromatin, expression of the noise reporter ('red') correlates well with that of reporters for both nucleation ('green') and spreading ('orange') (Figure 1-figure supplement 1A,B), especially when all cells in the population are considered without applying a size gate (Figure 1-figure supplement 1B, ρ ~0.83-0.93). This analysis mode is required when cell number is limiting. When a smaller subset is considered where all the cells are of similar size and stage of the cell cycle, the correlation still provides useful noise filtering (Figure 1-figure supplement 1A), which becomes evident when the normalization is applied to _clr4+_ cells that fall in the size gate (Figure 1-figure supplement 1C). Thus, cellular noise is mitigated by dividing the signals from the proximal 'green' and distal 'orange' heterochromatic reporters by the signal of the 'red', euchromatic reporter ('green'/'red'; 'orange'/'red'). Together, these elements constitute our heterochromatin spreading sensor (HSS) ([Fig. 1A](#fig1)).
Figure 1. Heterochromatin spreading from ncRNA-nucleated elements is stochastic and produces intermediate states. (A) Overview of heterochromatin spreading sensor. Three transcriptionally encoded fluorescent proteins are inserted in the genome: The 'clamp' site enables isolation of successful nucleation events, the 'sensor' reports on spreading events and the 'noise filter' normalizes for cell-to-cell noise. (B) Overview of the ura4::dh HSS1-7kb strains. Genes downstream of the 'green' nucleation color are annotated. The alg11 gene is essential. (C) Spreading from ura4::dh visualized by the HSS with 'orange' inserted at different distances shown in (B). The 'red'-normalized 'orange' fluorescence distribution of 'green"OFF cells plotted on a histogram. Inset: 2D-density hexbin plot showing red-normalized 'green' and 'orange' fluorescence within the size gate, with no 'green' or 'orange' filtering. The 'green'OFF population is schematically circled. The fluorescence values are normalized to = 1 for the Δclr4 derivate of each strain. (D) TOP: cartoon overview of the FACS experiment for D. and E. 'green'OFF cells collected from the ura4::dh HSS3kb were separated in three populations ('Low', 'Intermediate' and 'High') as shown schematically based on the 'orange' fluorescence. BOTTOM: 'orange' RT-qPCR signal for the indicated populations. The y-axis is scaled to = 1 based on the 'orange' signal in Δclr4. Error bars indicate standard deviation of two replicate RNA isolations. (E) ChIP for H3K9me2 and H3K4me3 in the same populations as (D). Each ChIP is normalized over input and scaled to = 1 for a positive control locus (dh repeat for H3K9me2 and act1 promoter for H3K4me3). Error bars indicate standard deviation of two technical ChIP replicates. Primer pairs for RT-qPCR and ChIP are indicated by solid and dashed line, respectively, in the C. ura4::dh HSS3kb diagram.
##### Figure 1-figure supplement 1. Validation of ectopic heterochromatin spreading sensor.
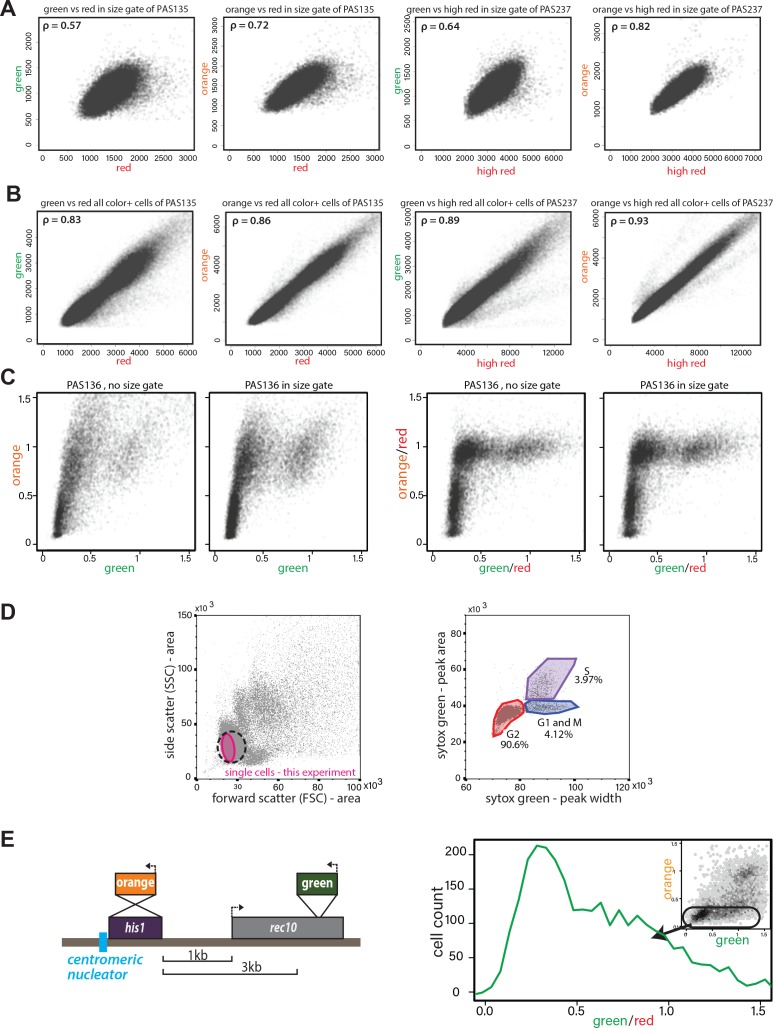
(**A**) Correlation of _ade6p:SFGFP_ or _ade6p:mKO2_ with _ade6p:3XE2C_ (Red) or _act1p:1XE2C_ (High Red) in _Δclr4_ HSS size-gated cells. LEFT: Plots of green and orange vs. red channel signals of size-gated PAS 135 (_Δclr4_ , 'red'). RIGHT: Plots of green and orange vs. red channel signals of size-gated PAS 237 (_Δclr4_ , 'high-red'). The Pearson correlation between 'green' and 'red'/'high-red' or 'orange' and 'red'/'high-red' is shown. (**B**) Correlation of _ade6p:SFGFP_ or _ade6p:mKO2_ with _ade6p:3XE2C_ (Red) or _act1p:1XE2C_ (High Red) in _Δclr4_ HSS in cells without size gate. Plots and Pearson correlation as above. (**C**) Effect of red-normalization on distribution of _clr4+_ HSS cells. Plots of green and orange vs. red channel signals of PAS 136, which contains the ectopic HSS ([Fig. 1C](#fig1)). LEFT: effect of using only size gate, without red normalization. RIGHT: effect of red-normalization with and without additional size gate. The distribution of cells is tightened by red-normalization. (**D**) Cell cycle stage of HSS and wild-type cells by flow cytometry. Wild-type cells (PM03, see strain table) were fixed, stained with Sytox green DNA stain, and analyzed by flow cytometry. LEFT: side vs. forward scatter plot. Dotted line: The approximate size gate encompassing all experiments reported. Pink area: cells analyzed in the experiment shown. RIGHT: Plot of area vs. width parameter for the Sytox green channel, gates are drawn to denote cell cycle phases, G2 (red), G1 and M (Blue), S (purple) as described ([Knutsen et al., 2011](#ref35)). (**E**) Stochastic spreading and intermediate states produced by ncRNA-driven nucleators are replicated at a second ectopic site. LEFT: Overview of the _his1::dh_ HSS3kb. The colors are reversed relative to the _ura4::dh_ HSS1-7kb with 'orange' as the 'nucleation clamp' and 'green' as the 'sensor'. 'Orange' replaces the _his1_ gene and 'green' is located 3 kb downstream within the _rec10_ open-reading frame. RIGHT: histogram of 'red'-normalized 'green' fluorescence distribution of 'orange'OFF cells. Inset: 2D density hexbin plot.
### Spreading from ectopic ncRNA nucleators is stochastic and produces intermediate states
We first examined the intrinsic behavior of the heterochromatin spreading reaction in an ectopic context. We constructed the initial ectopic HSS based on a strain where a part of the centromeric ncRNA-driven nucleation element (_dh_) is inserted proximal to the endogenous _ura4_ gene ([Canzio et al., 2011](#ref12); [Marina et al., 2013](#ref40)). We replaced the _ura4+_ open-reading frame (ORF) with 'green' to track nucleation element-proximal events. Then, to track distal events, we inserted 'orange' at one of several sites downstream from 'green' (_ura4::dh_ HSS1kb _, ura4::dh_ HSS3kb _, ura4::dh_ HSS5kb _ura4::dh_ HSS7kb, [Fig. 1B](#fig1)). The noise filter ('red') was inserted between _SPBC1711.11_ and _SPBC1711.12,_ a *bona fide* euchromatic region ([Garcia et al., 2015](#ref21)). All strains were initially constructed in a _Δclr4_ background, and we initiated heterochromatin formation by crossing in _clr4+_. We assessed heterochromatin formation after ~80-100 generations by quantifying the production of 'green' and 'orange'. This period is significantly longer than ~25 generation timeframe required for full formation of a heterochromatic domain ([Obersriebnig et al., 2016](#ref49)), ensuring that the population is at equilibrium.
To quantitatively assess the products of heterochromatin formation, we performed steady-state flow cytometry on log-phase cells, which were size-gated for small, recently divided cells (~91% G2, Figure 1-figure supplement 1D and supplemental experimental materials) to remove size- and cell cycle-related effects. At this stage, we only normalize the cells by the 'red' noise filter and scale the signal in each channel to _Δclr4_ , giving us a broad overview of the possible expression states of 'green' and 'orange'. We observe no cells that express 'green' but repress 'orange' (insets, [Fig. 1C](#fig1)), instead, all cells that are fully or partially 'orange' repressed are also robustly 'green' repressed. This observation, together with our finding that 'green' repression kinetically anticipates 'orange' repression (Figure 3-figure supplement 1), is consistent with heterochromatin spreading outward from the _ura4::dh_ nucleator. Considering 'green' repression thus a proxy for nucleation, we observed that cells populate a wide range of nucleation states rather than a single state, with the distribution of repressed states varying among the HSS distance sensor strains (_ura4::dh_ HSS1-7kb, [Fig. 1C](#fig1)). To specifically examine cells that have fully nucleated, we applied a computational 'nucleation clamp' that isolates cells with a 'green' signal that is lower than the median plus two standard deviations of wild-type cells containing no XFPs (see Appendix 1-Supplemental Materials and methods). Using 'orange' as a spreading proxy, we found spreading to be stochastic in nucleated cells, with some cells exhibiting full repression, but others partial repression or full de-repression (_Δclr4_ , x = 1) of the 'orange' spreading sensor. The proportion of cells that are fully repressed by spreading declines linearly with distance (scheme, [Fig. 1B](#fig1); data, [Fig. 1C](#fig1)). Intriguingly, cells that are not fully repressed mostly exhibit intermediate levels of repression, which are neither at values of full repression or de-repression.
We next assessed the nature of these intermediate states in the 3 kb distance reporter strain, where ~30% of cells had maximal repression at the 'orange' locus and the remainder had intermediate states ranging from strongly to weakly repressed. Using Fluorescence Activated Cell Sorting (FACS), we gated for successful nucleation in the 'green' channel and then binned the 'orange' channel for fully repressed (low), intermediate and de-repressed (high) populations ([Fig. 1D](#fig1), cartoon). We queried each bin for molecular events associated with heterochromatin formation, using RT-qPCR to determine the expression levels of 'orange', and Chromatin Immunoprecipitation (ChIP) to query the presence of the marks H3K9me2 and H3K4me3. These marks are thought to be mutually exclusive, associating with repressed heterochromatin and active promoters, respectively ([Noma et al., 2001](#ref46)). The message level of 'orange' is tightly repressed in the 'low' population (0.05 of max), partially repressed in the intermediate population (0.3 of max), and nearly fully 'de-repressed' (0.8 of max) in the 'high' population. Thus, cells with intermediate fluorescence also exhibit partial gene repression, demonstrating that fluorescence accurately reports on gene expression ([Fig. 1D](#fig1), RT primers indicated in diagram in 1C, solid line). Histone modification levels also correlated well with the HSS signals ([Fig. 1E](#fig1), ChIP primers indicated in diagram in 1C, dashed line). The 'low' fluorescence population has high H3K9me2 (0.9 of _dh_ , positive control) and low H3K4me3 (0.09 of actin, positive control); the intermediate population had intermediate H3K9me2 (0.49 of _dh_) and H3K4me3 (0.23 of actin), and the high population had low H3K9me2 (0.2 of _dh_) and higher H3K4me3 (0.44 of actin). Hence, successfully nucleated cells with intermediate fluorescence also exhibit intermediate amounts of the mRNA for 'orange' and histone marks reflecting heterochromatin (H3K9me2) and transcriptional activity (H3K4me3). These results support the notion that intermediate states of repression observed by cytometry represent intermediate states of spreading.
These observations are not due to the particularities of the ectopic site chosen or the behavior of the XFPs, as our results are recapitulated at the _his1_ locus (_his1::dh_ HSS3kb, Figure 1-figure supplement 1E), which contains only one gene (_rec10_) in the 'spreading zone', rather than several transcriptional units. Additionally, switching the nucleation and spreading reporter fluorophores produced similar results (Figure 1-figure supplement 1E). These results suggest that ncRNA-driven heterochromatin spreading at ectopic sites is intrinsically stochastic and multimodal, producing intermediate states of repression.
### Distinct forms of heterochromatin spreading at MAT
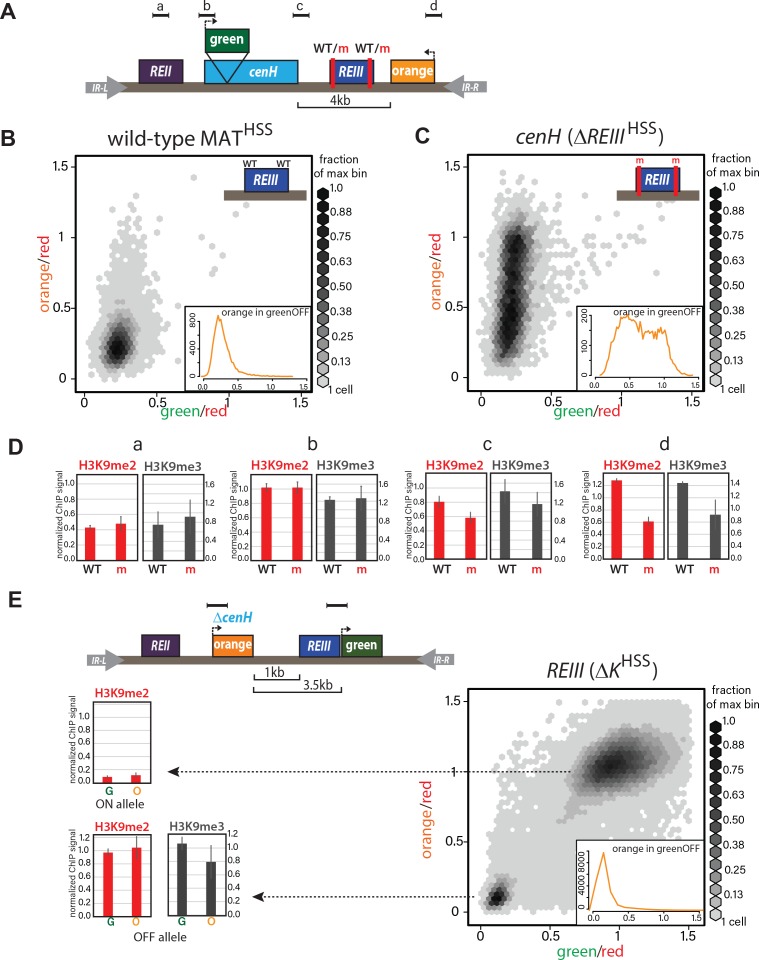
We next examined spreading behavior at the endogenous mating type locus (MAT), which is tightly repressed ([Grewal and Klar, 1997](#ref25); [Thon et al., 2002](#ref68)) and a *bona fide* high-fidelity locus, as it can behave in a bistable manner with stable epigenetic inheritance even when disrupted ([Grewal and Klar, 1996](#ref24)). The MAT locus has two known elements shown to recruit the H3K9 methylase Clr4: the _cenH_ element, homologous to the ncRNA-nucleated _dh_ fragment we inserted at _ura4_ and _his1_ , and the RNA-independent element termed _REIII_ ([Jia et al., 2004](#ref31); [Thon et al., 1999](#ref67)). At _REIII,_ two stress-responsive transcription factors, Atf1 and Pcr1, which form a heterodimer ([Wahls and Smith, 1994](#ref73)), recognize two DNA-binding sites within _REIII,_ directly recruit Clr4, Swi6/HP1 and histone deacetylases (HDACs) ([Jia et al., 2004](#ref31); [Kim et al., 2004](#ref34)) and are required for heterochromatin formation at MAT when _cenH_ is compromised ([Noma et al., 2004](#ref48)). We validated that MAT retains its well-documented tight repression following insertion of the HSS, placing the 'green' reporter within the _cenH_ nucleator, and the 'orange' reporter proximal to the _REIII_ nucleator. Both colors were fully repressed in the large majority of cells ([Fig. 2B](#fig2)), which is reproduced when the color orientations are reversed (Figure 2-figure supplement 1A). However, for both reporter configurations, the _REIII_ proximal color showed a small proportion of cells that are slightly de-repressed compared to the _cenH_ internal color, consistent with previous findings ([Thon and Friis, 1997](#ref69)). We conclude that the HSS can be used to dissect spreading at the MAT locus.
Figure 2. ncRNA-dependent and independent nucleation yields qualitatively different spreading reactions in the MAT locus. (A) Diagram of the reporters within MATHSS and ΔREIII HSS. WT and m for REIII indicate the presence or deletion of the Atf1/Pcr1 binding sites, respectively. (B) 2D-density hexbin plot showing the 'red'-normalized 'green' and 'orange' fluorescence for wild-type MATHSS cells. Scale bar shows every other bin cutoff as a fraction of the bin with the most cells. Inset: histogram of the 'red'-normalized 'orange' fluorescence distribution of 'green'OFF cells. (C) 2D-density hexbin plot and inset as above for ΔREIII HSS, which contains two 7 bp Atf1/Pcr1-binding site deletions (m) within the REIII element. (D) ChIP for H3K9me2 (red) and H3K9me3 (grey) for amplicons indicated in (A). normalized to dh. WT, wild-type MATHSS, m, ΔREIII HSS. (E) TOP: diagram of the reporters within ΔK HSS. The cenH nucleator and additional 5' sequence is deleted and replaced by 'orange'. 'green' is located directly proximal to REIII and serves as the nucleation clamp. ChIP amplicons are indicated as black bars. BOTTOM: 2D- density hexbin plot and inset as above. LEFT: ChIP for H3K9me2 (red) and H3K9me3 (grey) for 'green' and 'orange' in isolated ΔK HSS-ON or ΔK HSS-OFF alleles. In hexbin plots, the Δclr4 derivative of each strain was used to normalize the X- and Y-axes to = 1. Error bars indicate standard deviation of technical replicates.
##### Figure 2-figure supplement 1. Heterochromatin spreading characteristics of _cis_-acting elements at the tightly repressed MAT locus.
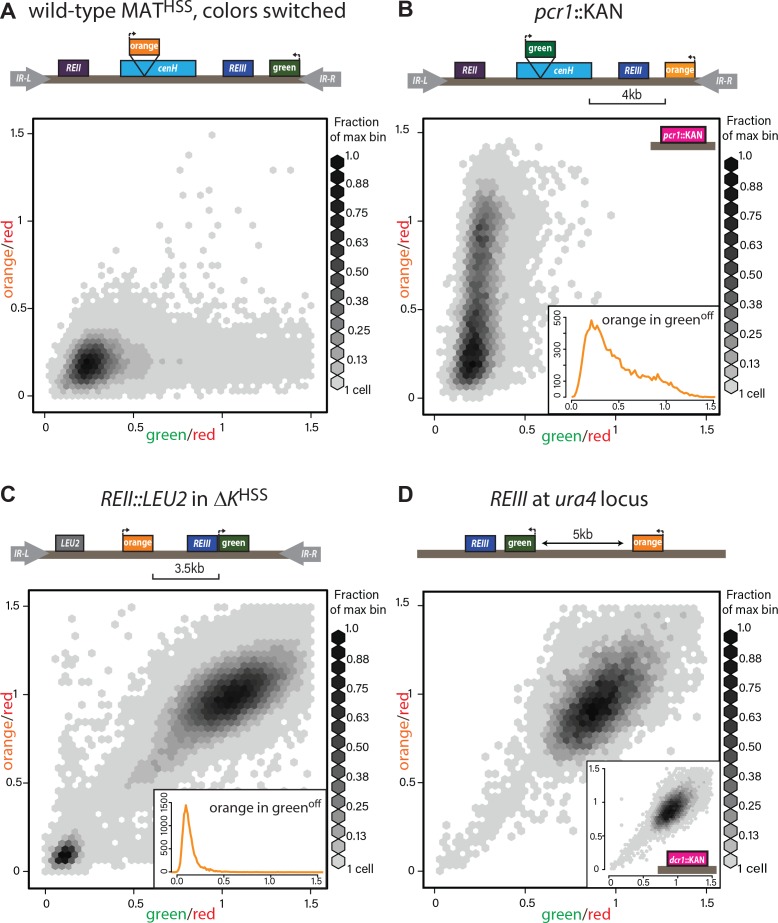
(**A**) The MATHSS documents tight repression of the wild-type MAT locus. As in [Figure 2A and B](#fig2), with 'green' and 'orange' switched. (**B**) Stochastic spreading with intermediate states in _pcr1::KAN. pcr1_ transcription factor was knocked-out in the PAS217 wild-type MATHSS. Plot and inset as in [Fig. 2B](#fig2). (**C**) _REII_ does not contribute to bimodal distribution seen for _ΔK_ HSS. The _REII_ locus (1 kb) was replaced with the _LEU2_ gene before _clr4+_ was introduced by cross. (**D**) _REIII_ is unable to establish spreading at an ectopic site. 2D density hexbin plots of _ura4::REIII_ HSS5kb. Normalized green and orange are near 1.0, indicating a failure to repress both reporters. Inset: 2D density hexbin plots of _ura4::REIII_ HSS5kb _dcr1::KAN. dcr1_ was deleted to release extra heterochromatin factors from RNAi- repressed loci. No additional silencing is detected.
##### Figure 2-figure supplement 2. _REIII_ is required for heterochromatin formation in _ΔK_ HSS.
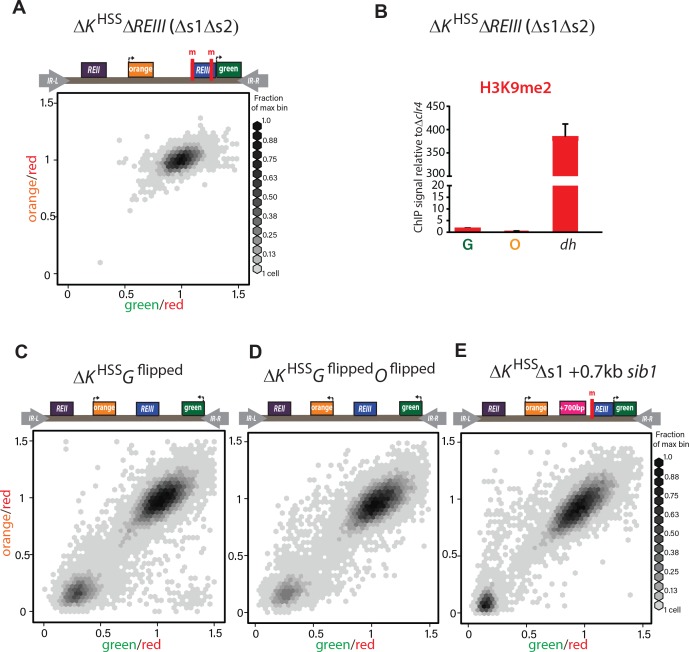
(**A**) Deletion of both Atf1-/Pcr1-binding sites before introduction of _clr4+_ in _ΔK_ HSS blocks gene silencing. In 34/34 strains tested (one representative shown), _ΔK_ HSS _Δs1Δs2_ cannot form repressed states. (**B**) H3K9me2 does not accumulate when both Atf1/Pcr1-binding sites are deleted in _ΔK_ HSS. H3K9me2 ChIP in _ΔK_ HSS _Δs1Δs2_ at 'green', 'orange' and _dh._ (_ΔK_ HSS-OFF accumulates H3K9me2 to similar extent as _dh,_ [Fig. 2E](#fig2)). Error bars indicate standard deviation of technical replicates. (**C**) 'green' orientation and position does not substantially affect _ΔK_ HSS behavior. In _ΔK_ HSS Gflipped'green' is flipped in orientation with respect to _ΔK_ HSS. (**D**) 'green' and 'orange' orientations do not substantially affect _ΔK_ HSS behavior. In _ΔK_ HSS Gflipped Oflipped'green' is located as in C and 'orange' is flipped in orientation with respect to _ΔK_ HSS. 'green' in (**C**) and (**D**) is 2.1 kb downstream from its location in _ΔK_ HSS now on the distal side of the _mat3m_ cassette. (**E**) Increasing distance between _REIII_ and 'orange' does not substantially affect _ΔK_ HSS behavior. The Atf1/Pcr1-binding site proximal to 'orange' was deleted (Δs1) and 700 bp of the _sib1_ ORF inserted to the left of the Δs1 site. 2D-hexbin plots as in [Fig. 2](#fig2).
We then examined spreading in cells nucleated solely by the _cenH_ element. The _REIII_ nucleator was inactivated by deleting the critical _cis_-acting Atf1/Pcr1-binding sites, to create a strain designated _ΔREIII_ HSS ([Fig. 2C](#fig2)). To our surprise, the high fidelity that the MAT locus exhibits in the repressed state ([Grewal and Klar, 1996](#ref24)) disappeared. Instead, _cenH_ nucleated spreading in the _ΔREIII_ strain behaved similarly to spreading from the ectopic ncRNA-nucleated strains, showing high stochasticity and predominantly intermediate repression states ([Fig. 2C](#fig2)). We wanted to address if this stochastic silencing is reflected in weakened heterochromatin assembly. We preformed ChIP for H3K9me2 and H3K9me3, marks signaling heterochromatin assembly ([Nakayama et al., 2001](#ref44)) and repression or spreading ([Al-Sady et al., 2013](#ref2); [Jih et al., 2017](#ref32); [Zhang et al., 2008](#ref79)), respectively. We found that these marks decline progressively towards the distal 'orange' reporter in _ΔREIII_ HSS ([Fig. 2D](#fig2)), compared to the wild-type (WT) MATHSS. This is consistent with the observed tight repression for WT MATHSS ([Fig. 2B](#fig2)) and weakened silencing at the distal 'orange' in _ΔREIII_ HSS ([Fig. 2D](#fig2)). It is possible that this difference in spreading results from an altered heterochromatin structure at _cenH_ in _ΔREIII_ HSS. However, H3K9me2 and me3 accumulation does not differ between _ΔREIII_ HSS and WT MATHSS at the _cenH_ nucleator, or the leftward _REII_ locus ([Fig. 2D](#fig2)). Thus, the observed behavior of _ΔREIII_ HSS is consistent with stochastic and multimodal spreading, rather than compromised nucleation at _cenH_.
To examine heterochromatin formation independent of _cenH_ , we used the historical _ΔK_ strain, where the entire _cenH_ nucleation element is deleted and replaced with a _ura4+_ reporter ([Grewal and Klar, 1996](#ref24)). We introduced the HSS into this context (_ΔK_ HSS, [Fig. 2E](#fig2)), placing the 'green' reporter proximal to _REIII_ and the 'orange' reporter distally, replacing _ura4_. We then introduced _clr4+_ by cross and directly cultured colonies derived from germinated _clr4+_ spores. We found that although _ΔK_ HSS has very weak nucleation compared to strains with intact ncRNA nucleators, the distribution of cells is sharply bimodal: Cells were either repressed at both reporters ('OFF', lower left corner) or de-repressed at both reporters ('ON', upper right corner; [Fig. 2E](#fig2)). We note that isolation of single colonies on nonselective media from original spores of the cross yields mostly ON (_ΔK_ HSS-ON) or OFF (_ΔK_ HSS-OFF) colonies, consistent with each state being metastable ([Grewal and Klar, 1996](#ref24); [Thon and Friis, 1997](#ref69)). This heterochromatin formation pattern requires _REIII,_ as in 34/34 strains tested, no silencing can be established if Atf1/Pcr1 binding sites are deleted before _clr4+_ is introduced (Figure 2-figure supplement 2A,B). Additionally, the bimodal behavior does not require the H3K9me-independent gene-repressive _REII_ element ([Hansen et al., 2011](#ref28)), as _ΔK_ HSS _REII::LEU2_ , containing a deletion of _REII_ , behaved similarly to _ΔK_ HSS (Figure 2-figure supplement 1C), and is further independent of reporter placement (Figure 2-figure supplement 2C,D). We next characterized the molecular signature of the locus. While in our two color plots cells that were repressed in 'green' did not show any de-repression in 'orange' ([Fig. 2E](#fig2), cells in bottom left corner), we wanted to test if the heterochromatic state at these loci correlated with this silencing pattern. Since we can isolate _ΔK_ HSS-ON and _ΔK_ HSS-OFF alleles by simple plating of _ΔK_ HSS cells, we performed H3K9me2 ChIP on both and H3K9me3 ChIP for _ΔK_ HSS-OFF cells (not detectable for _ΔK_ HSS-ON). We found that methylation correlates with the repression state ([Fig. 2E](#fig2)) and importantly, does not significantly differ between 'green' and 'orange'. Together, these result indicate that in _ΔK_ HSS-OFF cells heterochromatin spreading is continuous across the locus and does not, unlike _cenH-_ triggered spreading, accumulate any intermediates.
### Multi-generational single-cell imaging reveals ncRNA-driven spreading to be unstable
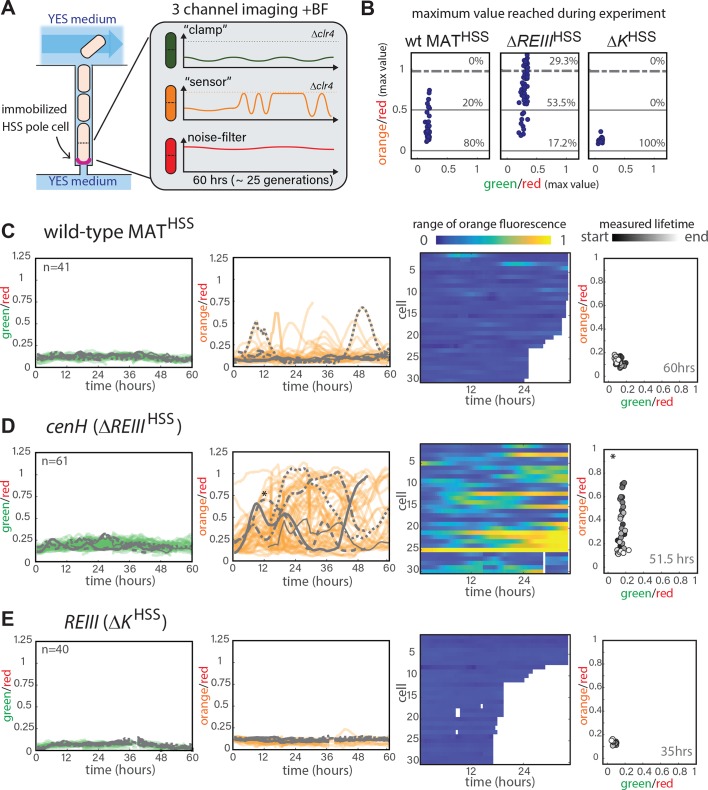
Our measurements thus far cannot reveal the dynamics of transitions between states. This requires long-term imaging of cells over a substantial number of generations (>20), which is difficult with traditional microscopy because of cell crowding effects. To deal with this issue, we used the Fission Yeast Lifespan Micro-dissector (FYLM) microfluidic device ([Spivey et al., 2017](#ref61), [2014](#ref62)), which traps the old pole of a rod shaped _S. pombe_ cell at the bottom of a chamber well for its entire lifetime. Sibling cells generated at the new pole by medial fission eventually exit the chamber. We continuously image the old-pole cell with fluorescence microscopy for up to 60 hr ([Fig. 3A](#fig3)). We note that unlike _Saccharomyces cerevisiae_ , _S. pombe_ does not execute an aging program but rather dies stochastically ([Coelho et al., 2013](#ref16); [Nakaoka and Wakamoto, 2017](#ref43); [Spivey et al., 2017](#ref61)). Thus, imaging _S. pombe_ over long timescales avoids the confounding effects of aging on epigenetic behavior ([Guarente, 2000](#ref26); [Li et al., 2017](#ref38)). To capture the long-range dynamics of spreading, we imaged approximately one hundred cells of each strain concurrently (see Figure 3-figure supplement 2B for a summary of cell fates in all experiments). For each cell, we imaged all three channels continuously, and performed similar normalizations as for the flow cytometry data (Appendix 1-Supplemental Materials and methods). We first imaged the HSS distance sensor strain (ectopic _ura4::dh_ HSS3kb). Our ability to observe cells that were initially fully de-repressed allowed us to trace 'green' and 'orange' repression kinetically. Consistent with linear heterochromatin spread outward of the _dh_ nucleator, we find that 'orange' repression is anticipated by repression at 'green' (Figure 3-figure supplement 1). While nucleation in this strain is not stable (likely due to 'green' being adjacent to, rather than within _dh_), over time intervals where nucleation does persist, we observed dynamic fluctuations in the distal 'orange' color without a fixed temporal pattern (Figure 3-figure supplement 2A and Figure 3-videos 1 and 2), which is not due to the repression state of 'green' (Figure 3-figure supplement 2F).
Figure 3. Single-cell analysis of nucleation and spreading using a Fission Yeast Lifespan Micro-dissector (FYLM). (A) Overview of the FYLM-based heterochromatin spreading assay. The old-pole cell is trapped at the bottom of one of hundreds of wells in the FYLM microfluidic device and is continuously imaged in brightfield (to enable cell annotation), green, orange and red channels. Hypothetical example traces are shown. (B) Maximum values attained by each nucleated cell for normalized 'orange' plotted against normalized 'green'. Solid horizontal lines correspond to y = 0 and y = 0.5. Dashed line corresponds to an ON cutoff determined by mean less three standard deviations for each strain's matched Δclr4 strain. Percentage of cells between each line was calculated. (C) FYLM analysis of wild-type MATHSS cells. CELL TRACES: 60 hr of normalized 'green' (left) and 'orange' (right) fluorescence in cells that maintained nucleation with the same five cells overlaid in different gray line styles in both plots. Gaps indicate loss of focus. HEATMAP: Up to 36 hr of normalized 'orange' fluorescence for 30 cells that maintained nucleation is represented from blue (0) to yellow (1). X-Y FLUORESCENCE PLOT: for one representative sample cell, plot of normalized 'green' and 'orange' fluorescence across its measured lifetime (grayscale). (D) FYLM analysis of ΔREIII HSS cells as in C. The example cell in the X-Y dot plot is marked with an asterisk(*) on the orange traces (E) FYLM analysis of ΔK HSS-OFF isolate, as in C., D. All cells were normalized to Δclr4 (max, 1).
##### Figure 3-figure supplement 1. Single-cell analysis of nucleation and spreading using a Fission Yeast Lifespan Micro-dissector (FYLM).
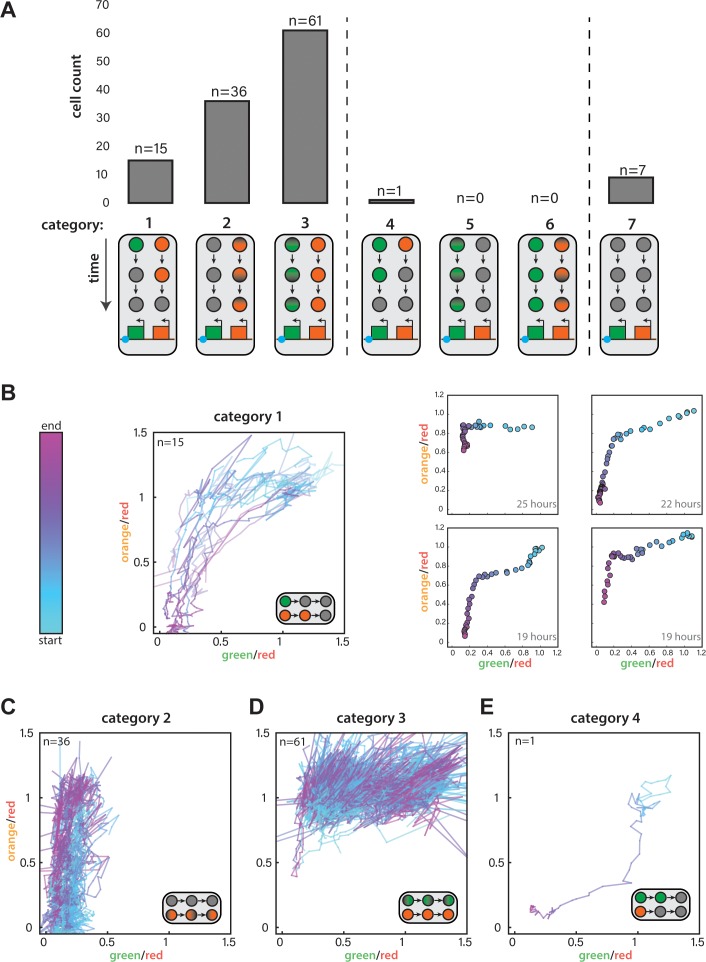
(**A**) For _ura4::dh_ HSS3kb FYLM experiments, counts of cells in each of seven categories. Diagrams indicate the time-dependent silencing behaviors of cells in each category. Categories 1-3 are consistent with proximal to distal silencing, whereas categories 4-6 are consistent with a distal to proximal silencing. (**B**) Time-dependent traces showing cells from Category 1 where the normalized 'green' and 'orange' values at each time point are plotted color-coded by time where blue and pink represent the start and end of the measurement, respectively. LEFT: Traces for all Category 1 cells, which begin at the start of the silencing event with both colors fully expressed and end when both colors have reached their local minimum. RIGHT: Four example cells where points represent 30-min time points colored from the start to end of the event. The duration of the time represented is indicated in the lower right corner. (**C**) Traces for Category 2 cells during their entire measured lifespan. (**D**) Traces for Category 3 cells during their entire measured lifespan. (**E**) Time-dependent traces for the one cell in Category 4. Lines are plotted and time is curated as in (**B**).
##### Figure 3-figure supplement 2. Single-cell analysis of nucleation and spreading using a Fission Yeast Lifespan Micro-dissector (FYLM).
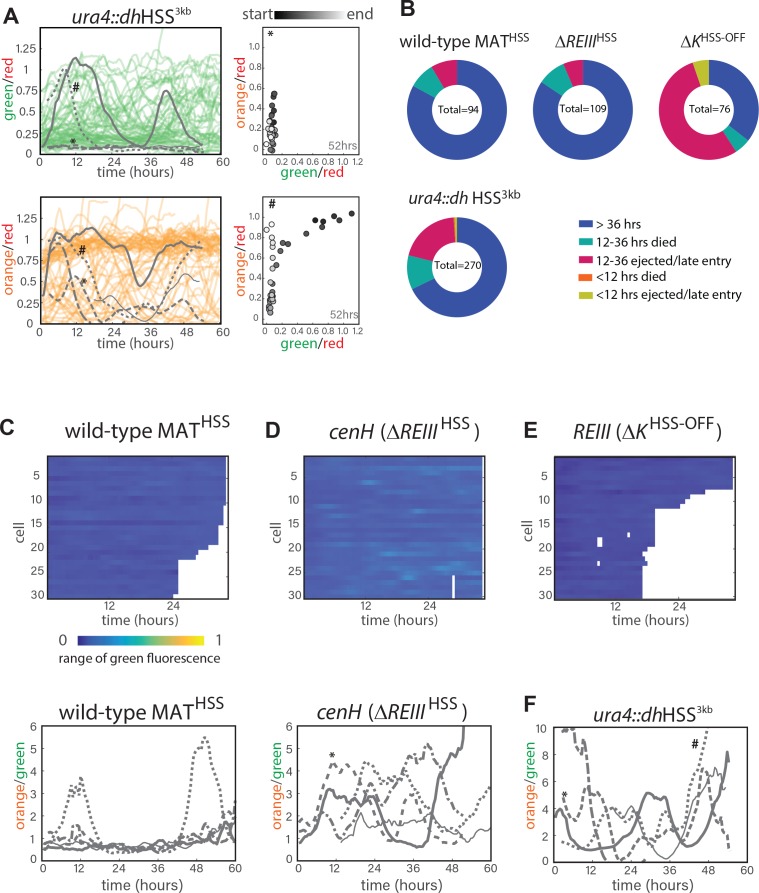
(**A**.) FYLM analysis of _ura4::dh_ HSS3kb cells. TOP LEFT: 60 hr of normalized 'green' fluorescence, a subset of cells are shown for clarity. five example cells are overlaid in gray each with different line types. BOTTOM LEFT: 60 hr of normalized 'orange' fluorescence in the matching subset of cells with the same five overlaid in gray. *, # represent two example cells. RIGHT: for two representative sample cells imaged, plots of normalized 'green' and 'orange' across its measured lifetime (grayscale). The corresponding cells are marked in the orange traces on LEFT. (**B**) Categorization of cell longevity of all cells analyzed in the FLYM experiment. Measured lifespan ends when a cell dies or is ejected from its capture channel. (**C**) For wild-type MATHSS TOP: 'green' fluorescence heatmap (blue (0) to yellow (1)) for the same 30 cells as in 3C. BOTTOM: 60 hr of traces for 'orange' divided by 'green' for the five example cells indicated in 3C. (**D**) 'green' fluorescence heatmap and 'orange'/"green' traces for _ΔREIII_ HSS as in C. (**E**) 'green' fluorescence heatmap _ΔK_ HSS as in C. (**F**) 'orange'/"green' traces for _ura4::dh_ HSS3kb as in C. *, # indicate the same cells as in A.
##### Figure 3-video 1. Cell #274 from strain PAS244.
Your browser is not supporting the HTML5