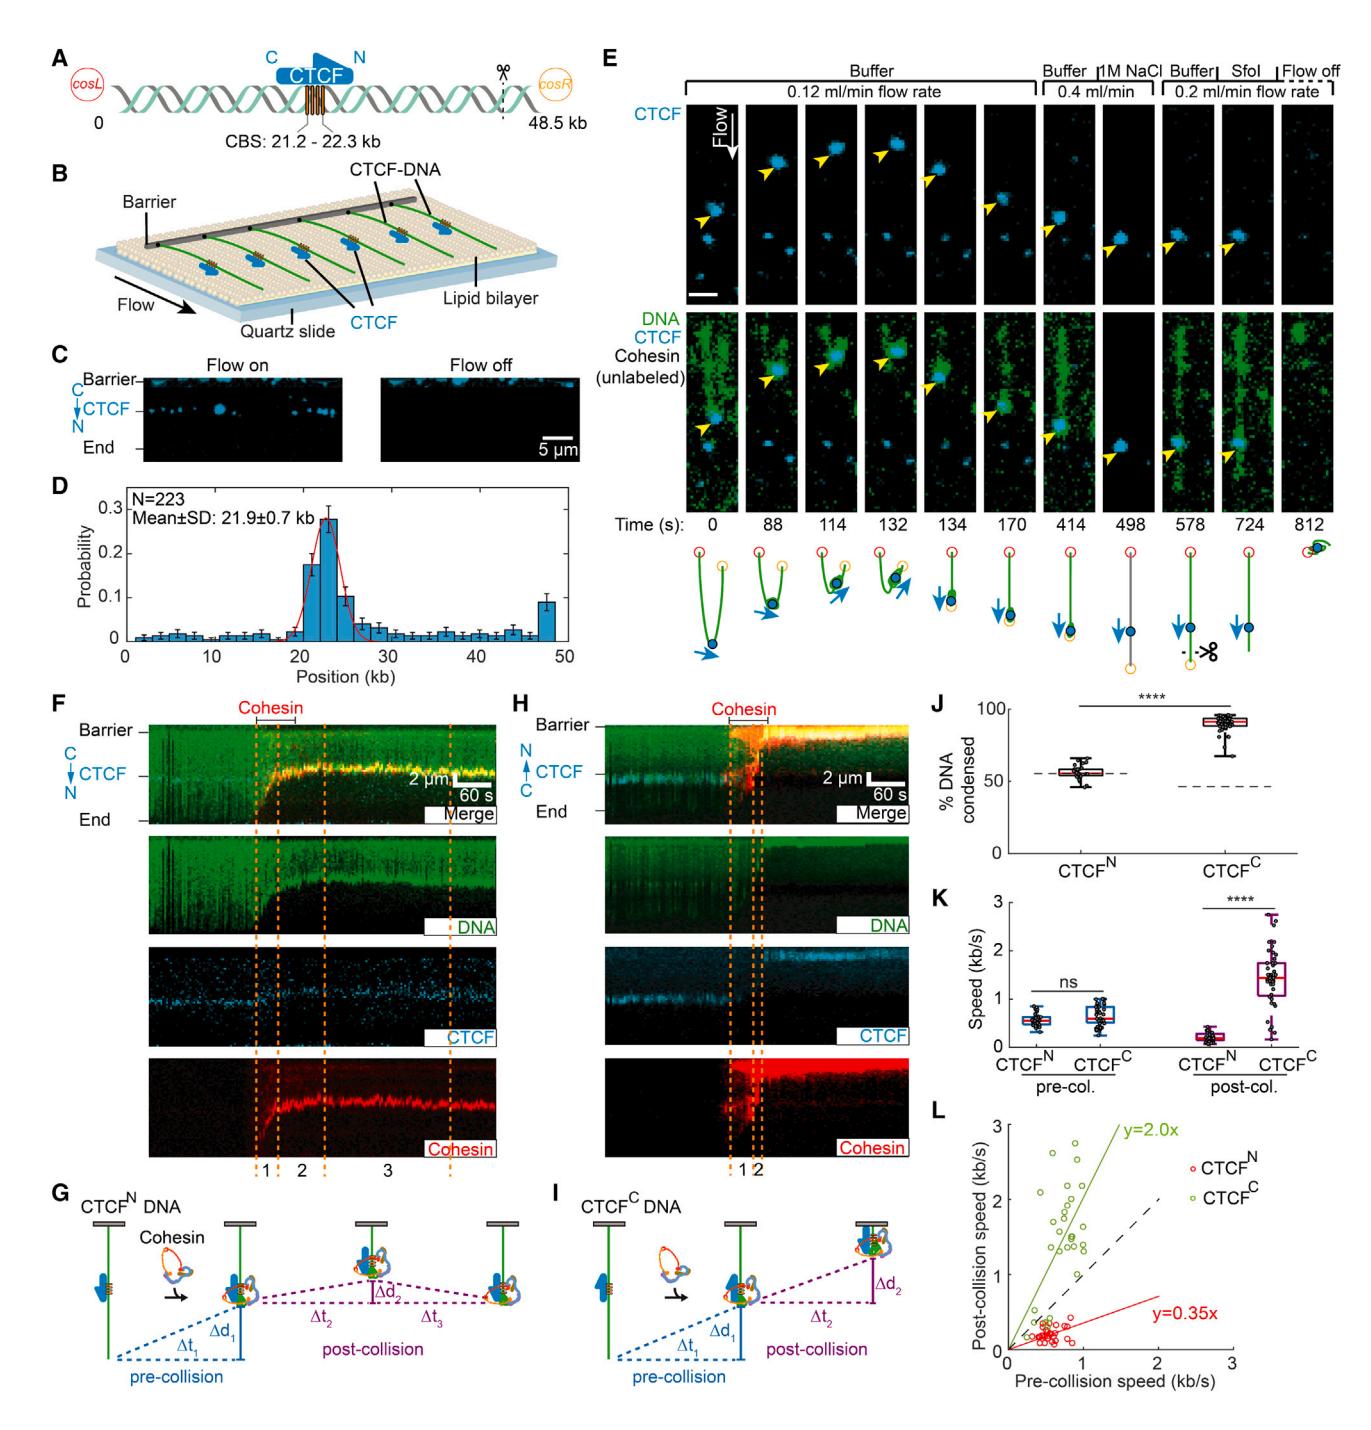
(A) Schematic of the DNA substrate. The location of the four CTCF-binding sites (CBSs) and the orientation of CTCF are shown in yellow boxes and a blue arrow, respectively. The black dashed line indicates the cutting site of restriction enzyme SfoI on DNA.
(B) An illustration of the DNA curtain assay where the cosL DNA end is anchored to the flowcell surface.
(C) Left: image showing Alexa 488-labeled CTCF binding to the DNA substrate. Right: turning off buffer flow retracts the DNA and CTCF to the barrier, confirming that CTCF is bound to the DNA.
(D) CTCF binding distribution on the DNA substrate. Red line: Gaussian fit. Error bars were generated by bootstrapping.
(E) Real-time visualization of CTCF stopping cohesin on U-shaped DNA. Both DNA ends are tethered to the flowcell surface. DNA is visualized with SYTOX Orange (green), and CTCF is labeled with an Alexa 488-conjugated antibody (blue). Upon cohesin injection, the DNA segment between the CTCF and right tether is compacted. At 134 s, the right tether detaches from the surface, causing the left DNA segment to extend by the buffer flow. A high-salt (1 M NaCl) wash at 498 s disrupts the looped DNA and washes out the SYTOX Orange stain. The DNA was restained by reinjecting imaging buffer. To identify the cosR end, we injected the restriction enzyme SfoI, which cleaves near cosR at 724 s. Yellow arrows show the positions of CTCF. Scale bars: 3 μm.
(F) Representative 3-color kymograph showing that CTCF (labeled with Alexa 488) arrests cohesin (labeled with Alexa 647) in the non-permissive (CTCFN) orientation. Dashed lines indicate the pre- and post-collision time points depicted in (G).
(G) A schematic of cohesin-mediated compaction on a non-permissive CTCF-containing DNA and its analysis. Pre-collision: DNA is first condensed a distance Δd1 for Δt1 s. Post-collision: the DNA is further compacted (Δd2) for a short time (Δt2). The small DNA loop generated during Δt2 is eventually dissipated (Δt3), as seen by the CTCF/cohesin complex returning to the pre-collision position.
(H) Representative 3-color kymograph showing that CTCF permits further compaction after cohesin encounters at the permissive (CTCFC) orientation. Dashed lines indicate the pre- and post-collision outcomes depicted in (I).
(I) A schematic of cohesin-mediated compaction on a permissive CTCF-containing DNA and its analysis for the pre-/post-collision. DNA continues to be compacted a distance Δd2 for Δt2 s after the collision.
(J) Quantification of the percentage of CTCFN-DNA and CTCFC-DNA condensed by cohesin. At least 32 DNA molecules were measured for each condition. The dashed lines indicate the CTCF-binding positions on DNA substrates.
(K) DNA compaction speed for the pre- and post-collisions with CTCFN and CTCFC. Boxplots indicate the median and quartiles. p values are obtained from two-tailed t test: ****p < 0.0001; ns, not significant.
(L) A comparison of the speed of individual cohesins before and after colliding with CTCFN (red) or CTCFC (green). The dashed line with a slope of 1 is included for reference.
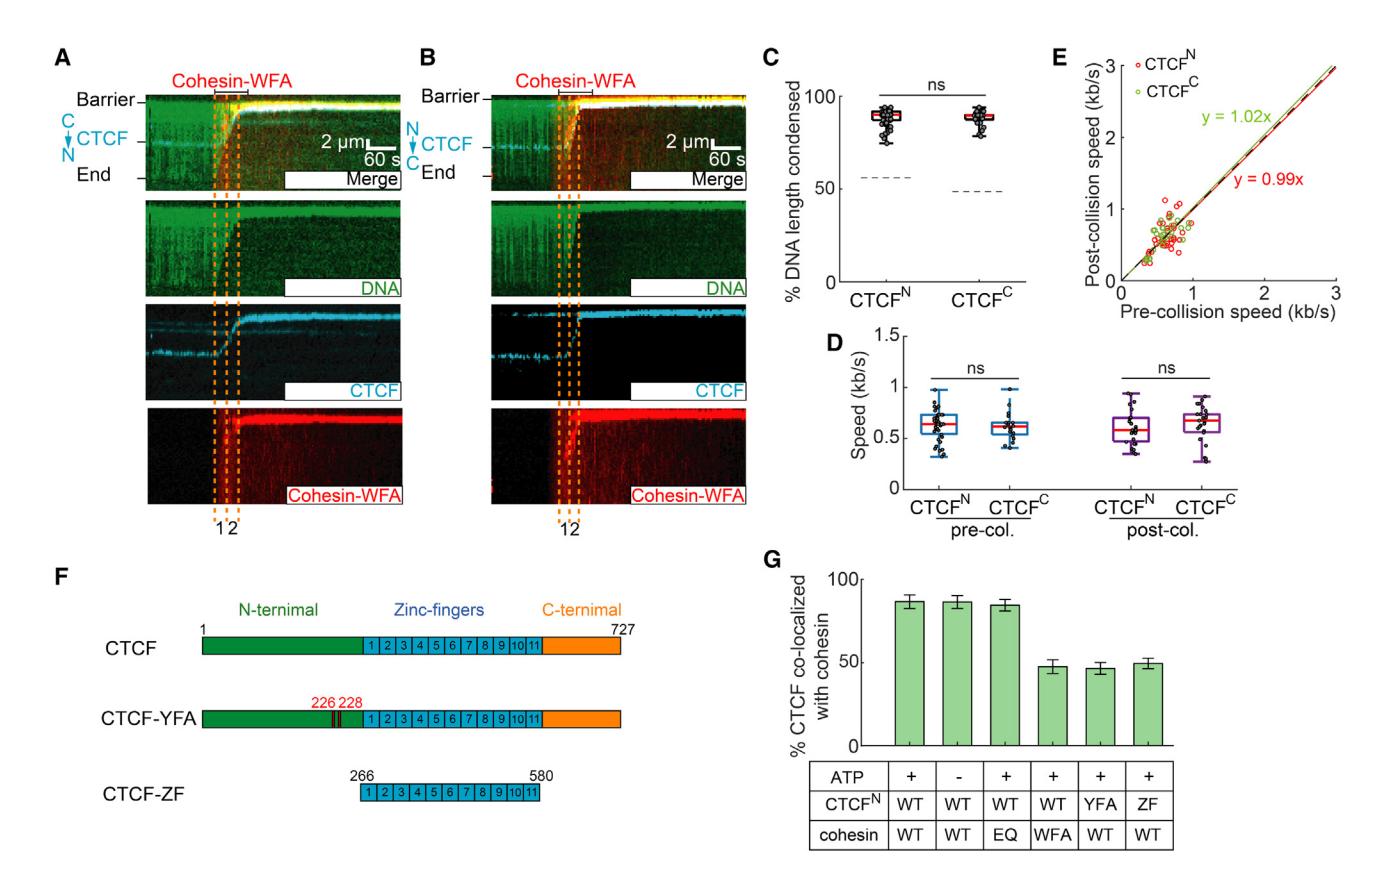
(A and B) Representative kymographs showing that cohesin-STAG1(W337A/F347A), termed cohesin-WFA, can completely compact DNA pre-bound with (A) CTCFN and (B) CTCFC.
(C) Quantification of the CTCFN-DNA and CTCFC-DNA condensed by cohesin-WFA. The dashed lines indicate the CTCF-binding positions on DNA substrates.
(D) Cohesin-WFA speed pre- and post-collisions with CTCFN or CTCFC.
(E) Correlation between the speeds of individual cohesins before and after colliding with CTCFN (red) or CTCFC (green). The dashed line is a guide with a slope of 1.
(F) Schematic of wild-type CTCF, CTCF Y226A/F228A mutant (CTCF-YFA), and the zinc-finger truncation (CTCF-ZF).
(G) Percent of CTCF or its mutants co-localized with cohesin variants on CTCFN-DNA. At least 30 DNA molecules were measured for each experiment. p values are obtained from two-tailed t test; ns, not significant.
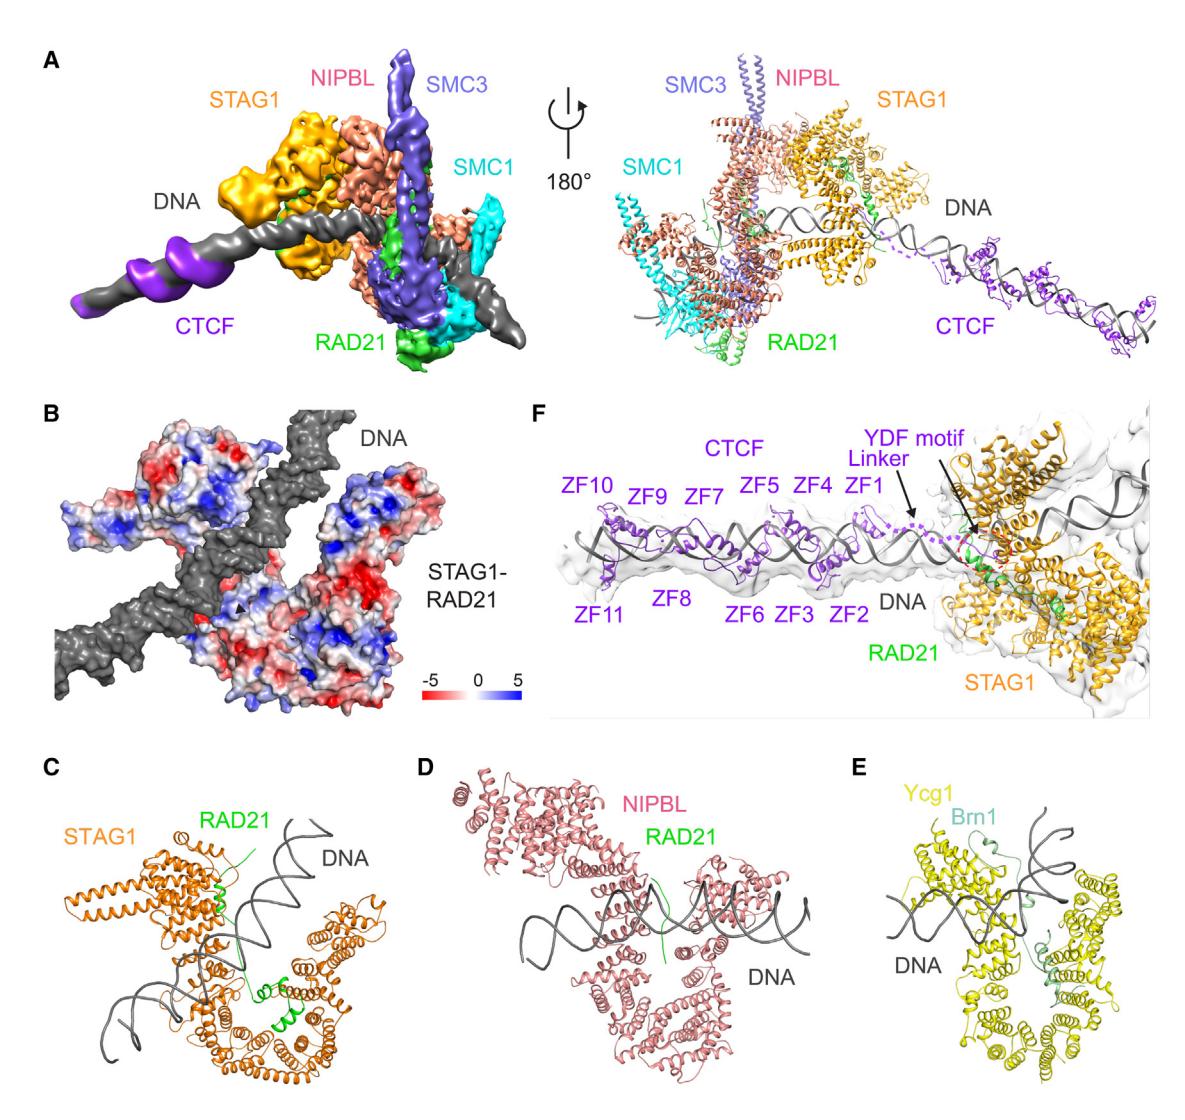
(A) Cryo-EM map (left) and model (right) of human cohesin-NIPBL-CTCF-DNA complex. DNA is captured by cohesin and NIPBL at one end and by CTCF at the other end, while its middle region contacts the top of both sides of U-shaped STAG1.
(B) Surface electrostatic potential of STAG1-RAD21 subcomplex. DNA contacts positively charged regions in STAG1 and RAD21.
(C–E) Structural comparison of HEAT repeat proteins STAG1 (C), NIPBL (D), and Ycg1 (E) binding to DNA duplex.
(F) Locally refined map of the STAG1-CTCF-DNA subcomplex. The models of STAG1, STAG1-bound RAD21 region, DNA, and CTCF YDF motif and ZFs are shown. The CTCF linker region flanked by the YDF motif and ZFs contacts DNA.
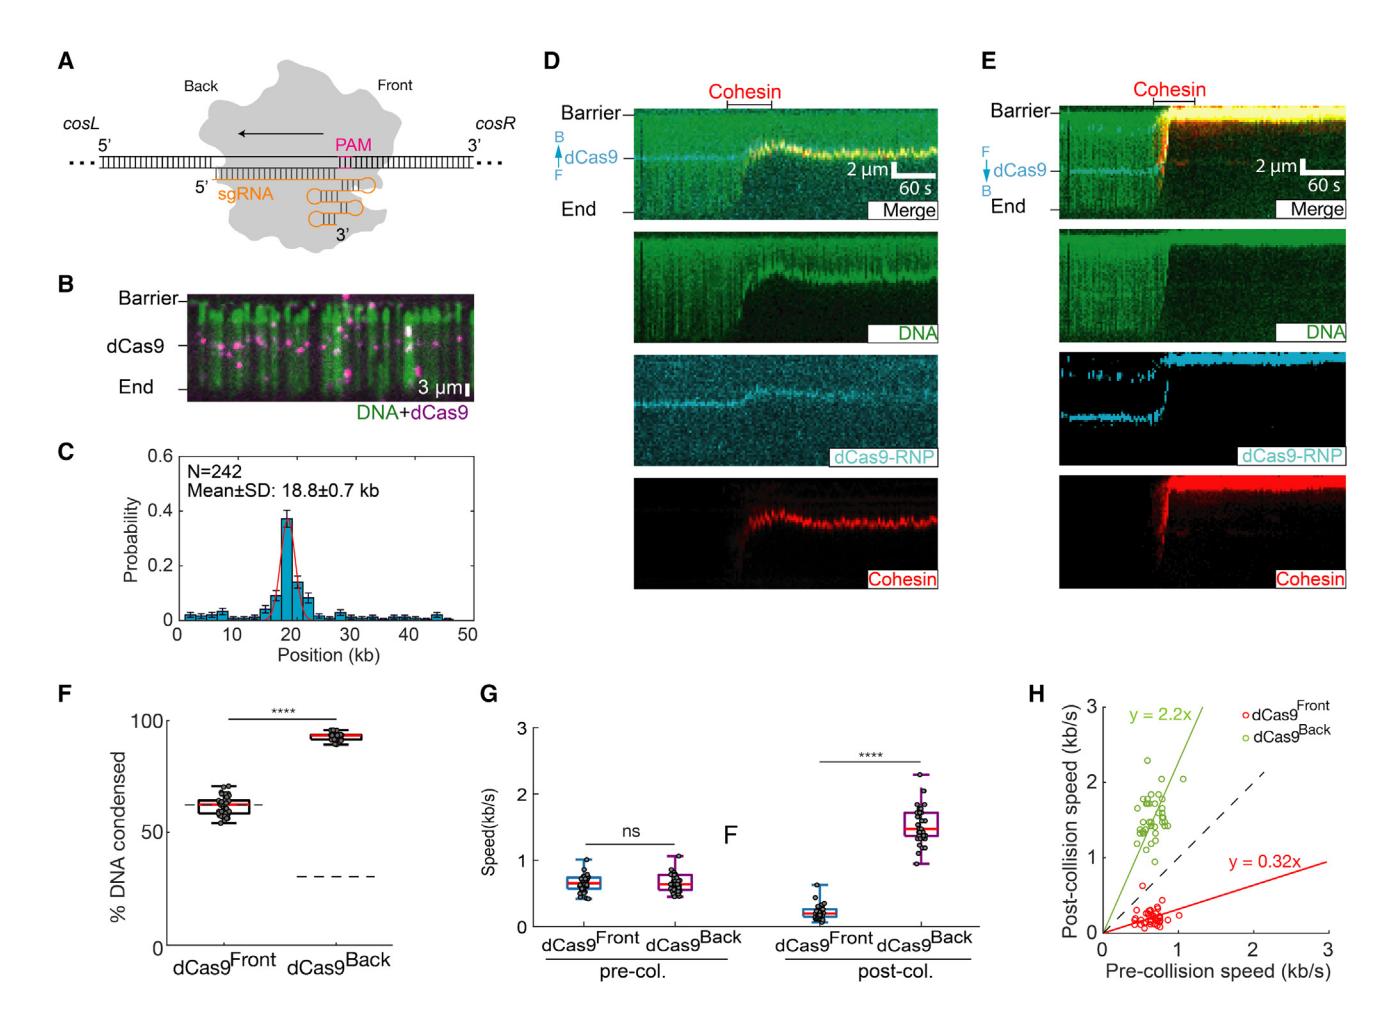
(A) Schematic of Cas9 binding its target DNA site. sgRNA is in orange. The direction of R-loop formation is indicated with an arrow. The Cas9 protospacer adjacent motif (PAM) faces the cosR DNA end, termed dCas9Front; PAM-distal side is termed dCas9Back.
(B) Image of Alexa 488-labeled dCas9 binding its target DNA.
(C) Binding distribution of dCas9 on the DNA substrate. Red line: Gaussian fit.
(D) Representative kymographs showing that dCas9 blocks cohesin when cohesin collides with the PAM-proximal dCas9 face (dCas9Front). For these experiments, the DNA is tethered via its cosL end. F, front; B, back.
(E) When cohesin collides with the PAM-distal dCas9 face (dCas9Back), its post-collision speed increases.
(F) Quantification of the percentage of dCas9Front-DNA and dCas9Back-DNA condensed by cohesin (N > 40 for each condition).
(G) Comparison of the pre- and post-collision cohesin speeds for dCas9Front and dCas9Back. p values are obtained from two-tailed t test: ****p < 0.0001; ns, not significant.
(H) A scatterplot showing the relationship for individual cohesin speed before and after collision with dCas9Front (red) and dCas9Back (green). The dashed line is for a reference (slope = 1).
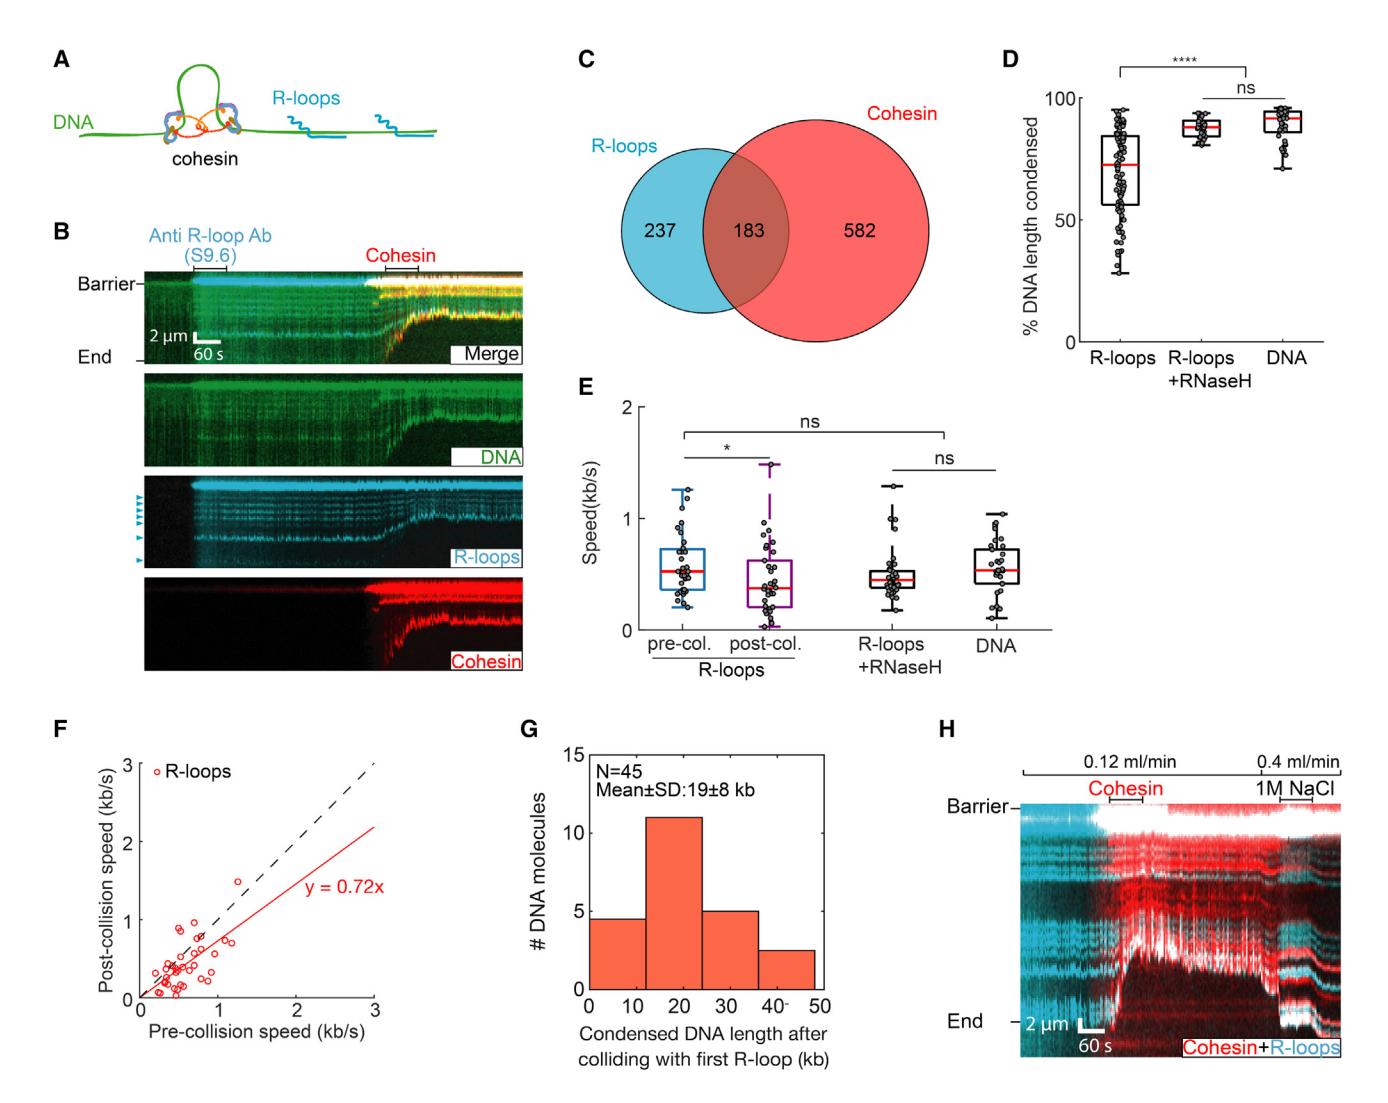
(A) Schematic of cohesin translocation on the R-loops DNA substrate.
(B) Representative kymographs showing cohesin colliding with R-loops. An Alexa 488-conjugated S9.6 antibody is used to image the R-loops prior to cohesin injection. R-loops are indicated by arrows.
(C) Venn diagram showing co-localization of R-loops and cohesin (n = 110 DNA molecules).
(D) R-loops significantly decrease DNA compaction, as compared with R-loops pre-treated with RNase H and non-transcribed DNA. N > 38 DNA molecules for each condition.
(E) After colliding with an R-loop, cohesin slows its DNA compaction. N > 38 for all conditions. p values are obtained from two-tailed t test: *p < 0.05; ns, not significant.
(F) Individual cohesin molecules slow upon colliding with their first R-loop. Dashed line is a guide with a slope of 1.
(G) The counts of DNA molecules showing cohesin continues to compact DNA for 20 kb after colliding with the first R-loop.
(H) Kymograph showing that a high-salt (1 M NaCl) wash disrupts the compacted DNA. However, cohesin remains associated with the R-loop.
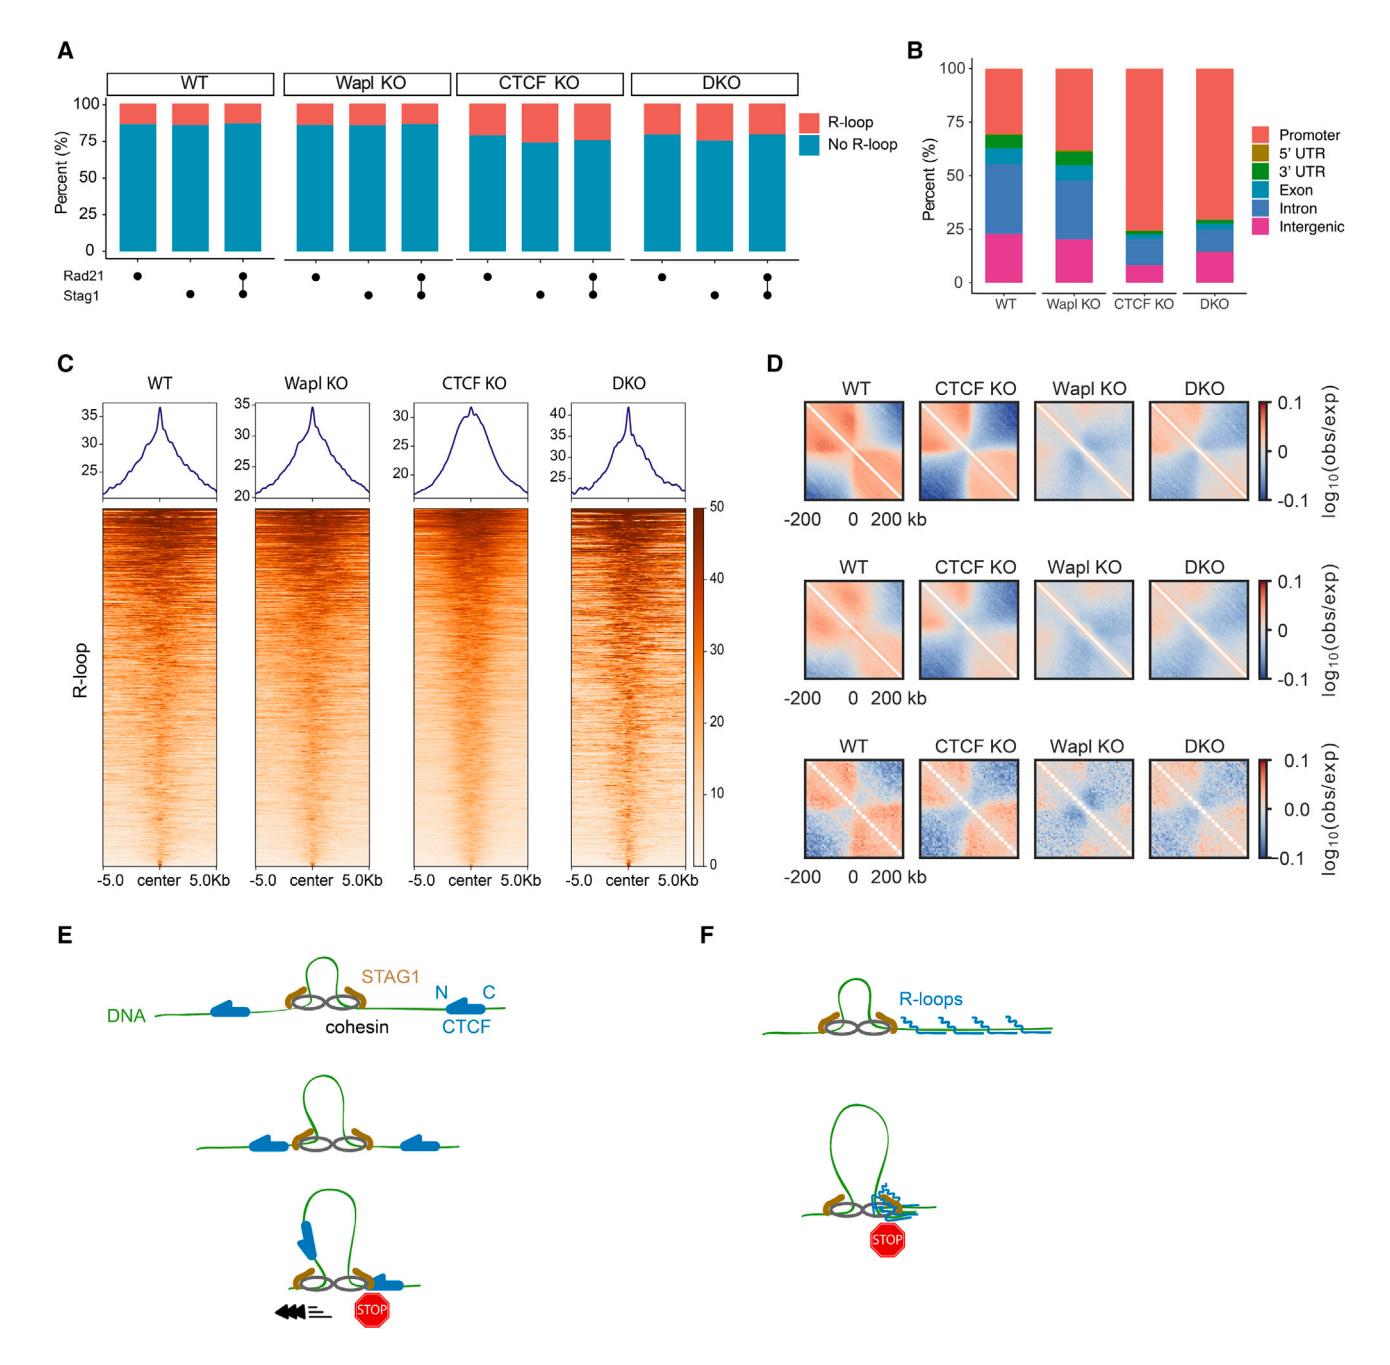
(A) Cohesin subunit Rad21 and Stag1 peak positions overlap with R-loops in WT, Wapl knockout (KO), CTCF KO, and CTCF/Wapl double KO (DKO) MEFs, as defined by ChIP-seq and DRIP-seq, respectively. Both previously published datasets were collected in mouse embryonic fibroblasts (MEFs).
(B) Genomic features of overlapping regions of Rad21, Stag1, and R-loop peaks in the indicated MEFs.
(C) Read-density profiles and heatmaps of R-loop reads across overlaps of Rad21, Stag1, and R-loop in the indicated MEFs.
(D) Average maps of chromosome contact enrichment ("observed-over-expected"; see supplemental information) in MEFs (WT and mutants) in the vicinity of all R-loops (top; n = 39,680; R-loops centered at 0 kb). To minimize effects of transcription start sites (TSSs) and RNA polymerase, we recomputed the maps excluding R-loops located within 10 kb of a transcription start site (middle; n = 27,542). Intergenic R-loops (n = 5,392) also generated insulation (bottom) in WT and mutant MEFs.
(E) A summary of cohesin regulation by CTCF. Cohesin is blocked by the N terminus of CTCF through its interaction with STAG1 but increases its velocity when it encounters the C terminus of CTCF.
(F) A summary of the effect of R-loop clusters on cohesin translocation.