{
"cells": [
{
"cell_type": "markdown",
"id": "e48279b4-107e-4a36-8989-1f4c849e2725",
"metadata": {
"tags": []
},
"source": [
"# Visualizing the Drug Epidemic in San Francisco "
]
},
{
"cell_type": "markdown",
"id": "fbd71f29-7203-4ed0-af53-5c0cfcd7a5dd",
"metadata": {},
"source": [
"### Introduction"
]
},
{
"cell_type": "markdown",
"id": "92b3e929-0216-4592-ad3f-2ee12a533622",
"metadata": {},
"source": [
"San Francisco, a city once celebrated for its vibrant and diverse cultures, has faced numerous challenges in recent years, particularly with regards to drug addiction and crime.
"
]
},
{
"cell_type": "markdown",
"id": "500f9663-e075-4c27-9d88-3a0dffc85bdb",
"metadata": {},
"source": [
"Drug overdose in San Francisco has been driven largely by the proliferation of the synthetic opioid fentanyl, according to the [SF Chronicle](https://www.sfchronicle.com/sf/article/S-F-is-investing-millions-in-overdose-response-16491976.php). On Dec. 17, 2021, Mayor London Breed declared an official state of emergency in the Tenderloin district to address the escalating epidemic."
]
},
{
"cell_type": "markdown",
"id": "c3561561-d5af-4d90-893a-4aaae3bb4e53",
"metadata": {},
"source": [
"\n",
"In response to these issues, the city has implemented several strategies aimed at addressing drug addiction and its impact on the community. These strategies include increasing law enforcement efforts to combat illegal drug possession and sales, as well as deploying more prescription medications, such as Narcan, to reverse overdose and save lives."
]
},
{
"cell_type": "markdown",
"id": "e47468a4-21e4-47f9-be4e-6a270f70a4de",
"metadata": {},
"source": [
"> Narcan, also known as naloxone, is a prescription medication used to reverse opioid overdose. It works by binding to the same receptors in the brain that opioids bind to, reversing their effects and restoring breathing."
]
},
{
"cell_type": "markdown",
"id": "7bffab82-899a-4fef-9253-14d3e2450342",
"metadata": {
"tags": []
},
"source": [
"### Quantifiable questions"
]
},
{
"cell_type": "markdown",
"id": "6255427b-3280-45b4-a236-c398e2fec775",
"metadata": {
"tags": []
},
"source": [
"Using the [San Francisco police response records](https://data.sfgov.org/Public-Safety/Police-Department-Incident-Reports-2018-to-Present/wg3w-h783), we hope to answer the following questions:\n",
"\n",
"- Where do most drug-related arrests and Narcan deployments occur?\n",
"- How do the frequencies change over time?\n",
"- When do drug-related arrests happen? Mornings? Evenings? Late at night?\n",
"- What's the correlation between drug-related arrests and Narcan deployments?"
]
},
{
"cell_type": "markdown",
"id": "91ed78ad-293b-486c-958f-58836c4eda43",
"metadata": {
"tags": []
},
"source": [
"## Downloading and Preparing Data "
]
},
{
"cell_type": "markdown",
"id": "bbdc4d14-3f78-440c-a122-b0de7dec2c66",
"metadata": {},
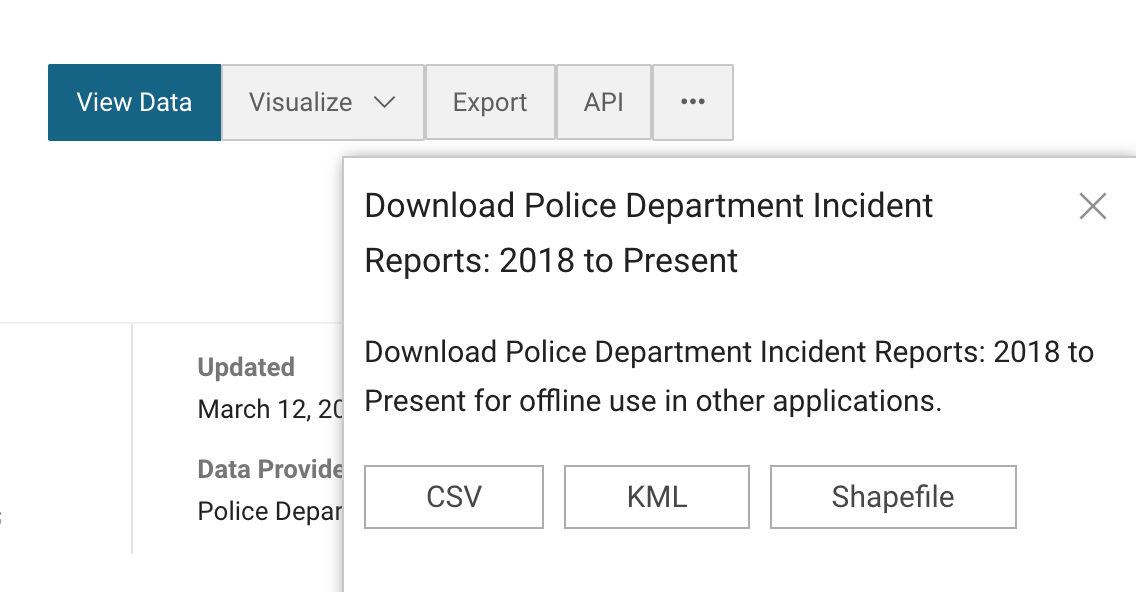
"source": [
"The SFPD data can be downloaded by clicking `Export` - `CSV`:"
]
},
{
"cell_type": "markdown",
"id": "b54a5bf5-6817-43c1-ab87-9829289f53ce",
"metadata": {},
"source": [
""
]
},
{
"cell_type": "markdown",
"id": "09ffe9e7-eca3-49c4-a439-c4aa9dd91a5d",
"metadata": {},
"source": [
"Save the dataset to `data/raw`. "
]
},
{
"cell_type": "markdown",
"id": "b9767faf-d1e7-4c96-b842-29bb793f2b01",
"metadata": {
"tags": []
},
"source": [
"> Notice that since this file is big (over 200MB), before committing and pushing to github, make sure to add the line '/data' in `.gitignore` file so that we don't break the git!"
]
},
{
"cell_type": "code",
"execution_count": 1,
"id": "7c83094f-c080-4f54-9a15-9465ad18ecd1",
"metadata": {
"tags": []
},
"outputs": [],
"source": [
"# importing the modules \n",
"import csv\n",
"import os\n",
"import pandas as pd\n",
"import altair as alt\n",
"from altair import datum"
]
},
{
"cell_type": "code",
"execution_count": 9,
"id": "b896ca80-c41a-4299-a649-bab40d51042a",
"metadata": {
"tags": []
},
"outputs": [],
"source": [
"# Creating portable path\n",
"data_dir = os.environ['DATA_DIR']\n",
"file_path = os.path.join(data_dir, 'raw/Police_Department_Incident_Reports__2018_to_Present.csv')"
]
},
{
"cell_type": "code",
"execution_count": 12,
"id": "c3cca097-597f-4052-a5fc-ba5d84d5e7dd",
"metadata": {},
"outputs": [],
"source": [
"# Reading the file from local data/raw folder\n",
"sfpd_data = pd.read_csv(file_path)"
]
},
{
"cell_type": "code",
"execution_count": 7,
"id": "bde9f523-6d79-426b-bebd-a7914b46bb01",
"metadata": {},
"outputs": [],
"source": [
"# Filtering for narcan deployment incidents\n",
"narcan_deployment = sfpd_data[sfpd_data['Incident Code'] == 51050]"
]
},
{
"cell_type": "code",
"execution_count": 4,
"id": "00952db8-bca7-4684-ba02-de96df4f2b09",
"metadata": {},
"outputs": [],
"source": [
"# Filtering for drug-related arrests\n",
"drug_arrest = sfpd_data[~sfpd_data['Incident Category'].isna()]\n",
"drug_arrest_data = drug_arrest[drug_arrest['Incident Category'].str.contains('Drug')]"
]
},
{
"cell_type": "code",
"execution_count": null,
"id": "7775692a-2db3-4b2b-bbc3-0e3e7d7617bf",
"metadata": {},
"outputs": [],
"source": [
"# Saving the files to the data/processed directory\n",
"narcan_deployment.to_csv(\"/Users/tracy/sfpd-data/data/processed/narcan_deployment.csv\")\n",
"drug_arrest_data.to_csv(\"/Users/tracy/sfpd-data/data/processed/drug_arrest_data.csv\")"
]
},
{
"cell_type": "markdown",
"id": "96ab5d12-7699-4ee1-ab3a-1b92ba14ccb0",
"metadata": {},
"source": [
"Now, load the filterd csv files and be ready to dive in!"
]
},
{
"cell_type": "code",
"execution_count": 22,
"id": "b1eca270-0d6e-4f5a-a15e-7d0fddb57d8a",
"metadata": {
"tags": []
},
"outputs": [],
"source": [
"# Read dataframes\n",
"drug_arrest = pd.read_csv('/Users/tracy/code/sfpd_data/data/processed/drug_arrest_data.csv')\n",
"narcan_deploy = pd.read_csv('/Users/tracy/sfpd-data/data/processed/narcan_deployment.csv')\n",
"# Make the column names snake_case\n",
"drug_arrest.columns = [col.lower().replace(' ', '_') for col in drug_arrest.columns]\n",
"narcan_deploy.columns = [col.lower().replace(' ', '_') for col in narcan_deploy.columns]"
]
},
{
"cell_type": "markdown",
"id": "c6d33f22-7837-4f7b-8c30-8a57b372310d",
"metadata": {
"tags": []
},
"source": [
"## Drug Arrests and Narcan Deployment by Neighborhood"
]
},
{
"cell_type": "markdown",
"id": "db93a908-ca55-4af3-a00f-cbc5ee5d52b5",
"metadata": {
"tags": []
},
"source": [
"### Finding #1\n",
"Our analysis found that most drug-related arrests occur in the **Tenderloin, South of Market (SoMa), and Mission** neighborhoods. Located near each other in downtown San Francisco, the two neighborhoods have undergone significant changes following rapid urban development and gentrification in recent years. Both suffer from a high-rate of poverty and crime."
]
},
{
"cell_type": "markdown",
"id": "489160fd-7f27-413a-89d1-72e60ce24dbf",
"metadata": {
"tags": []
},
"source": [
"#### Analysis and Visualization #1"
]
},
{
"cell_type": "code",
"execution_count": 359,
"id": "7082ad2a-cde4-44a1-81bb-d4f462b62dd3",
"metadata": {
"tags": []
},
"outputs": [
{
"data": {
"text/html": [
"\n",
"\n",
"
\n",
" \n",
" \n",
" | \n",
" analysis_neighborhood | \n",
" drug_arrests_count | \n",
"
\n",
" \n",
" \n",
" \n",
" | 1 | \n",
" Tenderloin | \n",
" 8613 | \n",
"
\n",
" \n",
" | 2 | \n",
" South of Market | \n",
" 2962 | \n",
"
\n",
" \n",
" | 3 | \n",
" Mission | \n",
" 1740 | \n",
"
\n",
" \n",
" | 4 | \n",
" Financial District/South Beach | \n",
" 451 | \n",
"
\n",
" \n",
" | 5 | \n",
" Bayview Hunters Point | \n",
" 437 | \n",
"
\n",
" \n",
" | 6 | \n",
" Castro/Upper Market | \n",
" 291 | \n",
"
\n",
" \n",
" | 7 | \n",
" Western Addition | \n",
" 273 | \n",
"
\n",
" \n",
" | 8 | \n",
" Haight Ashbury | \n",
" 242 | \n",
"
\n",
" \n",
" | 9 | \n",
" Nob Hill | \n",
" 213 | \n",
"
\n",
" \n",
" | 10 | \n",
" North Beach | \n",
" 137 | \n",
"
\n",
" \n",
"
\n",
"
\n",
"\n",
"
\n",
" \n",
" \n",
" | \n",
" Neighborhood | \n",
" Count | \n",
"
\n",
" \n",
" \n",
" \n",
" | 1 | \n",
" All Other Neighborhoods | \n",
" 8610 | \n",
"
\n",
" \n",
" | 2 | \n",
" Tenderloin | \n",
" 8613 | \n",
"
\n",
" \n",
"
\n",
"
\n",
"\n",
"
\n",
" \n",
" \n",
" | \n",
" analysis_neighborhood | \n",
" narcan_deployment_count | \n",
"
\n",
" \n",
" \n",
" \n",
" | 1 | \n",
" Tenderloin | \n",
" 401 | \n",
"
\n",
" \n",
" | 2 | \n",
" South of Market | \n",
" 153 | \n",
"
\n",
" \n",
" | 3 | \n",
" Financial District/South Beach | \n",
" 56 | \n",
"
\n",
" \n",
" | 4 | \n",
" Mission | \n",
" 38 | \n",
"
\n",
" \n",
" | 5 | \n",
" Bayview Hunters Point | \n",
" 15 | \n",
"
\n",
" \n",
" | 6 | \n",
" Castro/Upper Market | \n",
" 12 | \n",
"
\n",
" \n",
" | 7 | \n",
" Western Addition | \n",
" 10 | \n",
"
\n",
" \n",
" | 8 | \n",
" Marina | \n",
" 7 | \n",
"
\n",
" \n",
" | 9 | \n",
" Chinatown | \n",
" 7 | \n",
"
\n",
" \n",
" | 10 | \n",
" North Beach | \n",
" 6 | \n",
"
\n",
" \n",
"
\n",
"
\n",
"\n",
"
\n",
" \n",
" \n",
" | \n",
" Neighborhood | \n",
" Count | \n",
"
\n",
" \n",
" \n",
" \n",
" | 1 | \n",
" All Other Neighborhoods | \n",
" 355 | \n",
"
\n",
" \n",
" | 2 | \n",
" Tenderloin Incidents | \n",
" 401 | \n",
"
\n",
" \n",
"
\n",
"
\n",
"\n",
"
\n",
" \n",
" \n",
" | \n",
" incident_date | \n",
" count | \n",
" incident_date_2 | \n",
"
\n",
" \n",
" \n",
" \n",
" | 0 | \n",
" 2018-01 | \n",
" 337 | \n",
" 2018-01 | \n",
"
\n",
" \n",
" | 1 | \n",
" 2018-02 | \n",
" 356 | \n",
" 2018-02 | \n",
"
\n",
" \n",
" | 2 | \n",
" 2018-03 | \n",
" 423 | \n",
" 2018-03 | \n",
"
\n",
" \n",
" | 3 | \n",
" 2018-04 | \n",
" 348 | \n",
" 2018-04 | \n",
"
\n",
" \n",
" | 4 | \n",
" 2018-05 | \n",
" 384 | \n",
" 2018-05 | \n",
"
\n",
" \n",
"
\n",
"
\n",
"\n",
"
\n",
" \n",
" \n",
" | \n",
" incident_date | \n",
" count | \n",
" incident_date_2 | \n",
"
\n",
" \n",
" \n",
" \n",
" | 0 | \n",
" 2018-01 | \n",
" 4 | \n",
" 2018-01 | \n",
"
\n",
" \n",
" | 1 | \n",
" 2018-02 | \n",
" 13 | \n",
" 2018-02 | \n",
"
\n",
" \n",
" | 2 | \n",
" 2018-03 | \n",
" 7 | \n",
" 2018-03 | \n",
"
\n",
" \n",
" | 3 | \n",
" 2018-04 | \n",
" 5 | \n",
" 2018-04 | \n",
"
\n",
" \n",
" | 4 | \n",
" 2018-05 | \n",
" 3 | \n",
" 2018-05 | \n",
"
\n",
" \n",
"
\n",
"
\n",
"\n",
"
\n",
" \n",
" \n",
" | \n",
" incident_day_of_week | \n",
" incident_time | \n",
" count | \n",
" hour | \n",
"
\n",
" \n",
" \n",
" \n",
" | 0 | \n",
" Friday | \n",
" 00 | \n",
" 73 | \n",
" 00:00 | \n",
"
\n",
" \n",
" | 1 | \n",
" Friday | \n",
" 01 | \n",
" 37 | \n",
" 01:00 | \n",
"
\n",
" \n",
" | 2 | \n",
" Friday | \n",
" 02 | \n",
" 23 | \n",
" 02:00 | \n",
"
\n",
" \n",
" | 3 | \n",
" Friday | \n",
" 03 | \n",
" 33 | \n",
" 03:00 | \n",
"
\n",
" \n",
" | 4 | \n",
" Friday | \n",
" 04 | \n",
" 22 | \n",
" 04:00 | \n",
"
\n",
" \n",
"
\n",
"