value
d3.max(data, function(d) { return +d.value; })])
value
d3.min(data, function(d) { return +d.value; })])
objects are containers for named values called properties or methods. We can call any element of the object with its name:
var myObject = {name:"Nicolas", sex:"Male", age:34}
myObject.name
myObject["name"]
array of 5 numbersAn array is a special variable, which can hold more than one value at a time. Arrays use numbered indexes.
var myArray = [12, 34, 23, 12, 89]
myArray[0]
myArray[myArray.length - 1]
myArray.pop() myArray.push(45)
myArray.indexOf(34)
var myArray = ['a', 'b', 'c', 'd', 'e', 'f', 'g'];
var toRemove = ['b', 'c', 'g'];
filteredArray = myArray.filter( function( el ) {
return !toRemove.includes( el );
} );
var myArray = ['a', 'b', 'c', 'd', 'e', 'f', 'g'];
var tokeep = ['b', 'c', 'g', 'o', 'z'];
filteredArray = myArray.filter( function( el ) {
return tokeep.includes( el );
} );
name is toto
data.filter(function(d){ return d.name == "toto" })
name is different from toto
data.filter(function(d){ return d.name != "toto" })
name is toto OR tutu
data.filter(function(d){ return (d.name == "toto" || d.name == "tutu") })
name has a value included in the list tokeep
tokeep = ["option1", "option2", "option3"]
data.filter(function(d,i){ return tokeep.indexOf(d.name) >= 0 })
data.filter(function(d,i){ return i<10 })
ifelse statement
.style("fill", function(d){ if(d.x<140){return "orange"} else {return "blue"}})
value. Use + instead of - for reverse order.
data.sort(function(a,b) { return +a.value - +b.value })
name. Use descending for reverse order.
data.sort(function (a,b) {return d3.ascending(a.name, b.name);});
name1 and name2.
data.sort(function(a,b) { return d3.ascending(a.name1, b.name1) || d3.ascending(a.name1, b.name2) } )
name1 and then on 1 numeric called value.
data.sort(function(a,b) { return d3.ascending(a.name1, b.name1) || (a.value - b.value) } )
name1 according to the order provided in the variable targetOrder.
data.sort(function(a,b) {
return targetOrder.indexOf( a.name1 ) > targetOrder.indexOf( b.name1 );
});
value. Use + instead of - for reverse order.
data.sort(function(a,b) { return +a.value - +b.value })
name. Use descending for reverse order.
data.sort(function (a,b) {return d3.ascending(a.name, b.name);});
name
var allGroup = d3.map(data, function(d){return(d.name)}).keys()
for loop from one to ten:
var i
for (i = 0; i < 10; i++) {
console.log(i)
}
for loop for all the elements of a list: (Note that it returns 0, 1, 2, not a, b, c)
var allGroup = ["a", "b", "c"]
for (i in allGroup){
console.log(i)
}
while loop to count from 0 to 10
while (i < 10) {
console.log(i)
i++;
}
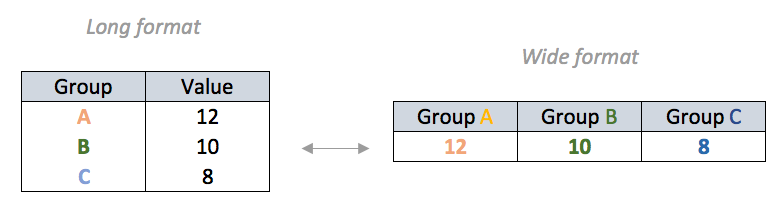
It is a common task in data science to swap between wide (or untidy) format to long (or tidy) format. In R, there is a package called tidyr that is entirely dedicated to it. It is definitely doable in Javascript using the code snippets below. In case you're not familiar with this concept, here is a description of what these formats are:

Note: it is strongly advised to perform these data wrangling steps out of your javascript to save loading time of your dataviz
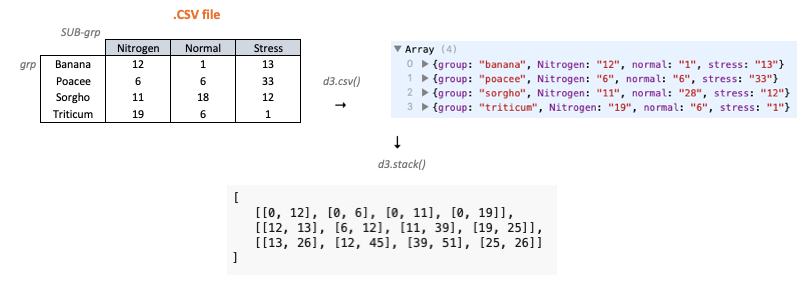
wide to long format.
d3.csv("https://raw.githubusercontent.com/holtzy/D3-graph-gallery/master/DATA/data_correlogram.csv", function(data) {
// Going from wide to long format
var data_long = [];
data.forEach(function(d) {
var x = d[""];
delete d[""];
for (prop in d) {
var y = prop,
value = d[prop];
data_long.push({
x: x,
y: y,
value: +value
});
}
});
// Show result
console.log(data_long)
long to wide format.
d3.csv("https://raw.githubusercontent.com/holtzy/D3-graph-gallery/master/DATA/data.csv", function(data) {
//todo
})
Stacking data is a common practice in dataviz, notably for barcharts and area charts. Stacking applies when a dataset is composed by groups (like species) and subgroups like soil condition. Stacking is possible thanks to the d3.stack() function, which is part of the d3-shape module. Here is an illustration of what happens when you read data from .csv format and stack it.

.csv format
d3.csv("https://raw.githubusercontent.com/holtzy/D3-graph-gallery/master/DATA/data_stacked.csv", function(data) {
// Have a look to the data
console.log(data)
// List of subgroups = header of the csv files = soil condition here
var subgroups = data.columns.slice(1)
// List of groups = species here = value of the first column called group
var groups = d3.map(data, function(d){return(d.group)}).keys()
//stack the data? --> stack per subgroup
var stackedData = d3.stack()
.keys(subgroups)
(data)
// Have a look to the stacked data
console.log(stackedData)
// Get the stacked data for the second group
})