This section is a work in progress. Please have a look to this ressource for an introduction to force layout to build network charts with d3.js
This is the network graph section of the gallery. If you want to know more about this kind of chart, visit data-to-viz.com. If you're looking for a simple way to implement it in d3.js, pick an example below.
A note on input data format
Building a network chart requires information on nodes and links. This information can be stored in many different format as described here.
Json format is the most convenient way to work with d3.js and looks basically like that:
{ "nodes": [
  { "id": 1, "name": "A" },
  { "id": 2, "name": "B" }
],
"links": [
  { "source": 1, "target": 2 }
]}
It is unlikely that your data are currently at this format. You probably need to reformat your data first using another tool like R. The following document gives a few example on how to reformat the most common types of input to get a json file.
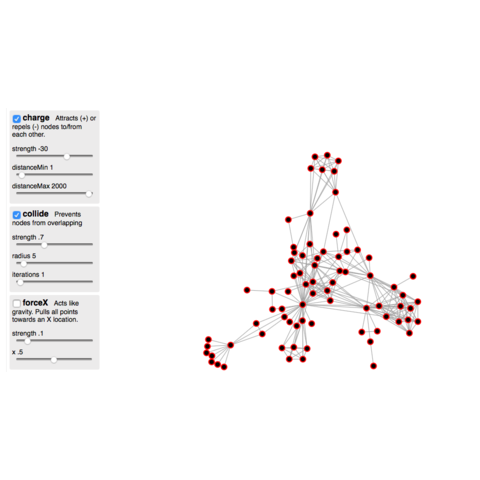
A note about force
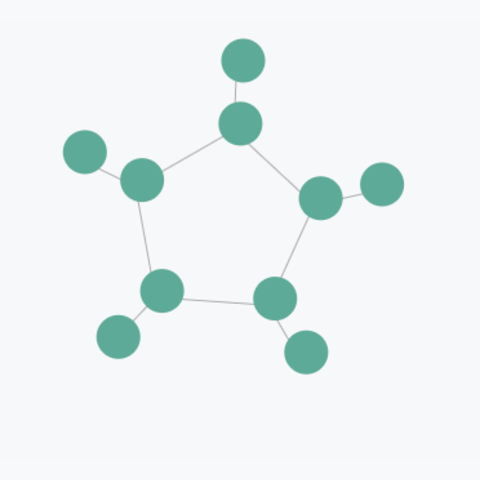
The challenge in network diagram is to find out smart X and Y coordinates for each node.
In d3, it is done using force and simulation. Different forces?
This section is a work in progress. Please have a look to this ressource for an introduction to force layout to build network charts with d3.js
Interactivity can be used for several reasons. First of all, adding a tooltip to each node is very useful when many nodes are drawn and annotation is impossible. Then dragging. Then highlighting relationships of a node.
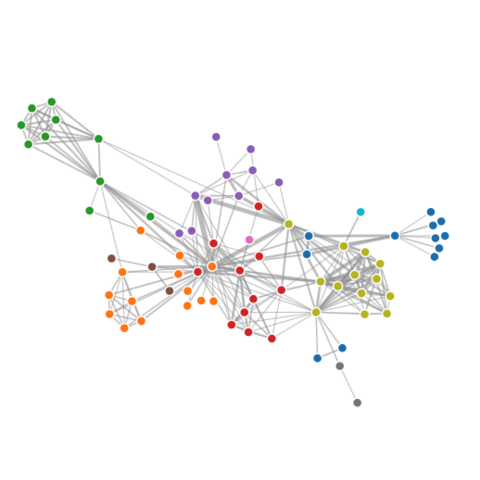
A template based on the co-authors network of a researcher.
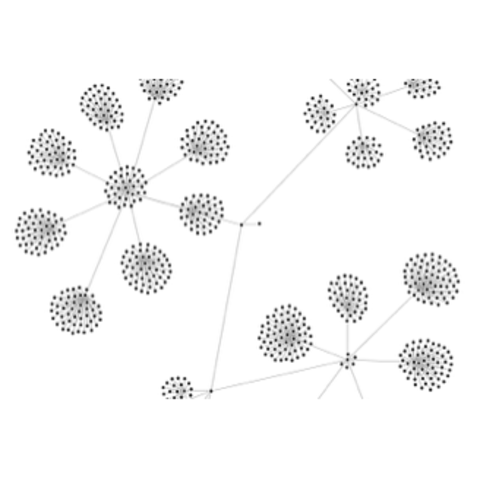
A selection of examples showing the application of the basic concept to real life dataset.
Related chart types