<!DOCTYPE html>
<html lang="en">

  <head>

  <script async src="https://pagead2.googlesyndication.com/pagead/js/adsbygoogle.js"></script>
  <script>
       (adsbygoogle = window.adsbygoogle || []).push({
            google_ad_client: "ca-pub-3523953066677938",
            enable_page_level_ads: true
       });
  </script>

    <!-- Global site tag (gtag.js) - Google Analytics -->
    <script async src="https://www.googletagmanager.com/gtag/js?id=UA-79254642-6"></script>
    <script>
      window.dataLayer = window.dataLayer || [];
      function gtag(){dataLayer.push(arguments);}
      gtag('js', new Date());

      gtag('config', 'UA-79254642-6');
    </script>

    <meta charset="utf-8">
    <title>Stacked area chart &#124; the D3 Graph Gallery</title>

    <meta name="viewport" content="width=device-width, initial-scale=1, shrink-to-fit=no">
    <meta name="description" content="How to build stacked area charts with Javascript and D3.js: from the most basic example to highly customized examples.">
    <meta name="keywords" content="Data,Dataviz,Datavisualization,Javascript,D3,D3.js,stacked area chart">
    <meta name="author" content="Yan Holtz">
  <link rel="icon" href="img/logo/D3_single_small.png">

    <meta property="og:title" content="Stacked area chart &#124; the D3 Graph Gallery">
    <meta property="og:image" content="img/overview_RGG.png">
    <meta property="og:description" content="How to build stacked area charts with Javascript and D3.js: from the most basic example to highly customized examples.">

    <!-- Bootstrap core CSS -->
    <link href="vendor/bootstrap/css/bootstrap.min.css" rel="stylesheet">

    <!-- Custom fonts for this template -->
    <link href="vendor/font-awesome/css/font-awesome.min.css" rel="stylesheet" type="text/css">
    <link href="https://fonts.googleapis.com/css?family=Montserrat:400,700" rel="stylesheet" type="text/css">
    <link href='https://fonts.googleapis.com/css?family=Kaushan+Script' rel='stylesheet' type='text/css'>
    <link href='https://fonts.googleapis.com/css?family=Droid+Serif:400,700,400italic,700italic' rel='stylesheet' type='text/css'>
    <link href='https://fonts.googleapis.com/css?family=Roboto+Slab:400,100,300,700' rel='stylesheet' type='text/css'>

    <!-- Custom styles for this template -->
    <link href="css/agency.css" rel="stylesheet">

    <!-- JQUERY -->
    <script src="vendor/jquery/jquery.min.js"></script>

    <!-- D3-->
    <script src="https://d3js.org/d3.v4.js"></script>
    <script src="https://d3js.org/d3-scale-chromatic.v1.min.js"></script>

</head>


<body id="page-top">


<!-- THIS ALLOWS TO INSERT THE MENU THAT IS STORED IN A MENU.HTML FILE-->
<nav class="navbar navbar-expand-lg fixed-top" id="mainNav"></nav>
<script>
$(function(){
  $("#mainNav").load("html_chunk/menu.html");
});
</script>

<!-- THIS ALLOWS TO INSERT THE MODAL OF THE MENU THAT IS STORED IN A MENU_MODAL.HTML FILE-->
<div id="modal_menu_insertion"> </div>
<script>
$(function(){
  $("#modal_menu_insertion").load("html_chunk/menu_modal.html");
});
</script>

  <!-- Header -->
  <header class="masthead" style="padding-top: 150px; padding-bottom: 80px">
    <div class="textlanding">
      <h1>Stacked area chart</h1>
      <hr class="short_hr">
      <br>
      <ul class="list-inline social-buttons">
        <li class="list-inline-item">
          <a href="https://twitter.com/R_Graph_Gallery">
            <i class="fa fa-twitter"></i>
          </a>
        </li>
        <li class="list-inline-item social-buttons">
          <a href="https://github.com/holtzy">
            <i class="fa fa-github" style="color: white"></i>
          </a>
        </li>
        <li class="list-inline-item social-buttons">
          <a href="https://www.linkedin.com/in/yan-holtz-2477534a/">
            <i class="fa fa-linkedin"></i>
          </a>
        </li>
        <li class="list-inline-item social-buttons">
          <a href="https://www.yan-holtz.com">
            <i class="fa fa-home"></i>
          </a>
        </li>
      </ul>
      <br><br>
      <p style="max-width: 700px; margin: auto">A <a href="https://www.data-to-viz.com/graph/stackedarea.html">Stacked area chart</a> is the extension of a basic <a href="area.html">area chart</a>. It displays the evolution of a numerical value for several groups on the same chart, stacked on top of each other. <a href="https://www.data-to-viz.com/graph/stackedarea.html">Stacked area chart</a> has pros and cons, read more about it <a href="https://www.data-to-viz.com/graph/stackedarea.html">here</a>.</p>
  </div>
</header>


<!-- THIS ALLOWS TO INSERT THE ADVERTISEMENT BANNER THAT IS STORED IN A BANNER.HTML FILE-->
<div id="position_for_images"> </div>
<script>
$(function(){
  $("#position_for_images").load("html_chunk/images.html");
});
</script>


<!-- ======================== PORTFOLIO SECTION ============================ -->
<!-- Images must be 480 x 480, resize them with ./script_reformat_img.sh output_name.png -->
<section class="bg" id="portfolio" style="padding-top: 10px">
  <div class="container">


    <div class="mySeryTitle">Step by step</div>
    <hr>
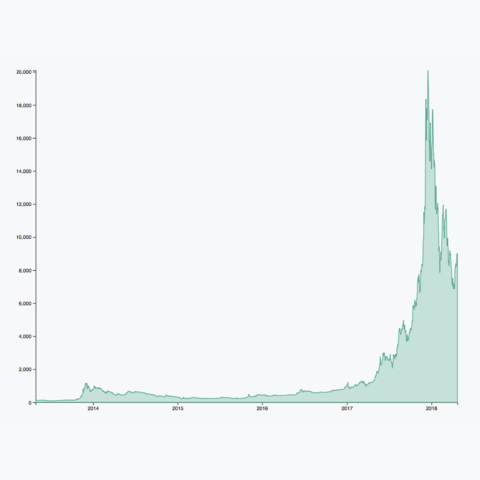
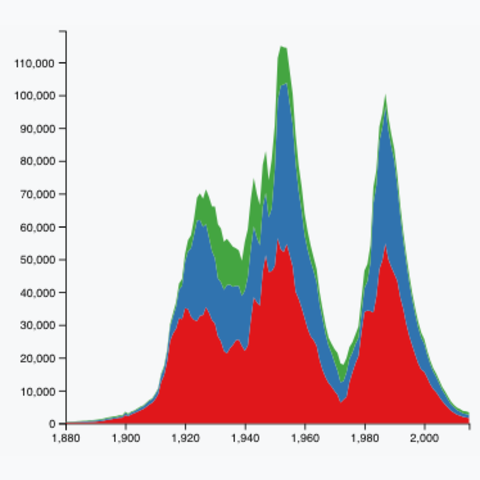
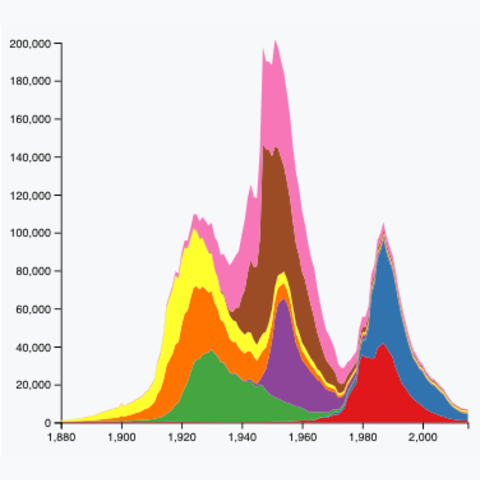
    <p>The hardest part in stacked area chart creation is the use of the <code>d3.stack()</code> function to stack the data. Once this step is done, each group can be added thanks to the <code>d3.area()</code> function. I strongly advise to understand how to do a <a href="graph/area_basic.html">basic area chart</a> before trying the examples below.</p>
    <div id="portfolio-items" class="row">
      <div class="col-md-4 col-sm-6 portfolio-item">
        <a class="portfolio-link" href="graph/area_basic.html">
          <div class="portfolio-hover">
            <div class="portfolio-hover-content">
              <p>Area chart</p>
              <hr>
              <p class="explanation_portfolio">You probably want to understand how to build a basic area chart before trying the stacked version.</p>
            </div>
          </div>
          <img class="img-fluid" src="img/graph/area_basic.png" alt="">
        </a>
      </div>
      <div class="col-md-4 col-sm-6 portfolio-item">
        <a class="portfolio-link" href="graph/stackedarea_basic.html">
          <div class="portfolio-hover">
            <div class="portfolio-hover-content">
              <p>Stacked area from long input</p>
              <hr>
              <p class="explanation_portfolio">The most basic stacked area chart you can do in d3.js. Keeping only the core code.<br><br>Input format:long (tidy)</p>
            </div>
          </div>
          <img class="img-fluid" src="img/graph/stackedarea_basic.png" alt="">
        </a>
      </div>
      <div class="col-md-4 col-sm-6 portfolio-item">
        <a class="portfolio-link" href="graph/stackedarea_wideinput.html">
          <div class="portfolio-hover">
            <div class="portfolio-hover-content">
              <p>Stacked area from wide input</p>
              <hr>
              <p class="explanation_portfolio">Another basic stacked area chart made in d3.js.<br><br>Note that here the input format is wide (untidy): each group is provided in a specific column.</p>
            </div>
          </div>
          <img class="img-fluid" src="img/graph/stackedarea_wideinput.png" alt="">
        </a>
      </div>
    </div>


    <br><br><br><br>
    <div class="mySeryTitle">Template</div>
    <hr>
    <p>A stacked area chart showing the evolution of a few baby names in the US. <u>Zoom</u> on a specific time frame through <u>brushing</u>. Highlight a specific group by <u>hovering the legend</u>. Double click to unzoom.</p>
    <a class="btn btn-secondary btn-md text-uppercase" href="graph/stackedarea_template.html">Code here</a>
    <center><div id="my_dataviz"></div></center>


    <br><br><br><br>
    <div class="mySeryTitle">Alternative</div>
    <hr>
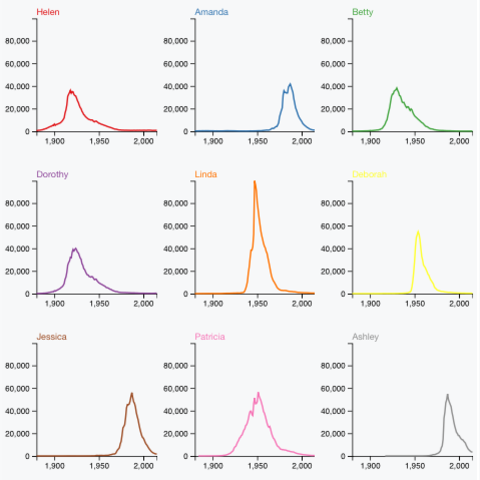
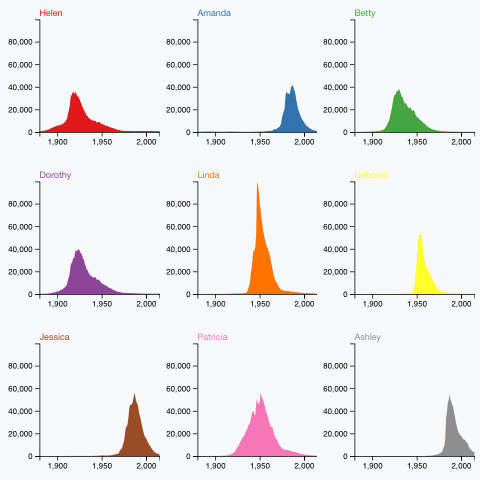
    <p>The efficiency of stacked area graph is <a href="https://www.data-to-viz.com/caveat/stacking.html">discussed</a> and it must be used with care. They are great to study the evolution of the whole and the relative proportion of each group. However, they are not appropriate to study the evolution of each individual group. (<a href="https://www.data-to-viz.com/caveat/stacking.html">Read more</a>). Using <u>small multiple</u> is often a good alternative to highlight the evolution of each group.</p>
    <div id="portfolio-items" class="row">
      <div class="col-md-4 col-sm-6 portfolio-item">
        <a class="portfolio-link" href="graph/line_smallmultiple.html">
          <div class="portfolio-hover">
            <div class="portfolio-hover-content">
              <p>Small multiple</p>
              <hr>
              <p class="explanation_portfolio">Learn how to apply the small multiple technique on line plot. It allows to avoid the spaghetti plot where lines become unreadable.</p>
            </div>
          </div>
          <img class="img-fluid" src="img/graph/line_smallmultiple.png" alt="">
        </a>
      </div>
      <div class="col-md-4 col-sm-6 portfolio-item">
        <a class="portfolio-link" href="graph/area_smallmultiple.html">
          <div class="portfolio-hover">
            <div class="portfolio-hover-content">
              <p>Small multiple</p>
              <hr>
              <p class="explanation_portfolio">Applying the small multiple technique to area chart. A good workaround to stacked area chart when you have several group to display.</p>
            </div>
          </div>
          <img class="img-fluid" src="img/graph/area_smallmultiple.png" alt="">
        </a>
      </div>
    </div>

 </div>
</section>


<!-- ======================================================================= -->


<!-- ============================ Script template ============================ -->

<script>

// set the dimensions and margins of the graph
var margin = {top: 60, right: 230, bottom: 50, left: 50},
    width = 900 - margin.left - margin.right,
    height = 400 - margin.top - margin.bottom;

// append the svg object to the body of the page
var svg = d3.select("#my_dataviz")
  .append("svg")
    .attr("width", width + margin.left + margin.right)
    .attr("height", height + margin.top + margin.bottom)
  .append("g")
    .attr("transform",
          "translate(" + margin.left + "," + margin.top + ")");

// Parse the Data
d3.csv("https://raw.githubusercontent.com/holtzy/data_to_viz/master/Example_dataset/5_OneCatSevNumOrdered_wide.csv", function(data) {


  //////////
  // GENERAL //
  //////////

  // List of groups = header of the csv files
  var keys = data.columns.slice(1)

  // color palette
  var color = d3.scaleOrdinal()
    .domain(keys)
    .range(d3.schemeSet2);

  //stack the data?
  var stackedData = d3.stack()
    .keys(keys)
    (data)


  //////////
  // AXIS //
  //////////

  // Add X axis
  var x = d3.scaleLinear()
    .domain(d3.extent(data, function(d) { return d.year; }))
    .range([ 0, width ]);
  var xAxis = svg.append("g")
    .attr("transform", "translate(0," + height + ")")
    .call(d3.axisBottom(x).ticks(5))

  // Add X axis label:
  svg.append("text")
      .attr("text-anchor", "end")
      .attr("x", width)
      .attr("y", height+40 )
      .text("Time (year)");

  // Add Y axis label:
  svg.append("text")
      .attr("text-anchor", "end")
      .attr("x", 0)
      .attr("y", -20 )
      .text("# of baby born")
      .attr("text-anchor", "start")

  // Add Y axis
  var y = d3.scaleLinear()
    .domain([0, 200000])
    .range([ height, 0 ]);
  svg.append("g")
    .call(d3.axisLeft(y).ticks(5))


  //////////
  // BRUSHING AND CHART //
  //////////

  // Add a clipPath: everything out of this area won't be drawn.
  var clip = svg.append("defs").append("svg:clipPath")
      .attr("id", "clip")
      .append("svg:rect")
      .attr("width", width )
      .attr("height", height )
      .attr("x", 0)
      .attr("y", 0);

  // Add brushing
  var brush = d3.brushX()                 // Add the brush feature using the d3.brush function
      .extent( [ [0,0], [width,height] ] ) // initialise the brush area: start at 0,0 and finishes at width,height: it means I select the whole graph area
      .on("end", updateChart) // Each time the brush selection changes, trigger the 'updateChart' function

  // Create the scatter variable: where both the circles and the brush take place
  var areaChart = svg.append('g')
    .attr("clip-path", "url(#clip)")

  // Area generator
  var area = d3.area()
    .x(function(d) { return x(d.data.year); })
    .y0(function(d) { return y(d[0]); })
    .y1(function(d) { return y(d[1]); })

  // Show the areas
  areaChart
    .selectAll("mylayers")
    .data(stackedData)
    .enter()
    .append("path")
      .attr("class", function(d) { return "myArea " + d.key })
      .style("fill", function(d) { return color(d.key); })
      .attr("d", area)

  // Add the brushing
  areaChart
    .append("g")
      .attr("class", "brush")
      .call(brush);

  var idleTimeout
  function idled() { idleTimeout = null; }

  // A function that update the chart for given boundaries
  function updateChart() {

    extent = d3.event.selection

    // If no selection, back to initial coordinate. Otherwise, update X axis domain
    if(!extent){
      if (!idleTimeout) return idleTimeout = setTimeout(idled, 350); // This allows to wait a little bit
      x.domain(d3.extent(data, function(d) { return d.year; }))
    }else{
      x.domain([ x.invert(extent[0]), x.invert(extent[1]) ])
      areaChart.select(".brush").call(brush.move, null) // This remove the grey brush area as soon as the selection has been done
    }

    // Update axis and area position
    xAxis.transition().duration(1000).call(d3.axisBottom(x).ticks(5))
    areaChart
      .selectAll("path")
      .transition().duration(1000)
      .attr("d", area)
    }


    //////////
    // HIGHLIGHT GROUP //
    //////////

    // What to do when one group is hovered
    var highlight = function(d){
      console.log(d)
      // reduce opacity of all groups
      d3.selectAll(".myArea").style("opacity", .1)
      // expect the one that is hovered
      d3.select("."+d).style("opacity", 1)
    }

    // And when it is not hovered anymore
    var noHighlight = function(d){
      d3.selectAll(".myArea").style("opacity", 1)
    }


    //////////
    // LEGEND //
    //////////

    // Add one dot in the legend for each name.
    var size = 20
    svg.selectAll("mydots")
      .data(keys)
      .enter()
      .append("rect")
        .attr("x", 650)
        .attr("y", function(d,i){ return 10 + i*(size+5)}) // 100 is where the first dot appears. 25 is the distance between dots
        .attr("width", size)
        .attr("height", size)
        .style("fill", function(d){ return color(d)})
        .on("mouseover", highlight)
        .on("mouseleave", noHighlight)

    // Add one dot in the legend for each name.
    svg.selectAll("mylabels")
      .data(keys)
      .enter()
      .append("text")
        .attr("x", 650 + size*1.2)
        .attr("y", function(d,i){ return 10 + i*(size+5) + (size/2)}) // 100 is where the first dot appears. 25 is the distance between dots
        .style("fill", function(d){ return color(d)})
        .text(function(d){ return d})
        .attr("text-anchor", "left")
        .style("alignment-baseline", "middle")
        .on("mouseover", highlight)
        .on("mouseleave", noHighlight)

})
</script>


<!-- ============================ RELATED SECTION ============================ -->
<section class="bg-light" id="portfolio_landing" style="padding-top: 30px; padding-bottom: 30px">

<div class="container">

  <p class="mySeryTitle">Related chart types</p>
  <hr>
  <div class="row">
    <div class="col-md-2 col-sm-4 portfolio-item">
      <a class="portfolio-link"  href="line.html">
        <div class="portfolio-hover">
          <div class="portfolio-hover-content">
            <i class="fa fa-plus fa-3x"></i>
          </div>
        </div>
        <img class="img-fluid" src="img/section/Line150.png" alt="">
      </a>
      <div class="captionPortfolio">Line plot</div>
    </div>
    <div class="col-md-2 col-sm-4 portfolio-item">
      <a class="portfolio-link"  href="area.html">
        <div class="portfolio-hover">
          <div class="portfolio-hover-content">
            <i class="fa fa-plus fa-3x"></i>
          </div>
        </div>
        <img class="img-fluid" src="img/section/Area150.png" alt="">
      </a>
      <div class="captionPortfolio">Area</div>
    </div>
    <div class="col-md-2 col-sm-4 portfolio-item">
      <a class="portfolio-link"  href="stackedarea.html">
        <div class="portfolio-hover">
          <div class="portfolio-hover-content">
            <i class="fa fa-plus fa-3x"></i>
          </div>
        </div>
        <img class="img-fluid" src="img/section/StackedArea150.png" alt="">
      </a>
      <div class="captionPortfolio">Stacked area</div>
    </div>
    <div class="col-md-2 col-sm-4 portfolio-item">
      <a class="portfolio-link"  href="streamgraph.html">
        <div class="portfolio-hover">
          <div class="portfolio-hover-content">
            <i class="fa fa-plus fa-3x"></i>
          </div>
        </div>
        <img class="img-fluid" src="img/section/Stream150.png" alt="">
      </a>
      <div class="captionPortfolio">Streamchart</div>
    </div>
  </div>

</div>
</section>


<!-- ============================ CONTACT SECTION ============================ -->

<!-- ANCHOR -->
<a name="contactanchor"></a>

<section id="contact" class="bg" style="background-color: white"></section>

<!-- THIS ALLOWS TO INSERT THE CONTACT CHUNK THAT IS STORED IN A CONTACT.HTML FILE-->
<script>
$(function(){
  $("#contact").load("html_chunk/contact.html");
});
</script>


<!-- ============================ FOOTER SECTION ============================ -->
<footer class="bg-light" id="myFooter"></footer>

<!-- THIS ALLOWS TO INSERT THE FOOTER THAT IS STORED IN A FOOTER.HTML FILE-->
<script>
$(function(){
  $("#myFooter").load("html_chunk/footer.html");
});
</script>

<!-- ============================ -->


<!-- =============== JAVASCRIPT SECTION =============== -->

    <!-- Bootstrap core JavaScript -->
    <script src="vendor/bootstrap/js/bootstrap.bundle.min.js"></script>

    <!-- Plugin JavaScript -->
    <script src="vendor/jquery-easing/jquery.easing.min.js"></script>

    <!-- Contact form JavaScript -->
    <script src="js/jqBootstrapValidation.js"></script>
    <script src="js/contact_me.js"></script>

    <!-- Custom scripts for this template -->
    <script src="js/agency.min.js"></script>

    <!-- Activate the bootstrap tooltip, must be after jQuery load -->
    <script>
      $(function () {
          $('[data-toggle="tooltip"]').tooltip()
      })
   </script>


<!--============================== -->


  </body>

</html>