
Creating, organizing & sharing visualizations of live, rich data. Supports Python.
Jump To: Setup, Usage, API, Customizing, Contributing, License


Visdom aims to facilitate visualization of (remote) data with an emphasis on supporting scientific experimentation.
Broadcast visualizations of plots, images, and text for yourself and your collaborators.
Organize your visualization space programmatically or through the UI to create dashboards for live data, inspect results of experiments, or debug experimental code.
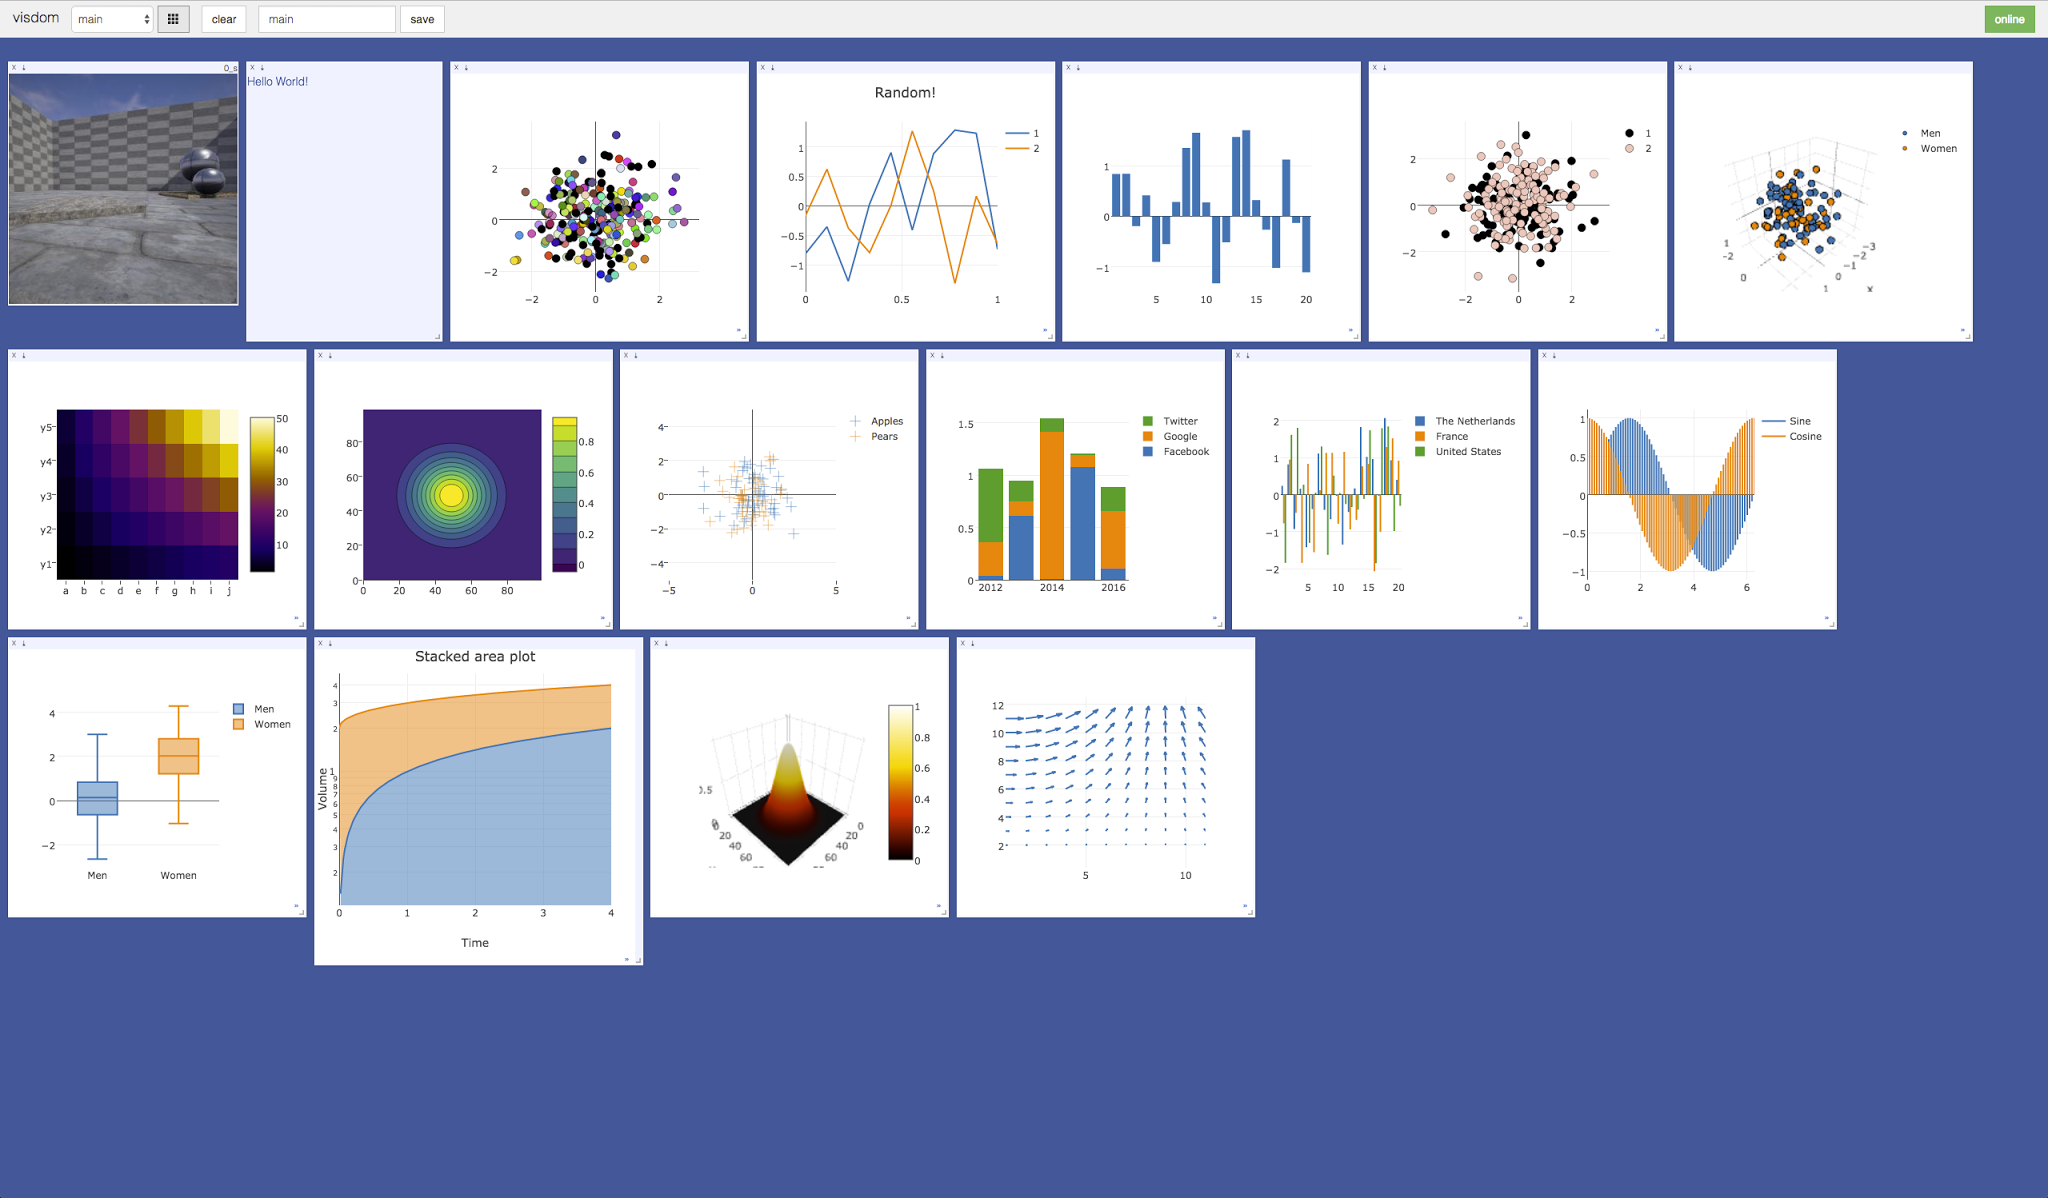


## Concepts
Visdom has a simple set of features that can be composed for various use-cases.
Windows

The UI begins as a blank slate – you can populate it with plots, images, and text. These appear in windows that you can drag, drop, resize, and destroy. The windows live in `envs` and the state of `envs` is stored across sessions. You can download the content of windows – including your plots in `svg`.
> **Tip**: You can use the zoom of your browser to adjust the scale of the UI.
Callbacks
The python Visdom implementation supports callbacks on a window. The demo shows an example of this in the form of an editable text pad. The functionality of these callbacks allows the Visdom object to receive and react to events that happen in the frontend.
You can subscribe a window to events by adding a function to the event handlers dict for the window id you want to subscribe by calling `viz.register_event_handler(handler, win_id, env=None)` with your handler, the window id, and an optional environment name. Specifying the environment name prevents event handlers from firing across different environments with the same window id. Multiple handlers can be registered to the same window. You can remove event handlers from a window using `viz.clear_event_handlers(win_id, env=None)`. When an event occurs to that window, your callbacks will be called on a dict containing:
- `event_type`: one of the below event types
- `pane_data`: all of the stored contents for that window including layout and content.
- `eid`: the current environment id
- `target`: the window id the event is called on
Additional parameters are defined below.
Right now the following callback events are supported:
1. `Close` - Triggers when a window is closed. Returns a dict with only the aforementioned fields.
2. `KeyPress` - Triggers when a key is pressed. Contains additional parameters:
- `key` - A string representation of the key pressed (applying state modifiers such as SHIFT)
- `key_code` - The javascript event keycode for the pressed key (no modifiers)
3. `PropertyUpdate` - Triggers when a property is updated in Property pane
- `propertyId` - Position in properties list
- `value` - New property value
4. `Click` - Triggers when Image pane is clicked on, has a parameter:
- `image_coord` - dictionary with the fields `x` and `y` for the click coordinates in the coordinate frame of the possibly zoomed/panned image (*not* the enclosing pane).
Editable Plot Parameters
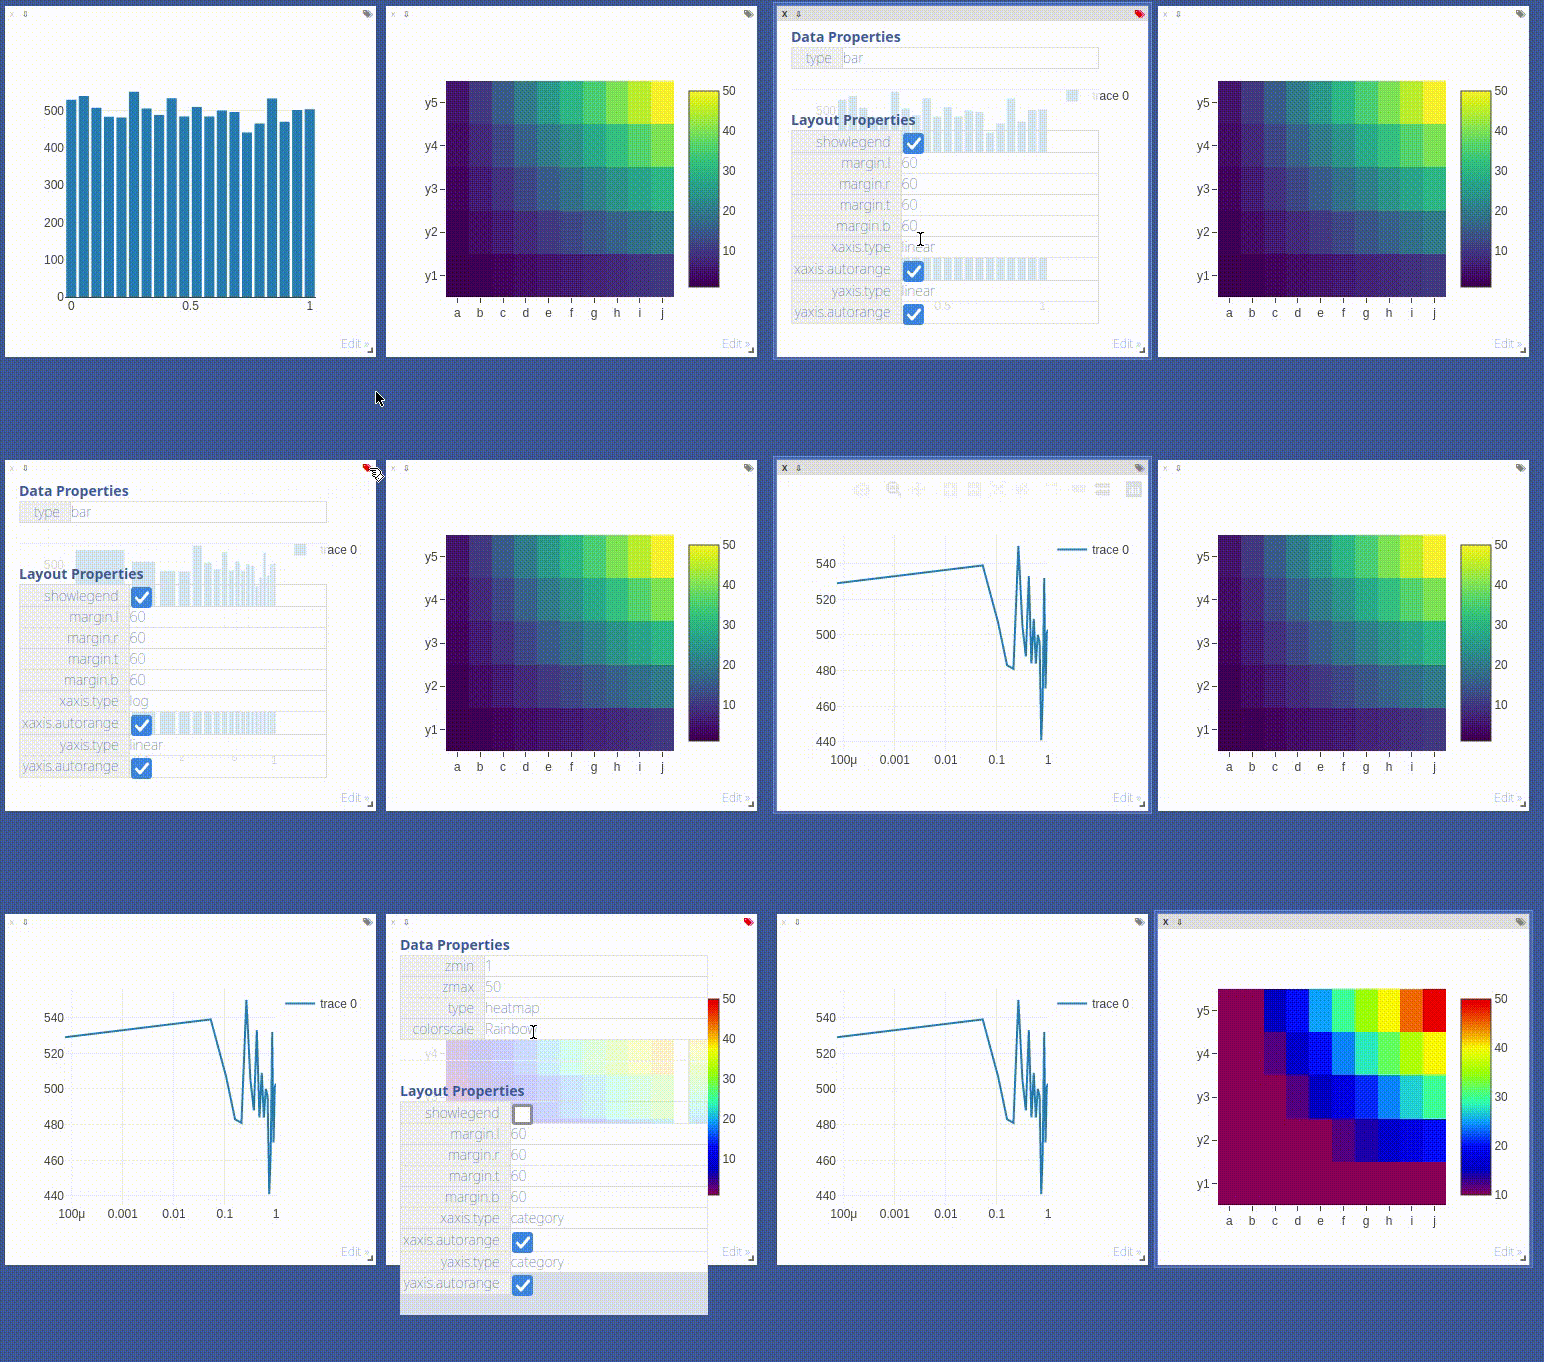
Use the top-right *edit*-Button to inspect all parameters used for plot in the respective window.
The visdom client supports dynamic change of plot parameters as well. Just change one of the listed parameters, the plot will be altered on-the-fly.
Click the button again to close the property list.
Environments

You can partition your visualization space with `envs`. By default, every user will have an env called `main`. New envs can be created in the UI or programmatically. The state of envs is persistently saved. Environments are able to keep entirely different pools of plots.
You can access a specific env via url: `http://localhost:8097/env/main`. If your server is hosted, you can share this url so others can see your visualizations too.
Environments are automatically hierarchically organized by the first `_`.
Note that `/` characters in environment names are escaped to `_`, so both `_` and `/`
can affect how environments appear hierarchically in the UI.
#### Selecting Environments
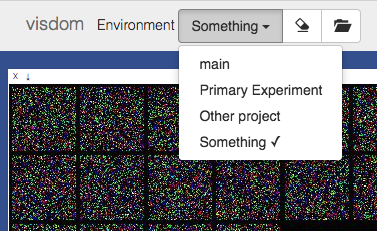
From the main page it is possible to toggle between different environments using the environment selector. Selecting a new environment will query the server for the plots that exist in that environment. The environment selector allows for searching and filtering for the new environment.
#### Comparing Environments
From the main page it is possible to compare different environments using the environment selector. Selecting multiple environments in the check box will query the server for the plots with the same titles in all environments and plot them in a single plot. An additional compare legend pane is created with a number corresponding to each selected environment. Individual plots are updated with legends corresponding to "x_name" where `x` is a number corresponding with the compare legend pane and `name` is the original name in the legend.
> **Note**: The compare envs view is not robust to high throughput data, as the server is responsible for generating the compared content. Do not compare an environment that is receiving a high quantity of updates on any plot, as every update will request regenerating the comparison. If you need to compare two plots that are receiving high quantities of data, have them share the same window on a singular env.
#### Clearing Environments
You can use the eraser button to remove all of the current contents of an environment. This closes the plot windows for that environment but keeps the empty environment for new plots.
#### Managing Environments
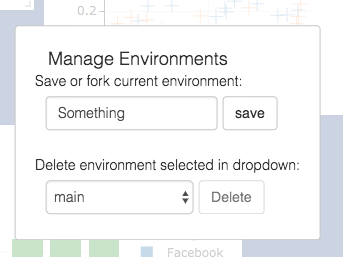
Pressing the folder icon opens a dialog that allows you to fork or force save the current environment, or delete any of your existing environments. Use of this feature is fully described in the **State** section.
>**Env Files:**
>Your envs are loaded upon request by the user, by default from `$HOME/.visdom/`. Custom paths can be passed as a cmd-line argument. Envs are removed by using the delete button or by deleting the corresponding `.json` file from the env dir. In case you want the server to pre-load all files into cache, use the flag `-eager_data_loading`.
State
Once you've created a few visualizations, state is maintained. The server automatically caches your visualizations -- if you reload the page, your visualizations reappear.
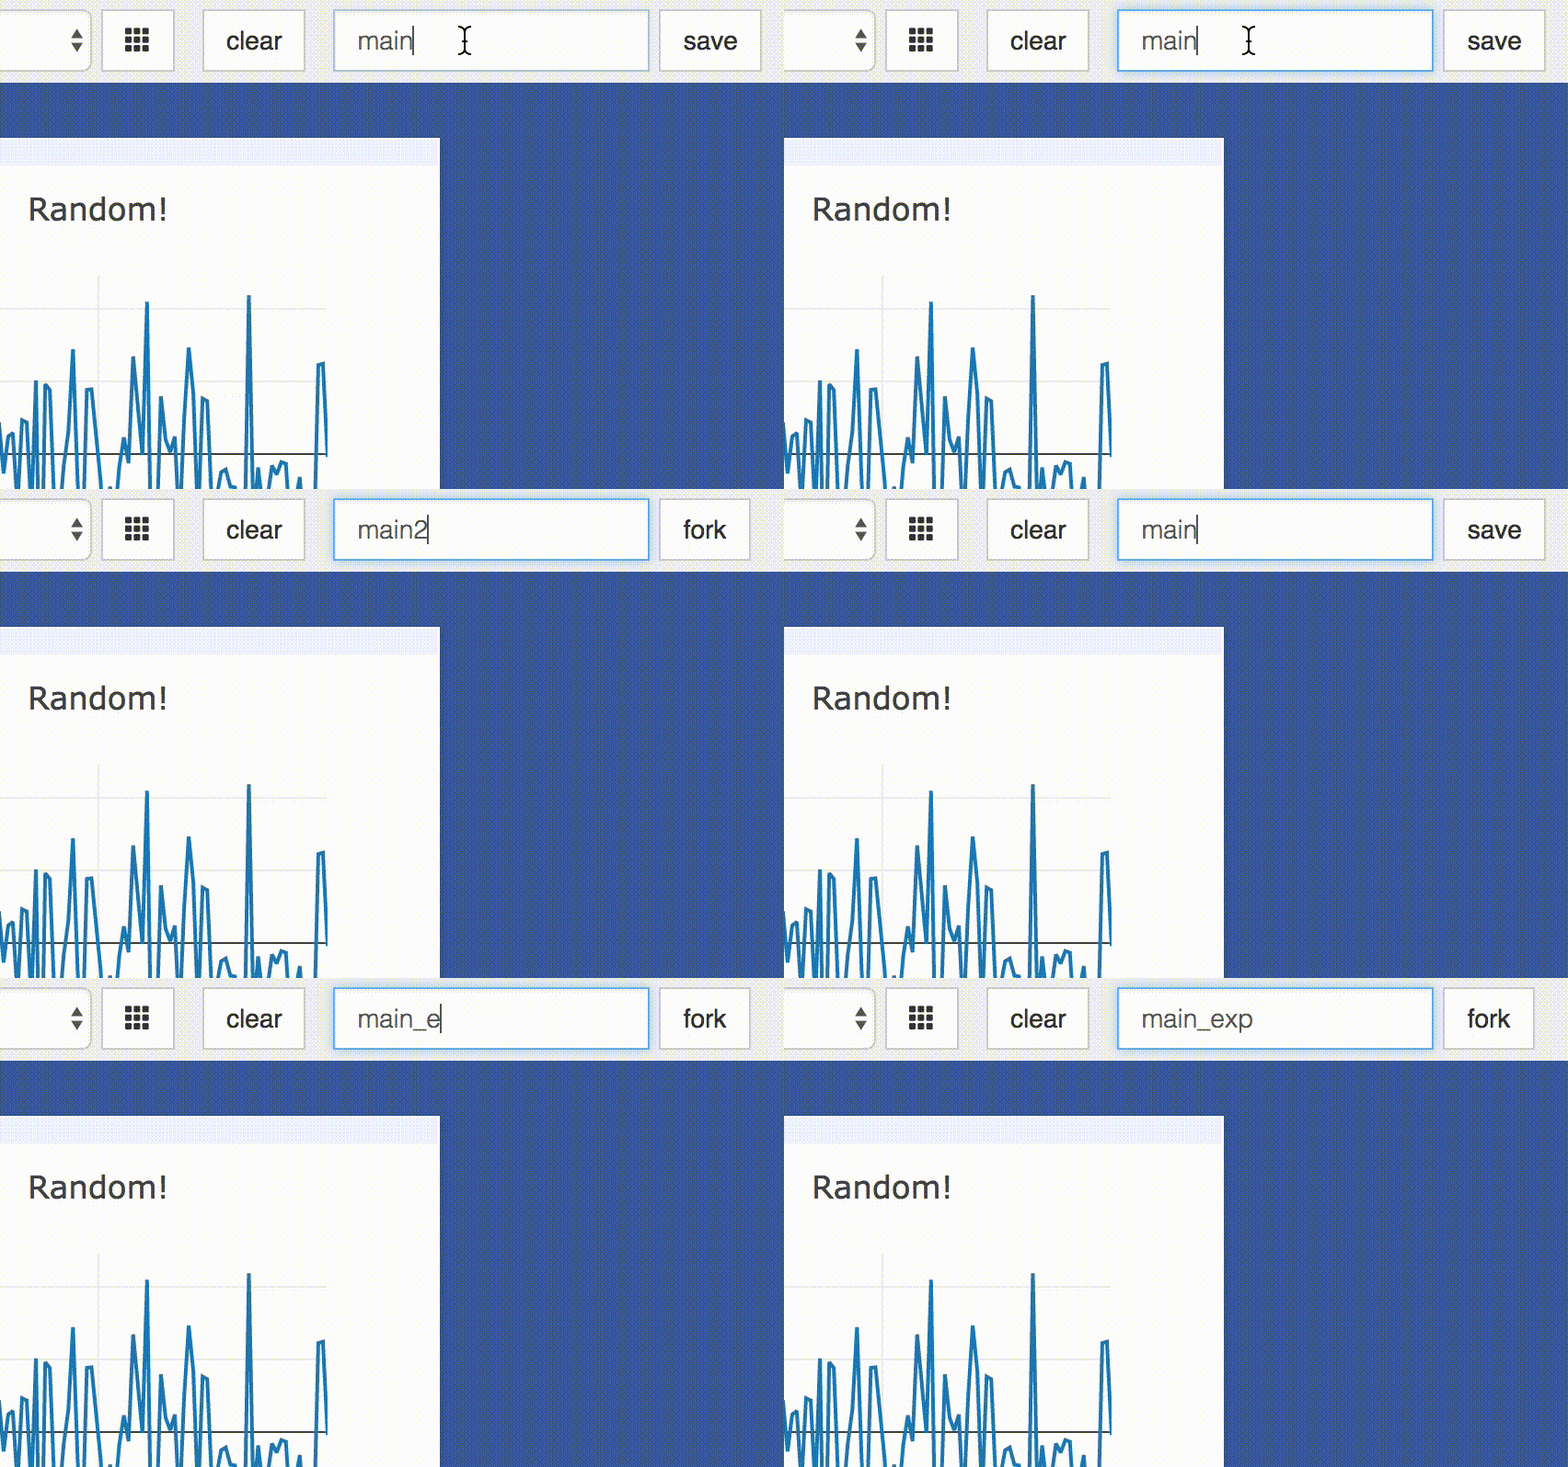
* **Save:** You can manually do so with the `save` button. This will serialize the env's state (to disk, in JSON), including window positions. You can save an `env` programmatically.
This is helpful for more sophisticated visualizations in which configuration is meaningful, e.g. a data-rich demo, a model training dashboard, or systematic experimentation. This also makes them easy to share and reuse.
* **Fork:** If you enter a new env name, saving will create a new env -- effectively **forking** the previous env.
> **Tip**: Fork an environment before you begin to make edits to ensure that your changes are saved separately.
### Filter
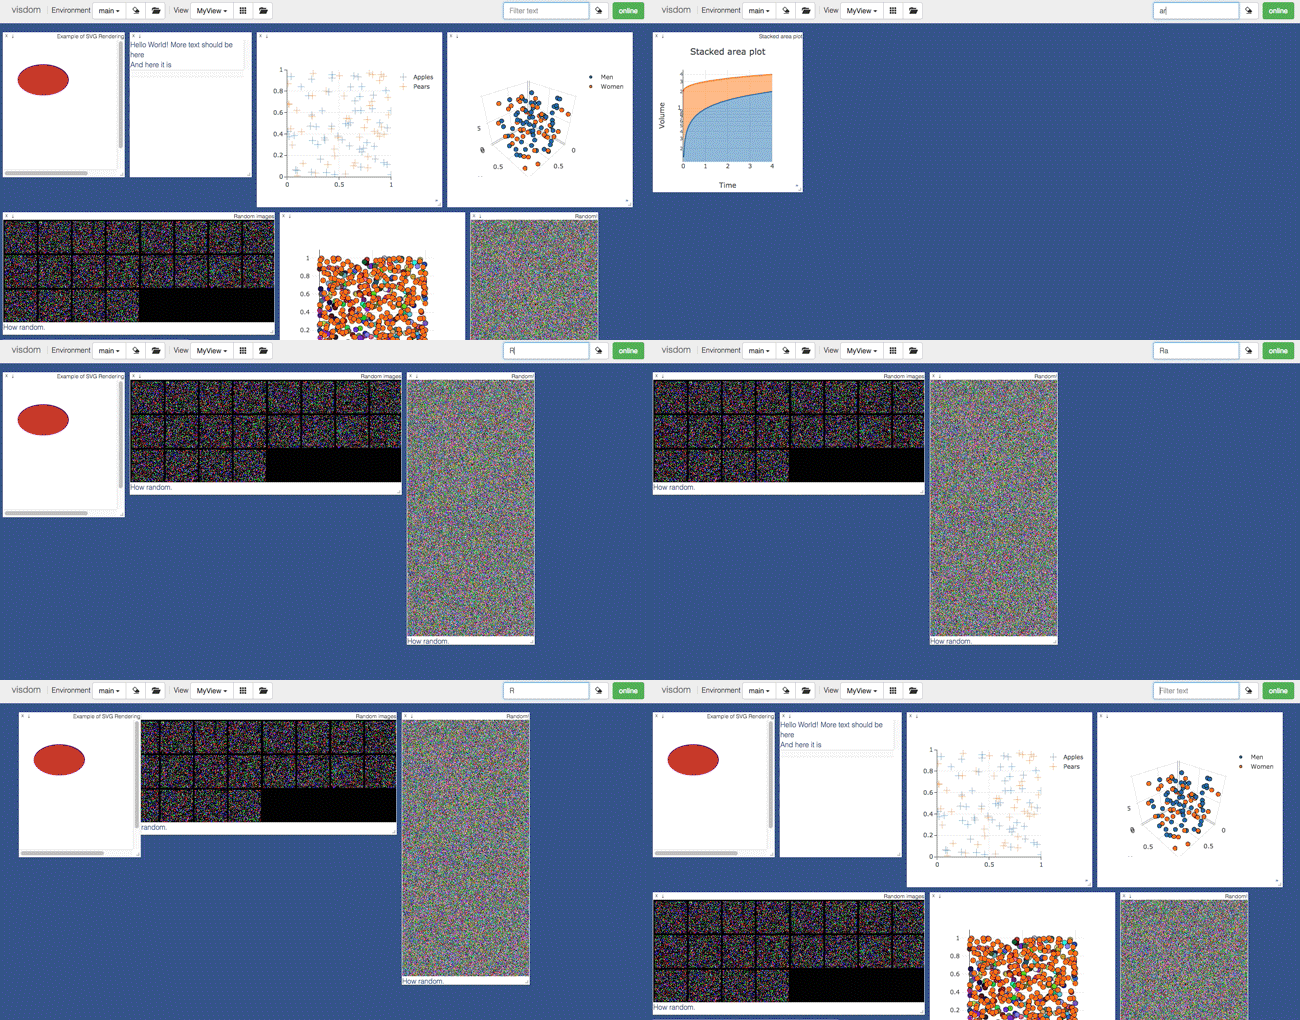
You can use the `filter` to dynamically sift through windows present in an env -- just provide a regular expression with which to match titles of window you want to show. This can be helpful in use cases involving an env with many windows e.g. when systematically checking experimental results.
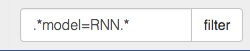
> **Note**: If you have saved your current view, the view will be restored after clearing the filter.
> 
### Views

It is possible to manage the views simply by dragging the tops of windows around, however additional features exist to keep views organized and save common views. View management can be useful for saving and switching between multiple common organizations of your windows.
#### Saving/Deleting Views
Using the folder icon, a dialog window opens where views can be forked in the same way that envs can be. Saving a view will retain the position and sizes of all of the windows in a given environment. Views are saved in `$HOME/.visdom/view/layouts.json` in the visdom filepath.
> **Note**: Saved views are static, and editing a saved view copies that view over to the `current` view where editing can occur.
#### Re-Packing
Using the repack icon (9 boxes), visdom will attempt to pack your windows in a way that they best fit while retaining row/column ordering.
> **Note**: Due to the reliance on row/column ordering and `ReactGridLayout` the final layout might be slightly different than what might be expected. We're working on improving that experience or providing alternatives that give more fine-tuned control.
#### Reloading Views
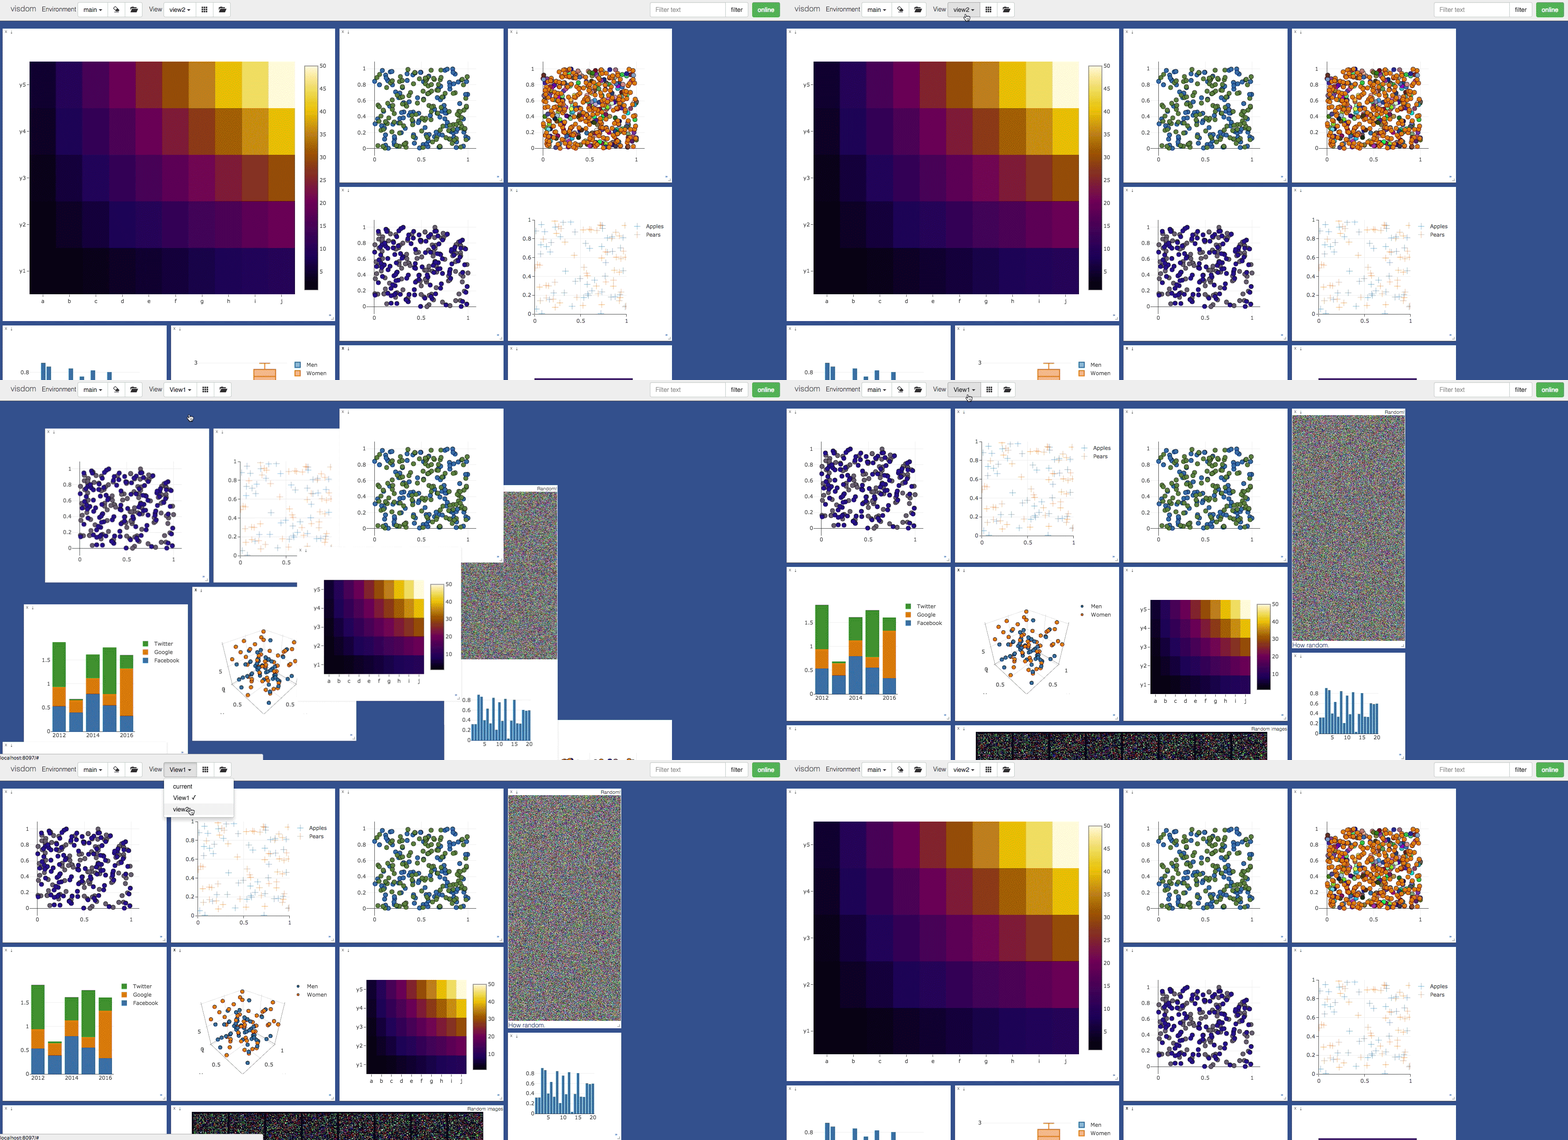
Using the view dropdown it is possible to select previously saved views, restoring the locations and sizes of all of the windows within the current environment to the places they were when that view was saved last.
## Setup
Python and web clients come bundled with the python server.
Install from pip
```bash
> pip install visdom
```
Install from source
```bash
> pip install git+https://github.com/fossasia/visdom
```
**Optional:** To save Plotly figures to image files from code (e.g. PNG/SVG) without using the browser download button, install `plotly` and `kaleido`: `pip install plotly kaleido`. See [vis.plotlyplot](#visplotlyplot) and [vis.save_plotly_figure](#visplotlyplot).
## Usage
Start the server (probably in a `screen` or `tmux`) from the command line:
```bash
> visdom
```
Visdom now can be accessed by going to `http://localhost:8097` in your browser, or your own host address if specified.
> The `visdom` command is equivalent to running `python -m visdom.server`.
>If the above does not work, try using an SSH tunnel to your server by adding the following line to your local `~/.ssh/config`:
```LocalForward 127.0.0.1:8097 127.0.0.1:8097```.
#### Command Line Options
The following options can be provided to the server:
1. `-port` : The port to run the server on.
2. `-hostname` : The hostname to run the server on.
3. `-base_url` : The base server url (default = /).
4. `-env_path` : The path to the serialized session to reload.
5. `-logging_level` : Logging level (default = INFO). Accepts both standard text and numeric logging values.
6. `-readonly` : Flag to start server in readonly mode.
7. `-enable_login` : Flag to setup authentication for the server, requiring a username and password to login.
8. `-force_new_cookie` : Flag to reset the secure cookie used by the server, invalidating current login cookies.
Requires `-enable_login`.
9. `-bind_local` : Flag to make the server accessible only from localhost.
10. `-eager_data_loading` : By default visdom loads environments lazily upon user request. Setting this flag lets visdom pre-fetch all environments upon startup.
11. `-internal_port` : A second port for the endpoints a gateway calls: `/_activity` and `/_metrics` to read, `/_evict` to close a workspace's sockets, `/_retire` to remove a workspace's environments older than a given number of days (a dry run unless asked otherwise), and `/_drop` to remove a whole workspace. They are not served at all without it, and never on the main port.
12. `-internal_ssl_certfile` and `-internal_ssl_keyfile` : The certificate and key the internal port is served with. Both are required with `-internal_port`, which never answers plain HTTP. A self-signed certificate is enough when the caller pins it, for example with `openssl req -x509 -newkey rsa:3072 -nodes -days 730 -subj "/CN=visdom-internal" -keyout internal.key -out internal.crt`.
The internal port only answers signed requests, except that `/_metrics` also answers a metrics token. Set the keys in the environment, comma separated so one can be replaced while the old one still works:
- `VISDOM_INTERNAL_READ_KEYS`: keys that may read `/_activity` and `/_metrics`.
- `VISDOM_INTERNAL_ADMIN_KEYS`: keys for endpoints that change or remove data.
- `VISDOM_METRICS_TOKENS`: bearer tokens for `/_metrics`, for scrapers that cannot sign.
Behind a proxy that spreads workspaces over several servers, set `VISDOM_PROXY_URL` and each server asks the proxy every `VISDOM_OWNERSHIP_INTERVAL` seconds (30) which server owns the workspaces it has viewers for, and closes the viewers of any that moved, so they reconnect to the new one.
A signed request sends `X-Visdom-Timestamp` (Unix seconds) and `X-Visdom-Signature`, the hex HMAC-SHA256 of the method, the path with its query, the timestamp and the hex SHA-256 of the body, joined by newlines. A signature older or newer than 60 seconds is refused. With no key set, every signed request is refused, and `/_metrics` answers only a metrics token. `visdom.server.internal.signed_headers` builds the headers.
When `-enable_login` flag is provided, the server asks user to input credentials using terminal prompt. Alternatively,
you can setup `VISDOM_USE_ENV_CREDENTIALS` env variable, and then provide your username and password via
`VISDOM_USERNAME` and `VISDOM_PASSWORD` env variables without manually interacting with the terminal. This setup
is useful in case if you would like to launch `visdom` server from bash script, or from Jupyter notebook.
```bash
VISDOM_USERNAME=username
VISDOM_PASSWORD=password
VISDOM_USE_ENV_CREDENTIALS=1 visdom -enable_login
```
You can also use `VISDOM_COOKIE` variable to provide cookies value if the cookie file wasn't generated, or the
flag `-force_new_cookie` was set.
#### HTTPS Support
To run the visdom server over HTTPS,user need to provide an SSL certificate and key file:
```bash
# Generate a self-signed certificate (for development only)
openssl req -x509 -newkey rsa:4096 -keyout key.pem -out cert.pem -days 365 -nodes
# Start the server with HTTPS
python -m visdom.server -ssl_certfile cert.pem -ssl_keyfile key.pem
```
Access the server at `https://localhost:8097`.
Connect via the Python client:
```python
# For Production - real CA-signed certificate (default)
vis = visdom.Visdom(server="https://myserver.com")
# For Development - self signed certificate
vis = visdom.Visdom(server="https://localhost", ssl_verify=False)
```
> **Note**: `ssl_verify=False` disables certificate verification and should only be used in development with self-signed certificates. Do not use in production.
#### Python example
```python
import visdom
import numpy as np
vis = visdom.Visdom()
vis.text('Hello, world!')
vis.image(np.ones((3, 10, 10)))
```
### Demos
If you have cloned this repository, you can run our demo showcase.
```bash
python example/demo.py
```
The same showcase for the asyncio client — concurrent plots, a single-request append loop and a coroutine event handler — is in [`example/async_demo.py`](example/async_demo.py); see [Async usage](#async-usage-python-only).
```bash
python example/async_demo.py
```
## API
For a quick introduction into the capabilities of `visdom`, have a look at the `example` directory, or read the details below.
### Visdom Arguments (Python only)
The python visdom client takes a few options:
- `server`: the hostname of your visdom server (default: `'http://localhost'`)
- `port`: the port for your visdom server (default: `8097`)
- `base_url`: the base visdom server url (default: `/`)
- `env`: Default environment to plot to when no `env` is provided (default: `main`)
- `raise_exceptions`: Raise exceptions upon failure rather than printing them (default: `True` (soon))
- `log_to_filename`: If not none, log all plotting and updating events to the given file (append mode) so that they can be replayed later using `replay_log` (default: `None`)
- `use_incoming_socket`: enable use of the socket for receiving events from the web client, allowing user to register callbacks (default: `True`)
- `http_proxy_host`: Deprecated. Use Proxies argument for complete proxy support.
- `http_proxy_port`: Deprecated. Use Proxies argument for complete proxy support.
- `username`: username to use for authentication, if server started with `-enable_login` (default: `None`)
- `password`: password to use for authentication, if server started with `-enable_login` (default: `None`)
- `api_key`: API key sent as the `X-API-KEY` header on every request and on the socket, for servers behind a gateway that checks keys (default: `None`)
- `workspace`: workspace sent as the `X-Visdom-Workspace` header alongside `api_key`, required when `api_key` is given (default: `None`)
- `proxies`: Dictionary mapping protocol to the URL of the proxy (e.g. {`http`: `foo.bar:3128`}) to be used on each Request. (default: `None`)
- `offline`: Flag to run visdom in offline mode, where all requests are logged to file rather than to the server. Requires `log_to_filename` is set. In offline mode, all visdom commands that don't create or update plots will simply return `True`. (default: `False`)
- `use_preflight_checks`: Ask the server whether a window exists before an `update='append'` or a `store_history=True` frame, which costs a second round trip per call. Set it to `False` to send one request and let the server create the window if it isn't there -- roughly halving the requests of an append loop. Requires a server new enough to lay out a window it creates from an append; against an older one such a window comes out unstyled. (default: `True`)
Other options are either currently unused (endpoint, ipv6) or used for internal functionality.
### Async usage (Python only)
`visdom.async_client.AsyncVisdom` is an awaitable front end to the same client. It exists for callers that already run an event loop, or that want several plots in flight at once; `visdom.Visdom` is unchanged and remains the way to use visdom from ordinary synchronous code.
```python
import asyncio
import numpy as np
from visdom.async_client import AsyncVisdom
async def main():
vis = await AsyncVisdom.create(server="http://localhost", port=8097)
async with vis:
await asyncio.gather(
vis.line(Y=np.random.rand(20), win="a"),
vis.line(Y=np.random.rand(20), win="b"),
)
asyncio.run(main())
```
Every plotting method of `Visdom` is available with the same name, the same arguments and the same return value — as a coroutine. Nothing is reimplemented: the method bodies run as the synchronous code they already are, on a thread pool the client owns, and only the request itself is asynchronous. That is also why the CPU-heavy encodes (`image`, `matplot`) stay off your event loop for free.
Things to know:
- **Build it with `create`, not `()`.** Connecting means a POST and `__init__` cannot await. `create` accepts every `Visdom` argument, plus `max_concurrency` (default `10`) which sizes both the client's thread pool and the number of requests tornado will start at once. `max_concurrency` only supplies the default for tornado's `max_clients`: pass `max_clients` explicitly and it wins, so the two limits then differ by as much as you asked for.
- **`shutdown` closes the client, `close` closes a window.** `close` is `Visdom.close` and keeps its usual meaning, so the method that releases the HTTP client and the worker pool is `shutdown()`. Using the client as an async context manager calls it for you.
- **Two defaults differ from `Visdom`.** `use_incoming_socket` is `False` here (most async callers never register a handler, and a backchannel costs a held-open connection plus a thread), and `use_preflight_checks` is `False` (an async client is new code talking to a server that understands `layout_create`, so an append costs one request rather than two). Pass either explicitly to get the synchronous behavior back.
- **Concurrency is yours to ask for.** `gather` runs the calls on separate worker threads against one shared inner client, and that client is no more thread-safe than the synchronous one — concurrent calls should target distinct windows.
- **Event handlers work, and may be coroutines.** Pass `use_incoming_socket=True` (or `use_polling=True` for the HTTP fallback) and register as usual with `register_event_handler`; registration is not a coroutine, since it never reaches the server. A plain handler runs on the client's own single dispatch thread; a coroutine handler has only its wrapper there, and its body runs on your loop, so it can await further calls on the same client. Either way handlers run one at a time, in arrival order.
- **No HTTP proxies.** `create` raises `NotImplementedError` for `proxies` / `http_proxy_host` / `http_proxy_port`: the transport is tornado's `AsyncHTTPClient`, which has no proxy support without `pycurl`. Use `Visdom` behind a proxy.
Measured on loopback over 300 `line(update='append')` calls — the path profiled in [#771](https://github.com/fossasia/visdom/issues/771):
| Client | plots/s | p50 | p95 |
|---|---|---|---|
| `Visdom`, preflight on (default) | 198 | 5.00 ms | 5.73 ms |
| `Visdom`, `use_preflight_checks=False` | 304 | 3.32 ms | 4.09 ms |
| `AsyncVisdom`, awaited serially | 235 | 4.24 ms | 4.87 ms |
| `AsyncVisdom`, 8 concurrent | 410 | 13.19 ms | 18.33 ms |
Requests halve exactly once the preflight is off. Throughput does not quite double because on loopback the preflight is the cheaper of the two round trips; over a real network the two cost the same.
`example/async_demo.py` runs all of the above against a live server.
### Basics
Visdom offers the following basic visualization functions:
- [`vis.image`](#visimage) : image
- [`vis.image_heatmap`](#visimageheatmap) : image with heatmap overlay
- [`vis.update_image_slider`](#visupdate_image_slider) : set visible frame of an image_history pane
- [`vis.images`](#visimages) : list of images
- [`vis.text`](#vistext) : arbitrary HTML
- [`vis.properties`](#visproperties) : properties grid
- [`vis.table`](#vistable) : editable, resizable table pane
- [`vis.html_table`](#vishtml_table) : static styled HTML table
- [`vis.audio`](#visaudio) : audio
- [`vis.video`](#visvideo) : videos
- [`vis.svg`](#vissvg) : SVG object
- [`vis.matplot`](#vismatplot) : matplotlib plot
- [`vis.plotlyplot`](#visplotlyplot) : arbitrary Plotly figure
- [`vis.embeddings`](#visembeddings) : interactive embedding projection
- [`vis.save`](#vissave) : serialize state server-side
### Plotting
We have wrapped several common plot types to make creating basic visualizations easily. These visualizations are powered by [Plotly](https://plotly.com/).
The following API is currently supported:
- [`vis.scatter`](#visscatter) : 2D or 3D scatter plots
- [`vis.sunburst`](#vissunburst) : sunburst (hierarchy) charts
- [`vis.line`](#visline) : line plots
- [`vis.learning_curve`](#vislearning_curve) : named training metric curves
- [`vis.stem`](#visstem) : stem plots
- [`vis.heatmap`](#visheatmap) : heatmap plots
- [`vis.confusion_matrix`](#visconfusion_matrix) : confusion matrix plots
- [`vis.bar`](#visbar) : bar graphs
- [`vis.histogram`](#vishistogram) : histograms
- [`vis.histogram2d`](#vishistogram2d) : 2D histograms (density maps)
- [`vis.boxplot`](#visboxplot) : boxplots
- [`vis.violin`](#visviolin) : violin plots
- [`vis.pie`](#vispie) : pie charts
- [`vis.surf`](#vissurf) : surface plots
- [`vis.contour`](#viscontour) : contour plots
- [`vis.roc_curve`](#visroc_curve) : ROC curves
- [`vis.pr_curve`](#vispr_curve) : precision-recall curves
- [`vis.quiver`](#visquiver) : quiver plots
- [`vis.mesh`](#vismesh) : mesh plots
- [`vis.sankey`](#vissankey) : sankey (flow) diagrams
- [`vis.dual_axis_lines`](#visdual_axis_lines) : double y axis line plots
- [`vis.graph`](#visgraph) : network graphs
### Generic Plots
Note that the server API adheres to the Plotly convention of `data` and `layout` objects, such that you can produce your own arbitrary `Plotly` visualizations:
```python
import visdom
vis = visdom.Visdom()
trace = dict(x=[1, 2, 3], y=[4, 5, 6], mode="markers+lines", type='custom',
marker={'color': 'red', 'symbol': 104, 'size': "10"},
text=["one", "two", "three"], name='1st Trace')
layout = dict(title="First Plot", xaxis={'title': 'x1'}, yaxis={'title': 'x2'})
vis._send({'data': [trace], 'layout': layout, 'win': 'mywin'})
```
### Others
- [`vis.close`](#visclose) : close a window by id
- [`vis.delete_env`](#visdelete_env) : delete an environment by env_id
- [`vis.win_exists`](#viswin_exists) : check if a window already exists by id
- [`vis.get_env_list`](#visget_env_list) : get a list of all of the environments on your server
- [`vis.get_window_data`](#visget_window_data): get current data for a window
- [`vis.set_tags`](#visset_tags): replace or append environment tags
- [`vis.get_tags`](#visget_tags): read environment tags
- [`vis.save_plotly_figure`](#visplotlyplot): save a Plotly figure to an image file from code (no browser click)
- [`vis.check_connection`](#vischeck_connection): check if the server is connected
- [`vis.replay_log`](#visreplay_log): replay the actions from the provided log file
- [`vis.restore_run`](#visrestore_run): replay a tracked run's plots from its recorded `.json`/`.events.jsonl` files
### Experiments
Track experiment metadata (hyper-parameters, metrics, tags) alongside your plots, then search and compare runs across your server:
- [`vis.experiment`](#visexperiment) : create or update experiment metadata for an env
- [`vis.log_metrics`](#vislog_metrics) : append metric observations to an env's experiment
- [`vis.finish_experiment`](#visfinish_experiment) : mark an experiment terminal (finished/failed)
- [`vis.search_experiments`](#vissearch_experiments) : search experiments across envs with a query
- [`vis.compare_experiments`](#viscompare_experiments) : diff experiments field by field
- [`vis.suggest_experiment`](#vissuggest_experiment) : suggest parameters for the next run (reserved)
- [`vis.hparams`](#vishparams) : open a hyper-parameter pane over the selected runs
- [`vis.update_hparams`](#visupdate_hparams) : change or refresh an existing hyper-parameter pane
## Loggers
Framework-specific logging bridges that wrap the Visdom API so training loops stay focused on training. Each logger lives in its own submodule and handles window creation, step tracking, and throttling internally. None of the framework packages below are part of Visdom's own install — each logger imports its framework lazily and raises a clear `ImportError` with the `pip install` command if it's missing.
### PyTorch
**Requirements:** `pip install visdom torch`
`visdom.pytorch.VisdomLogger` is a context manager for raw PyTorch training loops. Call `tracker.log(name, value)` for any scalar — no `viz.line()` arguments needed.
**Epoch-level logging** (recommended default — one call per epoch):
```python
import visdom
from visdom.pytorch import VisdomLogger
viz = visdom.Visdom()
with VisdomLogger(viz, env="my_run") as tracker:
for epoch in range(num_epochs):
train_loss = run_train_epoch(model, loader)
val_loss = run_val_epoch(model, val_loader)
tracker.log("Train Loss", train_loss)
tracker.log("Val Loss", val_loss)
tracker.log("LR", optimizer.param_groups[0]["lr"])
```
**Per-batch logging with `log_every`** — use when logging inside the batch loop on large datasets:
```python
with VisdomLogger(viz, env="my_run", log_every=50) as tracker:
for epoch in range(num_epochs):
for inputs, targets in train_loader:
loss = criterion(model(inputs), targets)
optimizer.zero_grad()
loss.backward()
optimizer.step()
# sent to Visdom every 50 batches, not every batch
tracker.log("Train Loss", loss.item(), xlabel="step")
tracker.log("LR", optimizer.param_groups[0]["lr"], xlabel="step")
```
**Experiment tracking with `params`** — pass hyperparameters to also record the run as a queryable experiment, alongside the usual charts:
```python
params = {"lr": 1e-2, "batch_size": 32}
with VisdomLogger(viz, env="my_run", params=params) as tracker:
for epoch in range(num_epochs):
tracker.log("Train Loss", train_loss)
# later, from anywhere
viz.search_experiments("lr < 0.01 AND status = finished")
viz.compare_experiments(["my_run", "my_other_run"])
```
Tracking is opt-in: without `params`, `VisdomLogger` only ever calls `viz.line()`, unchanged from before this existed. With `params`, the run's status is recorded as `finished` on a normal exit or `failed` if the `with`-block raised, and every logged metric is mirrored into the experiment alongside the chart it's plotted on.
**Parameters:**
- `viz`: a connected `visdom.Visdom()` instance
- `env`: environment name (default: auto-generated from timestamp)
- `log_every`: send every N calls per metric — use with per-batch logging on large datasets (default: `1`)
- `params`: dict of hyperparameters; opts into experiment tracking (default: `None`, tracking off)
- `is_main_process`: `True` or `False` to choose whether this process plots (default: `None`, only global rank 0 plots); any other type raises `TypeError`
**Distributed training:** under `torchrun`, SLURM or `mp.spawn`, only global rank 0 plots and tracks; other ranks just validate their inputs, so one window is created per metric and nothing extra needs to be passed. The plotted value is whatever rank 0 logs, so to log a global average every rank must call `dist.all_reduce` and divide by `dist.get_world_size()` before `tracker.log()`. An `mp.spawn` worker has no rank to go by until `dist.init_process_group` has run, so create the logger after it or pass `is_main_process=(rank == 0)`. Pass `is_main_process=True` or `False` to pick the plotting process yourself, for example the last stage of a pipeline-parallel job, or when SLURM starts independent runs with `srun -n N`. Single-GPU and `nn.DataParallel` scripts run as one process and plot as before.
Each unique name passed to `tracker.log()` gets its own window. The first call creates it; subsequent calls append. See `example/train_example.py` for a full working example.
### PyTorch Lightning
**Requirements:** `pip install visdom lightning` (or `pip install visdom pytorch-lightning`)
`visdom.loggers.VisdomLightningLogger` implements Lightning's `Logger` protocol. Lightning aggregates every `self.log()` / `self.log_dict()` call in a `LightningModule` and hands the result to the logger, so nothing in the model or training loop changes — the user passes one `logger=` argument to `Trainer`.
```python
import lightning.pytorch as pl
import visdom
from visdom.loggers import VisdomLightningLogger
viz = visdom.Visdom()
logger = VisdomLightningLogger(viz, env="lightning_run")
trainer = pl.Trainer(max_epochs=20, logger=logger, log_every_n_steps=5)
trainer.fit(model, train_loader, val_loader)
```
Each metric key gets its own window — one key, one line chart, with no train/val name parsing. The `epoch` key Lightning mixes into the metrics dict is not plotted. How often the logger is called is controlled by Lightning (`Trainer(log_every_n_steps=...)` for step metrics, once per epoch for epoch metrics).
Hyperparameters passed to `self.save_hyperparameters()` are rendered once as a properties pane via `viz.properties()`.
**Gradient norms** come from Lightning, not the logger. Add to your `LightningModule` and they arrive through the logger like any other metric:
```python
from lightning.pytorch.utilities import grad_norm
def on_before_optimizer_step(self, optimizer):
self.log_dict(grad_norm(self, norm_type=2))
```
**Parameters:**
- `viz`: a connected `visdom.Visdom()` instance
- `env`: environment name (default: `viz.env` if set, otherwise auto-generated from timestamp)
**Note:** each call to `viz.line()` is a synchronous network request made on the thread Lightning calls from, so a very small `log_every_n_steps` with many metrics can stall training while it waits on the server.
**Note:** `log_metrics` and `log_hyperparams` run on rank zero only. Use one logger instance per `Trainer` run. Not thread-safe — internal state has no locking.
**Note:** when the run ends (success or failure) the logger saves the env on the server, so it can be reloaded later.
**Note:** values that don't convert to a float (non-numeric strings, multi-element tensors, `None`) are skipped with a warning rather than raising.
See `example/train_lightning_example.py` for a full working example.
### scikit-learn
**Requirements:** `pip install visdom scikit-learn`
`visdom.loggers.VisdomSklearnLogger` patches all sklearn `fit()` calls so every estimator trained after `autolog()` logs to Visdom automatically — no per-estimator code needed.
**Plain estimators** (classifiers, regressors, clusterers) produce a text pane with the estimator name, dataset shape, training score, fit time, and all hyperparameters.
**GridSearchCV / RandomizedSearchCV** produce a bar chart of `mean_test_score` per parameter combination and a text pane with `best_score_`, `best_params_`, and fit time.
**Iterative estimators** additionally get a line chart of their per-iteration training history: `MLPClassifier`/`MLPRegressor` plot `loss_curve_` (plus `validation_scores_` when fit with `early_stopping=True`), and `GradientBoostingClassifier`/`GradientBoostingRegressor` plot `train_score_`.
**Regressors** get `train_rmse` and `train_mae` rows in the text pane alongside the R2 `train_score` (R2 alone can be misleading), plus a predicted-vs-residual scatter plot.
**Note:** `train_score`, `train_rmse`, `train_mae` and the residual scatter are all measured on the data passed to `fit()`. They describe fit quality on the training set and are not held-out estimates — score your own test set for that.
**Note:** panes are keyed on the estimator instance, so refitting the same estimator updates the panes it already owns instead of opening new ones. Two different estimator objects always get their own panes, even of the same class.
**Note:** one logger is active at a time. Calling `autolog()` again switches the active env **silently** — no warning is raised, and the previous env stops receiving updates.
```python
import visdom
from visdom.loggers import VisdomSklearnLogger
from sklearn.ensemble import RandomForestClassifier
from sklearn.linear_model import Ridge
from sklearn.model_selection import GridSearchCV
viz = visdom.Visdom()
VisdomSklearnLogger.autolog()
clf = RandomForestClassifier(n_estimators=100)
clf.fit(X_train, y_train) # -> text pane
reg = Ridge(alpha=1.0)
reg.fit(X_train, y_train) # -> text pane
gs = GridSearchCV(clf, param_grid, cv=3)
gs.fit(X_train, y_train) # -> bar chart + text pane
```
If you have a custom Visdom connection (non-default port, remote server, auth), pass it explicitly:
```python
import visdom
viz = visdom.Visdom(port=8098, server="http://myserver")
VisdomSklearnLogger.autolog(viz, env="sklearn_run")
```
**Parameters:**
- `viz`: a connected `visdom.Visdom()` instance (optional — created internally if not passed)
- `env`: environment name (default: `viz.env` if set, otherwise auto-generated from timestamp)
See `example/train_sklearn_example.py` for a full working example covering plain estimators and grid search.
### XGBoost
**Requirements:** `pip install visdom xgboost`
`visdom.loggers.VisdomXGBLogger` implements XGBoost's `TrainingCallback` protocol, plotting train/eval metrics to Visdom after every boosting round.
There was no way to visualize XGBoost training runs in Visdom without manually attaching a `TrainingCallback` and wiring up `viz.line()` calls yourself. This adds opt-in auto-logging behind a single `autolog()` call, with no changes required to model, `train()`, or `fit()` code.
```python
import xgboost as xgb
import visdom
from visdom.loggers import VisdomXGBLogger
viz = visdom.Visdom()
VisdomXGBLogger.autolog(viz, env="xgb_run")
booster = xgb.train(params, dtrain, evals=[(dtrain, "train"), (dval, "eval")]) # logged automatically
clf = xgb.XGBClassifier().fit(X_train, y_train, eval_set=[(X_val, y_val)]) # logged automatically
xgb.cv(params, dtrain, nfold=3) # logged automatically
```
Or attach a logger to a single run without patching anything:
```python
callback = VisdomXGBLogger(viz, env="xgb_run")
booster = xgb.train(params, dtrain, evals=[(dtrain, "train"), (dval, "eval")], callbacks=[callback])
```
Each eval metric gets its own window with one trace per data name (`train`/`eval`), and `best_iteration`/`best_score` are logged as a text pane once training finishes. See `example/train_xgboost_example.py` for a full working example.
**Note:** one logger is active at a time. Calling `autolog()` again for a different env moves logging there and warns; the previous env keeps the windows it already has. Import `cross_validate` after `autolog()` — importing it first binds the original function, and every fold then opens its own window instead of sharing one per metric.
### TensorFlow / Keras
**Requirements:** `pip install visdom tensorflow` (or `pip install visdom keras`)
`visdom.loggers.VisdomKerasLogger` implements Keras's `Callback` protocol, plotting train/val metrics to Visdom after every epoch.
```python
from tensorflow import keras
from tensorflow.keras import layers
import visdom
from visdom.loggers import VisdomKerasLogger
viz = visdom.Visdom()
logger = VisdomKerasLogger(viz, env="keras_run")
model = keras.Sequential([
layers.Input(shape=(20,)),
layers.Dense(32, activation="relu"),
layers.Dense(1, activation="sigmoid"),
])
model.compile(optimizer="adam", loss="binary_crossentropy", metrics=["accuracy"])
model.fit(
x_train, y_train,
validation_data=(x_val, y_val),
epochs=20,
callbacks=[logger],
)
```
A metric named `val_` is plotted as a `val` trace on the same window its train counterpart `` plots as a `train` trace, matching how Keras already splits train/val by key prefix. One instance can be reused across multiple `fit()` calls — a new run's epoch 0 replaces the previous run's curve on the same windows in place, rather than opening a duplicate set of windows.
**Per-batch logging with `log_every`** — use when you also want step-level detail on large datasets. Off by default, since `on_train_batch_end` otherwise fires every batch regardless of whether step-level detail is wanted:
```python
logger = VisdomKerasLogger(viz, env="keras_run", log_every=50)
model.fit(x_train, y_train, epochs=20, callbacks=[logger])
```
Each metric gets its own window titled `" (step)"`, throttled to one send every `log_every` batches. The optimizer's current learning rate is read (not computed) and plotted alongside as `lr`.
**Experiment tracking with `params`** — records the run in the ExperimentStore alongside the charts, so it becomes queryable through [`vis.search_experiments`](#vissearch_experiments) / [`vis.compare_experiments`](#viscompare_experiments). Off by default. Without `params` the logger only ever calls `viz.line()`:
```python
logger = VisdomKerasLogger(viz, env="keras_run", params={"lr": 0.01})
model.fit(x_train, y_train, epochs=20, callbacks=[logger])
viz.search_experiments("status = finished")
```
Hyper-parameters are recorded when training begins, each epoch's metrics as they are plotted, and the run is marked `finished` when `fit()` returns. Only epoch metrics are recorded — per-batch values from `log_every` stay visualization-only so a run's metric history keeps the granularity the search and compare views read it at.
**Note:** a finished experiment rejects further writes, so an env records one tracked run. Give every run its own env, including a repeat run of the same script. Keras reports no exception to `on_train_end`, so a tracked run is always recorded as `finished`. Call `viz.finish_experiment(status="failed", env=...)` directly to record a run that did not.
**Parameters:**
- `viz`: a connected `visdom.Visdom()` instance
- `env`: environment name (default: `viz.env` if set, otherwise auto-generated from timestamp)
- `log_every`: also plot metrics at batch granularity, one send every N batches (default: `None`, disabled)
- `params`: hyper-parameters to record, opting the run into experiment tracking (default: `None`, disabled)
**Note:** each call to `viz.line()` is a synchronous network request made on the training thread. Pick a `log_every` large enough that it doesn't stall training waiting on the server — 50+ is a reasonable default on GPU.
**Note:** not thread-safe — internal state has no locking, so calling `fit()` on the same logger instance from multiple threads can race.
See `example/train_keras_example.py` for a full working example.
### Optuna
**Requirements:** `pip install visdom optuna`
**Dashboard visualizations:** `pip install plotly`
`visdom.integrations.OptunaCallback` implements Optuna's study callback
protocol. After each trial finishes it records the trial's parameters, objective
values and state as a Visdom experiment in a dedicated environment. Optuna is
not a Visdom dependency, so existing Visdom users do not install it unless they
choose this integration.
```python
import optuna
import visdom
from visdom.integrations import OptunaCallback
viz = visdom.Visdom()
callback = OptunaCallback(
viz,
dashboard_env="optuna_quadratic",
objective_names=["loss"],
create_dashboard=True,
refresh_every=10,
contour_params=["x", "y"],
)
def objective(trial):
x = trial.suggest_float("x", -10, 10)
y = trial.suggest_float("y", -10, 10)
return (x - 2) ** 2 + (y + 1) ** 2
study = optuna.create_study(study_name="quadratic", direction="minimize")
study.optimize(objective, n_trials=100, callbacks=[callback])
callback.update_dashboard(study)
```
For multi-objective studies, list the objective names in the same order as the
study directions and return values:
```python
callback = OptunaCallback(
viz,
dashboard_env="optuna_accuracy_latency",
objective_names=["accuracy", "latency_ms"],
create_dashboard=True,
)
def multi_objective(trial):
width = trial.suggest_int("width", 1, 10)
accuracy = 0.80 + 0.01 * width
latency_ms = 10.0 + 2.0 * width
return accuracy, latency_ms
study = optuna.create_study(
study_name="accuracy-latency",
directions=["maximize", "minimize"],
)
study.optimize(multi_objective, n_trials=40, callbacks=[callback])
callback.update_dashboard(study)
```
The integration records one experiment per trial, using names such as
`optuna_quadratic_trial_000017`. Intermediate values reported with
`trial.report(value, step)` are stored as the `intermediate_value` metric in
step order before the final objective value. Each experiment also carries a
stable `optuna_dashboard_env` tag. With `create_dashboard=True`, the first trial
creates summary, HParams, optimization history and timeline panes, plus
intermediate-value and parameter-importance panes when Optuna can compute them.
Supplying at least two parameter names through `contour_params` adds a contour
pane for each objective; Optuna handles numerical, categorical and log-scaled
parameters when it builds those Plotly figures.
The HParams pane selects experiments by that dashboard tag rather than by a
callback-local list, so `update_dashboard()` on a new callback recovers trials
logged before a process restart. Dashboard refreshes from one callback are
serialized, so `study.optimize(..., n_jobs=N)` cannot publish them out of order.
When multiple processes or nodes share a study and dashboard namespace, enable
`create_dashboard=True` in exactly one process; callbacks in the other workers
still log their trials with the default `create_dashboard=False`. The designated
writer's tag query includes trials from every worker. After all workers finish,
have the coordinating process call `update_dashboard()` once for the final
refresh.
Completed studies with two or three objectives also get a Pareto-front pane.
Later trials refresh the panes in `optuna_quadratic` every `refresh_every`
successful writes by the dashboard writer. The explicit final
`update_dashboard()` includes any trials left since the last scheduled refresh.
Plotly is only needed for the Optuna visualization panes. Timeline bars preserve
each trial's true duration, and a fixed-size marker at the true start time keeps
even sub-pixel trials visible and hoverable without exaggerating their runtime.
The summary pane links directly to the best and latest terminal trial
environments. The callback never opens a browser on its own.
Pass `raise_on_error=True` if a Visdom logging failure should stop optimization;
by default it emits a warning and allows the study to continue. Single- and
multi-objective studies are supported, and `COMPLETE`, `PRUNED` and `FAIL`
states are preserved in the `optuna_state` tag. A pruned trial retains every
intermediate value reported before pruning. Optuna remains responsible for the
pruning decision: call `trial.report()` and `trial.should_prune()` inside the
objective and raise `optuna.TrialPruned` when requested. Because Optuna invokes
study callbacks after a trial reaches a terminal state, `OptunaCallback`
records these values after the trial finishes rather than streaming them while
the trial is running. Optuna does not support `trial.report()` or
`trial.should_prune()` for multi-objective studies, so intermediate-value and
pruning support applies only to single-objective studies.
### System Monitor
**Requirements:** `pip install psutil`
`visdom.loggers.VisdomSystemMonitor` plots the CPU and RAM usage of the running script. A background thread samples the current process and its child processes (for example `DataLoader` workers) and appends the values to two line plots, `CPU usage (%)` and `RAM usage (MB)`. The x-axis is seconds since `start()`. The values come straight from the OS through psutil, so it works with any framework or none.
```python
import visdom
from visdom.loggers import VisdomSystemMonitor
viz = visdom.Visdom()
with VisdomSystemMonitor(viz, env="my_run", interval=5):
train()
```
Or start and stop it yourself:
```python
monitor = VisdomSystemMonitor(viz, env="my_run").start()
train()
monitor.stop()
```
**Parameters:**
- `viz`: a connected `visdom.Visdom()` instance
- `env`: environment to plot in (default: the client's own env)
- `interval`: seconds between samples (default: 5)
- `is_main_process`: set `True` or `False` to choose which process is monitored; by default only global rank 0 of a distributed job is
**Note:** the windows have fixed ids (`system_cpu`, `system_ram`), so a second run in the same env replaces them instead of adding more.
**Note:** CPU is the summed usage of the script and its children, divided by the number of cores the script may use. That is the size of its CPU affinity mask (a SLURM job pinned to 8 of 64 cores tops out at 100%), or all cores where the OS has no such mask, such as macOS. A container CPU quota is not taken into account. RAM is RSS summed per process, so memory shared between workers is counted once per worker.
**Note:** sampling and sending run on a daemon thread, so a slow or unreachable server never stalls training. While the server keeps failing, the wait between samples doubles up to 16 times `interval`, and goes back to `interval` once a sample gets through. A warning is raised once. Without psutil, `start()` warns and the monitor does nothing.
See `example/system_monitor_example.py` for a full working example.
## Details
### Basics
#### vis.image
This function draws an `img`. It takes as input an `CxHxW` tensor `img` that contains the image.
Most Python image libraries (e.g. OpenCV, PIL, matplotlib) return images in `HxWxC` format.
Passing images in that format will raise errors or lead to incorrect rendering.
For example:
```python
# Convert HxWxC → CxHxW before passing to vis.image
img = img.transpose(2, 0, 1) # NumPy
img = img.permute(2, 0, 1) # PyTorch
```
The following `opts` are supported:
- `jpgquality`: JPG quality (`number` 0-100). If defined image will be saved as JPG to reduce file size. If not defined image will be saved as PNG.
- `compresslevel`: PNG compression level (`integer` 0-9; default = `6`). Lower is faster and larger, `0` stores the image uncompressed. Ignored when `jpgquality` selects JPEG.
- `caption`: Caption for the image
- `store_history`: Keep all images stored to the same window and attach a slider to the bottom that will let you select the image to view. You must always provide this opt when sending new images to an image with history.
#### vis.update_image_slider
Programmatically set the visible frame of an `image_history` pane from Python:
```python
win = vis.image(img, opts=dict(store_history=True))
vis.image(img2, win=win, opts=dict(store_history=True))
vis.update_image_slider(win, index=1) # show second frame
```
The `index` is 0-based and is clamped to the valid range by the server. NumPy integer scalars (e.g. `np.int64`) are accepted and coerced automatically. Passing a non-integer or a non-`image_history` window raises an error.
> **Note** You can use alt on an image pane to view the x/y coordinates of the cursor. You can also ctrl-scroll to zoom, alt scroll to pan vertically, and alt-shift scroll to pan horizontally. Double click inside the pane to restore the image to default.
#### vis.image_heatmap
This function overlays a saliency or attention heatmap on top of an image. It takes a `CxHxW` or `HxW` array `img` (uint8 or float) and an `HxW` float array `heatmap` with values in `[0, 1]`. The blending is per-pixel — pixels where the heatmap is near zero stay close to the original image, so a zero-gradient background does not get tinted by the colormap.
```python
import numpy as np
from visdom import Visdom
viz = Visdom()
# img: CxHxW uint8 or float in [0, 1]
# heatmap: HxW float in [0, 1] — e.g. from a saliency method or attention map
viz.image_heatmap(img, heatmap, opts=dict(title="Saliency", alpha=0.6, colormap="jet"))
```
Any attribution method that produces an `HxW` numpy array works — gradient saliency, GradCAM, SHAP, or a hand-computed attention map.
The following `opts` are supported:
- `alpha`: blend strength (`float` in `[0, 1]`; default = `0.5`). Higher values make the heatmap more visible.
- `colormap`: matplotlib colormap name (`string`; default = `'jet'`). Falls back to a blue-red gradient if matplotlib is not installed.
- `caption`: caption for the image pane
- `jpgquality`: JPG quality (`number` 0-100). If set, the result is encoded as JPEG. Otherwise PNG.
- `compresslevel`: PNG compression level (`integer` 0-9; default = `6`). Lower is faster and larger, `0` stores the image uncompressed. Ignored when `jpgquality` selects JPEG.
- `normalize`: normalize the image to `[0, 1]` before blending (`boolean`; default = `False`)
> **Note** `heatmap` accepts any finite float range. Values outside `[0, 1]` are rescaled automatically via min-max normalization, so methods like SHAP or Integrated Gradients that return signed or unnormalized values work without any pre-processing. NaN maps to 0; infinite values are clamped to the `[0, 1]` boundary.
#### vis.images
This function draws a list of `images`. It takes an input `B x C x H x W` tensor or a `list of images` all of the same size. It makes a grid of images of size (B / nrow, nrow).
The following arguments and `opts` are supported:
- `nrow`: Number of images in a row
- `padding`: Padding around the image, equal padding around all 4 sides
- `opts.jpgquality`: JPG quality (`number` 0-100). If defined image will be saved as JPG to reduce file size. If not defined image will be saved as PNG.
- `opts.compresslevel`: PNG compression level (`integer` 0-9; default = `6`). Lower is faster and larger, `0` stores the image uncompressed. Ignored when `jpgquality` selects JPEG.
- `opts.caption`: Caption for the image
#### vis.text
This function prints text in a box. You can use this to embed arbitrary HTML.
It takes as input a `text` string.
No specific `opts` are currently supported.
#### vis.properties
This function shows editable properties in a pane. Properties are expected to be a List of Dicts e.g.:
```
properties = [
{'type': 'text', 'name': 'Text input', 'value': 'initial'},
{'type': 'number', 'name': 'Number input', 'value': '12'},
{'type': 'button', 'name': 'Button', 'value': 'Start'},
{'type': 'checkbox', 'name': 'Checkbox', 'value': True},
{'type': 'select', 'name': 'Select', 'value': 1, 'values': ['Red', 'Green', 'Blue']},
]
```
Supported types:
- text: string
- number: decimal number
- button: button labeled with "value"
- checkbox: boolean value rendered as a checkbox
- select: multiple values select box
- `value`: id of selected value (zero based)
- `values`: list of possible values
Callback are called on property value update:
- `event_type`: `"PropertyUpdate"`
- `propertyId`: position in the `properties` list
- `value`: new value
No specific `opts` are currently supported.
#### vis.html_table
This function renders structured data as a styled, static HTML
table (read-only — use `vis.table` if you need an editable pane).
Arguments:
- `data`: a 2D `list`/`tuple` of rows (each a `list`, `tuple` or 1-D
numpy array), a 2D numpy array, or a `list` of `dict`s (in which
case `headers` is derived from the first dict's keys unless
explicitly given). In case of an empty list, a table with only the
header row is rendered.
- `headers`: a `list`/`tuple`/1D numpy array of column names.
Required unless `data` is a list of dicts.
`vis.html_table` accepts the exact same `data`/`headers` input
shapes as `vis.table` (including numpy arrays and lists of dicts),
so the two functions are interchangeable in how you call them —
only the rendered pane differs (editable native table vs. static
HTML).
The following `opts` are supported:
- `opts.title`: title for the window (`string`; optional)
```python
vis.html_table(
data=[["Alice", 92], ["Bob", 87]],
headers=["Name", "Score"],
)
```
#### vis.table
This function renders a native, structured, editable table pane. Cells
(including the column headers) are editable in place, rows/columns can
be added or removed via `+`/`×` controls, and columns/rows can be
resized by dragging -- purely a client-side visual convenience, not
persisted server-side.
It takes as input `data`, either:
- a 2D list of rows (lists, tuples or 1-D numpy arrays, e.g. `list(arr)`),
with `headers` required, or
- a list of dicts, in which case `headers` is derived from the first
dict's keys unless explicitly given (and can be used to reorder or
select a subset of columns)
`data`/`headers` may also be passed as numpy arrays (e.g. `df.values` /
`df.columns.values`); they are converted to plain lists internally.
```python
vis.table(
data=[['Alpha', 92], ['Beta', 87]],
headers=['Name', 'Score'],
)
# or, from a list of dicts:
vis.table(data=[
{'Name': 'Alpha', 'Score': 92},
{'Name': 'Beta', 'Score': 87},
])
```
Supported `opts`:
- `editable`: whether cells/rows/columns can be edited by anyone
viewing the pane (boolean; default `True`). Set to `False` for a
read-only display table (e.g. a live leaderboard).
Edits made in the browser update the shared, persisted pane state
directly on the server (visible to every viewer, saved with the
environment). If you've also registered an event handler via
`register_event_handler`, your Python script additionally receives a
`TableEdit` event for each change:
- `event_type`: `"TableEdit"`
- `target`: pane id
- `op`: one of `"edit_cell"`, `"edit_header"`, `"add_row"`,
`"delete_row"`, `"add_col"`, `"delete_col"`
- `data`: the raw edit payload for that op (e.g. `{"row": 0, "col": 1,
"value": "new value"}` for `"edit_cell"`)
#### vis.audio
This function plays audio. It takes as input the filename of the audio
file or an `N` tensor containing the waveform (use an `Nx2` matrix for stereo
audio). The function does not support any plot-specific `opts`.
The following `opts` are supported:
- `opts.sample_frequency`: sample frequency (`integer` > 0; default = 44100)
Known issue: Visdom uses scipy to convert tensor inputs to wave files. Some
versions of Chrome are known not to play these wave files (Firefox and Safari work fine).
#### vis.video
This function plays a video. It takes as input the filename of the video
`videofile` or a `LxHxWxC`-sized
`tensor` containing all the frames of the video as input. The
function does not support any plot-specific `opts`.
The following `opts` are supported:
- `opts.fps`: FPS for the video (`integer` > 0; default = 25)
Note: Using `tensor` input requires that ffmpeg is installed and working.
Your ability to play video may depend on the browser you use: your browser has
to support the Theano codec in an OGG container (Chrome supports this).
#### vis.svg
This function draws an SVG object. It takes as input a SVG string `svgstr` or
the name of an SVG file `svgfile`. The function does not support any specific
`opts`.
#### vis.matplot
This function draws a Matplotlib `plot`. The function supports
one plot-specific option: `resizable`.
> **Note** When set to `True` the plot is resized with the
pane. You need `beautifulsoup4` and `lxml`
packages installed to use this option.
> **Note**: `matplot` is not rendered using the same backend as plotly plots, and is somewhat less efficient. Using too many matplot windows may degrade visdom performance.
#### vis.plotlyplot
This function draws a Plotly `Figure` object. It does not explicitly take options as it assumes you have already explicitly configured the figure's `layout`.
> **Note** You must have the `plotly` Python package installed to use this function. It can typically be installed by running `pip install plotly`.
**Saving plots as images from code (without using the browser download button):** Pass `save_path` to save the figure to a file when plotting, e.g. `vis.plotlyplot(fig, save_path="plot.png")`. You can also save a figure without displaying it using `vis.save_plotly_figure(fig, "plot.png")`. Both require the optional `kaleido` package: `pip install kaleido`.
```python
import plotly.graph_objects as go
from visdom import Visdom
viz = Visdom()
fig = go.Figure(go.Scatter(x=[1, 2, 3], y=[4, 5, 6], mode="lines+markers"))
viz.plotlyplot(fig, save_path="my_plot.png")
viz.save_plotly_figure(fig, "my_plot.png")
```
#### vis.embeddings
This function visualizes a collection of features using t-SNE dimensionality reduction (powered by [openTSNE](https://github.com/pavlin-policar/openTSNE) or [bhtsne](https://github.com/lvdmaaten/bhtsne) as a fallback). `openTSNE` is installed automatically as a dependency of visdom, so this feature works out of the box.
The function accepts the following arguments:
- `features`: a list of tensors
- `labels`: a list of corresponding labels for the tensors provided for `features`
- `data_getter=fn`: (optional) a function that takes as a parameter an index into the features array and returns a summary representation of the tensor. If this is set, `data_type` must also be set.
- `data_type=str`: (optional) currently the only acceptable value here is `"html"`
- `opts.register_embedding_events`: (optional) set to `False` to skip registering the default Python client event handler for hover previews and lasso drilldown. This leaves embeddings interaction events for external server or frontend code to handle.
We currently assume that there are no more than 10 unique labels, in the future we hope to provide a colormap in opts for other cases.
From the UI you can also draw a lasso around a subset of features. This will rerun the t-SNE visualization on the selected subset.
#### vis.save
This function saves the `envs` that are alive on the visdom server. It takes input a list of env ids to be saved.
### Plotting
Further details on the wrapped plotting functions are given below.
The exact inputs into the plotting functions vary, although most of them take as input a tensor `X` that contains the data and an (optional) tensor `Y` that contains optional data variables (such as labels or timestamps). All plotting functions take as input an optional `win` that can be used to plot into a specific window; each plotting function also returns the `win` of the window it plotted in. One can also specify the `env` to which the visualization should be added.
#### vis.scatter
This function draws a 2D or 3D scatter plot. It takes as input an `Nx2` or
`Nx3` tensor `X` that specifies the locations of the `N` points in the
scatter plot. An optional `N` tensor `Y` containing discrete labels that
range between `1` and `K` can be specified as well -- the labels will be
reflected in the colors of the markers.
`update` can be used to efficiently update the data of an existing plot. Use `'append'` to append data, `'replace'` to use new data, or `'remove'` to remove the trace specified by `name`.
Using `update='append'` will create a plot if it doesn't exist and append to the existing plot otherwise.
If updating a single trace, use `name` to specify the name of the trace to be updated. Update data that is all NaN is ignored (can be used for masking update).
The following `opts` are supported:
- `opts.markersymbol` : marker symbol (`string`; default = `'dot'`)
- `opts.markersize` : marker size (`number`; default = `'10'`)
- `opts.markercolor` : color per marker. (`torch.*Tensor`; default = `nil`)
- `opts.markerborderwidth`: marker border line width (`float`; default = 0.5)
- `opts.legend` : `table` containing legend names
- `opts.textlabels` : text label for each point (`list`: default = `None`)
- `opts.aspectmode` : how the three axes of a 3D plot are scaled (`string`; default = `'auto'`). One of:
- `auto` : proportional to the data extents (like `data`), but Plotly switches to `cube` when one axis spans more than 4x the others -- so a plot with one dominant dimension silently renders distorted.
- `data` : always proportional to the data extents, so 1 unit looks the same on every axis -- use this for point clouds, SLAM maps, trajectories, or anything where shape must be preserved.
- `cube` : all three axes drawn the same length regardless of the data, deliberately distorting proportions to fill a cube.
- `manual` : proportions taken from `opts.aspectratio` (falls back to `1:1:1` if not set).
- `opts.aspectratio` : per-axis scale for `manual` mode, a dict `{'x': .., 'y': .., 'z': ..}` (`dict`; default = `None`).
- `opts.layoutopts` : dict of any additional options that the graph backend accepts for a layout. For example `layoutopts = {'plotly': {'legend': {'x':0, 'y':0}}}`.
- `opts.traceopts` : dict mapping trace names or indices to dicts of additional options that the graph backend accepts. For example `traceopts = {'plotly': {'myTrace': {'mode': 'markers'}}}`.
- `opts.webgl` : use WebGL for plotting (`boolean`; default = `false`). It is faster if a plot contains too many points. Use sparingly as browsers won't allow more than a couple of WebGL contexts on a single page.
`opts.markercolor` is a Tensor with Integer values. The tensor can be of size `N` or `N x 3` or `K` or `K x 3`.
- Tensor of size `N`: Single intensity value per data point. 0 = black, 255 = red
- Tensor of size `N x 3`: Red, Green and Blue intensities per data point. 0,0,0 = black, 255,255,255 = white
- Tensor of size `K` and `K x 3`: Instead of having a unique color per data point, the same color is shared for all points of a particular label.
#### vis.sunburst
This function draws a sunburst chart. It takes two input arrays: `labels` and `parents`.
Values from the `labels` array define the sector's label or name. Values from the `parents` array define the hierarchical structure, indicating which parent sector a sector belongs to -- note that at least one entry in `parents` must be an empty string `""`, marking the root of the hierarchy. Keep in mind that the `labels` and `parents` arrays must be of equal length. There is an optional third array called `values`, which is used to display a numerical value when hovering over a sector. If provided, the `values` array must be the same length as `labels` and `parents`.
Examples: `vis.sunburst(labels, parents, opts)` or `vis.sunburst(labels, parents, values, opts)`
Following `opts` are currently supported:
- `opts.font_size` : define font size of label (`int`)
- `opts.font_color` : define font color of label (`string`)
- `opts.opacity` : define opacity of chart (`float`, between 0 and 1)
- `opts.line_width` : define distance between two sectors and sector to its parents (`int`)
- `opts.maxdepth` : maximum number of hierarchy levels visible at once -- a positive integer, or `-1` to show all levels (`int`)
- `opts.branchvalues` : `'total'` or `'remainder'` -- how `values` are interpreted relative to children (`string`; default = `'remainder'`)
#### vis.line
This function draws a line plot. It takes as input an `N` or `NxM` tensor
`Y` that specifies the values of the `M` lines (that connect `N` points)
to plot. It also takes an optional `X` tensor that specifies the
corresponding x-axis values; `X` can be an `N` tensor (in which case all
lines will share the same x-axis values) or have the same size as `Y`.
`update` can be used to efficiently update the data of an existing plot. Use 'append' to append data, 'replace' to use new data, or 'remove' to remove the trace specified by `name`. If updating a single trace, use `name` to specify the name of the trace to be updated. Update data that is all NaN is ignored (can be used for masking update).
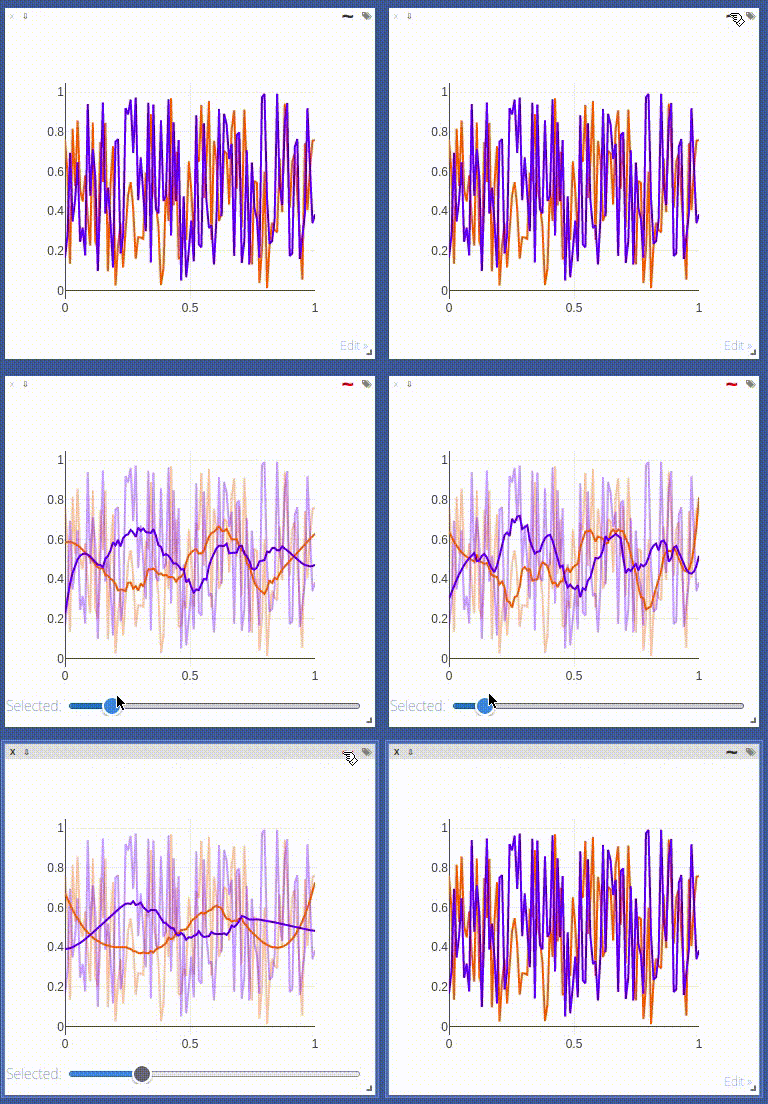
**Smoothing**: Line plots can be smoothened using [Savitzky-Golay filtering](https://en.wikipedia.org/wiki/Savitzky%E2%80%93Golay_filter). This feature can be enabled by clicking the `~`-symbol in the top right corner of a window that contains a line plot.
The following `opts` are supported:
- `opts.fillarea` : fill area below line (`boolean`)
- `opts.markers` : show markers (`boolean`; default = `false`)
- `opts.markersymbol`: marker symbol (`string`; default = `'dot'`)
- `opts.markersize` : marker size (`number`; default = `'10'`)
- `opts.linecolor` : line colors (`np.array`; default = None)
- `opts.dash` : line dash type for each line (`np.array`; default = 'solid'), one of `solid`, `dash`, `dashdot` or `dash`, size should match number of lines being drawn
- `opts.legend` : `table` containing legend names
- `opts.aspectmode` : axis scaling for 3D line plots (`string`; default = `'auto'`); `auto` is proportional to the data but flips to `cube` when one axis is over 4x the others, `data` stays proportional so shape is preserved, `cube` forces all axes to equal length, `manual` uses `opts.aspectratio`.
- `opts.aspectratio` : per-axis scale `{'x': .., 'y': .., 'z': ..}` for `manual` mode (`dict`; default = `None`).
- `opts.layoutopts` : `dict` of any additional options that the graph backend accepts for a layout. For example `layoutopts = {'plotly': {'legend': {'x':0, 'y':0}}}`.
- `opts.traceopts` : `dict` mapping trace names or indices to `dict`s of additional options that plot.ly accepts for a trace.
- `opts.webgl` : use WebGL for plotting (`boolean`; default = `false`). It is faster if a plot contains too many points. Use sparingly as browsers won't allow more than a couple of WebGL contexts on a single page.
#### vis.roc_curve
This function draws a ROC curve for binary classification.
It accepts either:
- raw binary labels and scores via `y_true` and `y_score`, or
- precomputed curve points via `fpr` and `tpr`.
The following `opts` are supported:
- `opts.title` : plot title (`string`; default includes ROC-AUC)
- `opts.legend` : two legend labels for curve and baseline (`list`)
- `opts.xlabel` : x-axis label (`string`; default = `False Positive Rate`)
- `opts.ylabel` : y-axis label (`string`; default = `True Positive Rate`)
- `opts.layoutopts` : additional backend layout options (`dict`)
#### vis.pr_curve
This function draws a precision-recall curve for binary classification.
It accepts either:
- raw binary labels and scores via `y_true` and `y_score`, or
- precomputed curve points via `precision` and `recall`.
A baseline showing the true class prevalence is only drawn for the
`y_true`/`y_score` path, since prevalence cannot be recovered from
`precision`/`recall` points alone.
The following `opts` are supported:
- `opts.title` : plot title (`string`; default includes PR-AUC)
- `opts.legend` : two legend labels for curve and baseline (`list`); only one label is needed when no baseline is drawn
- `opts.xlabel` : x-axis label (`string`; default = `Recall`)
- `opts.ylabel` : y-axis label (`string`; default = `Precision`)
- `opts.layoutopts` : additional backend layout options (`dict`)
#### vis.learning_curve
This function draws named machine-learning metrics as line plots. It accepts a mapping from metric names to scalar values or equal-length 1D series and forwards to [`vis.line`](#visline).
For example:
```python
win = vis.learning_curve(
{"train_loss": [1.0, 0.8, 0.6], "val_loss": [1.1, 0.9, 0.7]},
step=[1, 2, 3],
env="training",
opts={"title": "Loss", "ylabel": "loss"},
)
vis.learning_curve(
{"train_loss": 0.55, "val_loss": 0.68},
step=4,
win=win,
env="training",
update="append",
)
```
#### vis.stem
This function draws a stem plot. It takes as input an `N` or `NxM` tensor
`X` that specifies the values of the `N` points in the `M` time series.
An optional `N` or `NxM` tensor `Y` containing timestamps can be specified
as well; if `Y` is an `N` tensor then all `M` time series are assumed to
have the same timestamps.
The following `opts` are supported:
- `opts.colormap`: colormap (`string`; default = `'Viridis'`)
- `opts.legend` : `table` containing legend names
- `opts.layoutopts` : `dict` of any additional options that the graph backend accepts for a layout. For example `layoutopts = {'plotly': {'legend': {'x':0, 'y':0}}}`.
#### vis.heatmap
This function draws a heatmap. It takes as input an `NxM` tensor `X` that
specifies the value at each location in the heatmap.
`update` can be used to efficiently update the data of an existing plot. Use 'appendRow' to append data row-wise, 'appendColumn' to append data column-wise, 'prependRow' to prepend data row-wise, 'prependColumn' to prepend data column-wise, 'replace' to use new data, or 'remove' to remove the plot specified by `win`.
The following `opts` are supported:
- `opts.colormap` : colormap (`string`; default = `'Viridis'`)
- `opts.xmin` : clip minimum value (`number`; default = `X:min()`)
- `opts.xmax` : clip maximum value (`number`; default = `X:max()`)
- `opts.columnnames`: `table` containing x-axis labels
- `opts.rownames` : `table` containing y-axis labels
- `opts.layoutopts` : `dict` of any additional options that the graph backend accepts for a layout. For example `layoutopts = {'plotly': {'legend': {'x':0, 'y':0}}}`.
- `opts.nancolor` : color for plotting `NaN`s. If this is `None`, `NaN`s will be plotted as transparent. (`string`; default = `None`)
#### vis.confusion_matrix
This function draws a confusion matrix for classification evaluation.
It accepts either:
- raw label vectors via `y_true` and `y_pred`, or
- a precomputed confusion matrix via `cm`.
Optional normalization can be applied with the `normalize` parameter:
- `'true'`: normalize by row (actual class)
- `'pred'`: normalize by column (predicted class)
- `'all'`: normalize by total count
An existing confusion matrix window can be modified with the `update` parameter:
- `'replace'`: redraw the whole matrix in the window given by `win`
- `'remove'`: delete the window given by `win`
The following `opts` are supported:
- `opts.title` : plot title (`string`; default = `Confusion Matrix`)
- `opts.xlabel` : x-axis label (`string`; default = `Predicted`)
- `opts.ylabel` : y-axis label (`string`; default = `Actual`)
- `opts.colormap` : Plotly colorscale (`string`; default = `Blues`)
- `opts.showCounts` : show raw counts in cells (`bool`; default = `True`)
- `opts.showPercent` : show percentages in cells (`bool`; default = `True` when normalized, `False` otherwise)
- `opts.layoutopts` : `dict` of any additional options that the graph backend accepts for a layout.
#### vis.bar
This function draws a regular, stacked, or grouped bar plot. It takes as
input an `N` or `NxM` tensor `X` that specifies the height of each of the
bars. If `X` contains `M` columns, the values corresponding to each row
are either stacked or grouped (depending on how `opts.stacked` is
set). In addition to `X`, an (optional) `N` tensor `Y` can be specified
that contains the corresponding x-axis values.
The following plot-specific `opts` are currently supported:
- `opts.rownames`: `table` containing x-axis labels
- `opts.stacked` : stack multiple columns in `X`
- `opts.legend` : `table` containing legend labels
- `opts.layoutopts` : `dict` of any additional options that the graph backend accepts for a layout. For example `layoutopts = {'plotly': {'legend': {'x':0, 'y':0}}}`.
#### vis.histogram
This function draws a histogram of the specified data. It takes as input
an `N` tensor `X` that specifies the data of which to construct the
histogram.
The following plot-specific `opts` are currently supported:
- `opts.numbins`: number of bins (`number`; default = 30)
- `opts.layoutopts` : `dict` of any additional options that the graph backend accepts for a layout. For example `layoutopts = {'plotly': {'legend': {'x':0, 'y':0}}}`.
#### vis.histogram2d
This function draws a 2D histogram (density map) of paired data. It takes as
input two `N` tensors `X` and `Y` of equal length that hold the coordinates of
`N` points; the points are binned into a 2D grid and each cell is colored by
the number of points that fall in it.
The following plot-specific `opts` are currently supported:
- `opts.xnumbins`: number of bins along the x-axis (`number`; default lets Plotly choose)
- `opts.ynumbins`: number of bins along the y-axis (`number`; default lets Plotly choose)
- `opts.colormap`: colormap (`string`; default = `'Viridis'`)
- `opts.histnorm`: normalization of the bin counts, one of `''`, `'percent'`, `'probability'`, `'density'`, or `'probability density'`
#### vis.boxplot
This function draws boxplots of the specified data. It takes as input
an `N` or an `NxM` tensor `X` that specifies the `N` data values of which
to construct the `M` boxplots.
The following plot-specific `opts` are currently supported:
- `opts.legend`: labels for each of the columns in `X`
- `opts.layoutopts` : `dict` of any additional options that the graph backend accepts for a layout. For example `layoutopts = {'plotly': {'legend': {'x':0, 'y':0}}}`.
#### vis.violin
This function draws violin plots of the specified data. It takes as input an
`N` or an `NxM` tensor `X` that specifies the `N` data values of which to
construct the `M` violin plots.
The following plot-specific `opts` are currently supported:
- `opts.legend`: labels for each of the columns in `X`
- `opts.showbox`: overlay a mini box plot inside the violin (`bool`; default = `True`)
- `opts.showmeanline`: overlay the mean line (`bool`; default = `True`)
- `opts.points`: which raw points to show alongside the violin, one of `'all'`, `'outliers'`, `'suspectedoutliers'`, or `False` (default = `False`)
- `opts.jitter`: amount of jitter applied to displayed points (`float` in `[0, 1]`; default = `0.3`)
- `opts.orientation`: `'v'` for vertical or `'h'` for horizontal violins (default = `'v'`)
- `opts.bandwidth`: bandwidth of the kernel density estimate (`None` lets Plotly choose automatically)
- `opts.side`: which side of the centre line to draw, one of `'both'`, `'positive'`, or `'negative'` (default = `'both'`)
#### vis.pie
This function draws a pie chart based on the `N` tensor `X`. The values in
`X` must be non-negative and define the size of each slice.
The following plot-specific `opts` are currently supported:
- `opts.legend`: `list` containing legend names
- `opts.layoutopts` : `dict` of any additional options that the graph backend accepts for a layout. For example `layoutopts = {'plotly': {'legend': {'x':0, 'y':0}}}`.
#### vis.surf
This function draws a surface plot. It takes as input an `NxM` tensor `X`
that specifies the value at each location in the surface plot.
The following `opts` are supported:
- `opts.colormap`: colormap (`string`; default = `'Viridis'`)
- `opts.xmin` : clip minimum value (`number`; default = `X:min()`)
- `opts.xmax` : clip maximum value (`number`; default = `X:max()`)
- `opts.aspectmode` : axis scaling for the 3D surface (`string`; default = `'auto'`); `auto` is proportional to the data but flips to `cube` when one axis is over 4x the others, `data` stays proportional so shape is preserved, `cube` forces all axes to equal length, `manual` uses `opts.aspectratio`.
- `opts.aspectratio` : per-axis scale `{'x': .., 'y': .., 'z': ..}` for `manual` mode (`dict`; default = `None`).
- `opts.layoutopts` : `dict` of any additional options that the graph backend accepts for a layout. For example `layoutopts = {'plotly': {'legend': {'x':0, 'y':0}}}`.
#### vis.contour
This function draws a contour plot. It takes as input an `NxM` tensor `X`
that specifies the value at each location in the contour plot.
The following `opts` are supported:
- `opts.colormap`: colormap (`string`; default = `'Viridis'`)
- `opts.xmin` : clip minimum value (`number`; default = `X:min()`)
- `opts.xmax` : clip maximum value (`number`; default = `X:max()`)
- `opts.layoutopts` : `dict` of any additional options that the graph backend accepts for a layout. For example `layoutopts = {'plotly': {'legend': {'x':0, 'y':0}}}`.
#### vis.quiver
This function draws a quiver plot in which the direction and length of the
arrows is determined by the `NxM` tensors `X` and `Y`. Two optional `NxM`
tensors `gridX` and `gridY` can be provided that specify the offsets of
the arrows; by default, the arrows will be done on a regular grid.
The following `opts` are supported:
- `opts.normalize`: length of longest arrows (`number`)
- `opts.arrowheads`: show arrow heads (`boolean`; default = `true`)
- `opts.layoutopts` : `dict` of any additional options that the graph backend accepts for a layout. For example `layoutopts = {'plotly': {'legend': {'x':0, 'y':0}}}`.
#### vis.mesh
This function draws a mesh plot from a set of vertices defined in an
`Nx2` or `Nx3` matrix `X`, and polygons defined in an optional `Mx2` or
`Mx3` matrix `Y`.
The following `opts` are supported:
- `opts.color`: color (`string`)
- `opts.opacity`: opacity of polygons (`number` between 0 and 1)
- `opts.aspectmode`: axis scaling for a 3D (`Nx3`) mesh (`string`; default = `'auto'`); `auto` is proportional to the data but flips to `cube` when one axis is over 4x the others, `data` stays proportional so shape is preserved, `cube` forces all axes to equal length, `manual` uses `opts.aspectratio`.
- `opts.aspectratio`: per-axis scale `{'x': .., 'y': .., 'z': ..}` for `manual` mode (`dict`; default = `None`).
- `opts.layoutopts` : `dict` of any additional options that the graph backend accepts for a layout. For example `layoutopts = {'plotly': {'legend': {'x':0, 'y':0}}}`.
#### vis.sankey
This function draws a Sankey (flow) diagram. Flows are defined by three
equal-length arrays:
- `source`: source node index of each link (`N` array of ints)
- `target`: target node index of each link (`N` array of ints)
- `value` : magnitude of each link (`N` array of non-negative numbers)
`labels` is an optional list of node names. If omitted, nodes are referenced
by their index alone.
The following `opts` are supported:
- `opts.labels` : list of node labels (alternative to the `labels` arg)
- `opts.pad` : node padding in px (`number`; default = 15)
- `opts.thickness` : node thickness in px (`number`; default = 20)
- `opts.orientation`: `'h'` (default) or `'v'`
- `opts.nodecolor` : node color(s) (`string` or list of strings)
- `opts.linkcolor` : link color(s) (`string` or list of strings)
- `opts.layoutopts` : `dict` of any additional options that the graph backend accepts for a layout.
#### vis.dual_axis_lines
This function will create a line plot using plotly with different Y-Axis.
`X` = A numpy array of the range.
`Y1` = A numpy array of the same count as `X`.
`Y2` = A numpy array of the same count as `X`.
The following `opts` are supported:
- `opts.height` : Height of the plot
- `opts.width` : Width of the plot
- `opts.name_y1` : Axis name for Y1 plot
- `opts.name_y2` : Axis name for Y2 plot
- `opts.title` : Title of the plot
- `opts.color_title_y1` : Color of the Y1 axis Title
- `opts.color_tick_y1` : Color of the Y1 axis Ticks
- `opts.color_title_y2` : Color of the Y2 axis Title
- `opts.color_tick_y2` : Color of the Y2 axis Ticks
- `opts.side` : side on which the Y2 tick has to be placed. Has values 'right' or `left`.
- `opts.showlegend` : Display legends (boolean values)
- `opts.top` : Set the top margin of the plot
- `opts.bottom` : Set the bottom margin of the plot
- `opts.right` : Set the right margin of the plot
- `opts.left` : Set the left margin of the plot
This is the image of the output:
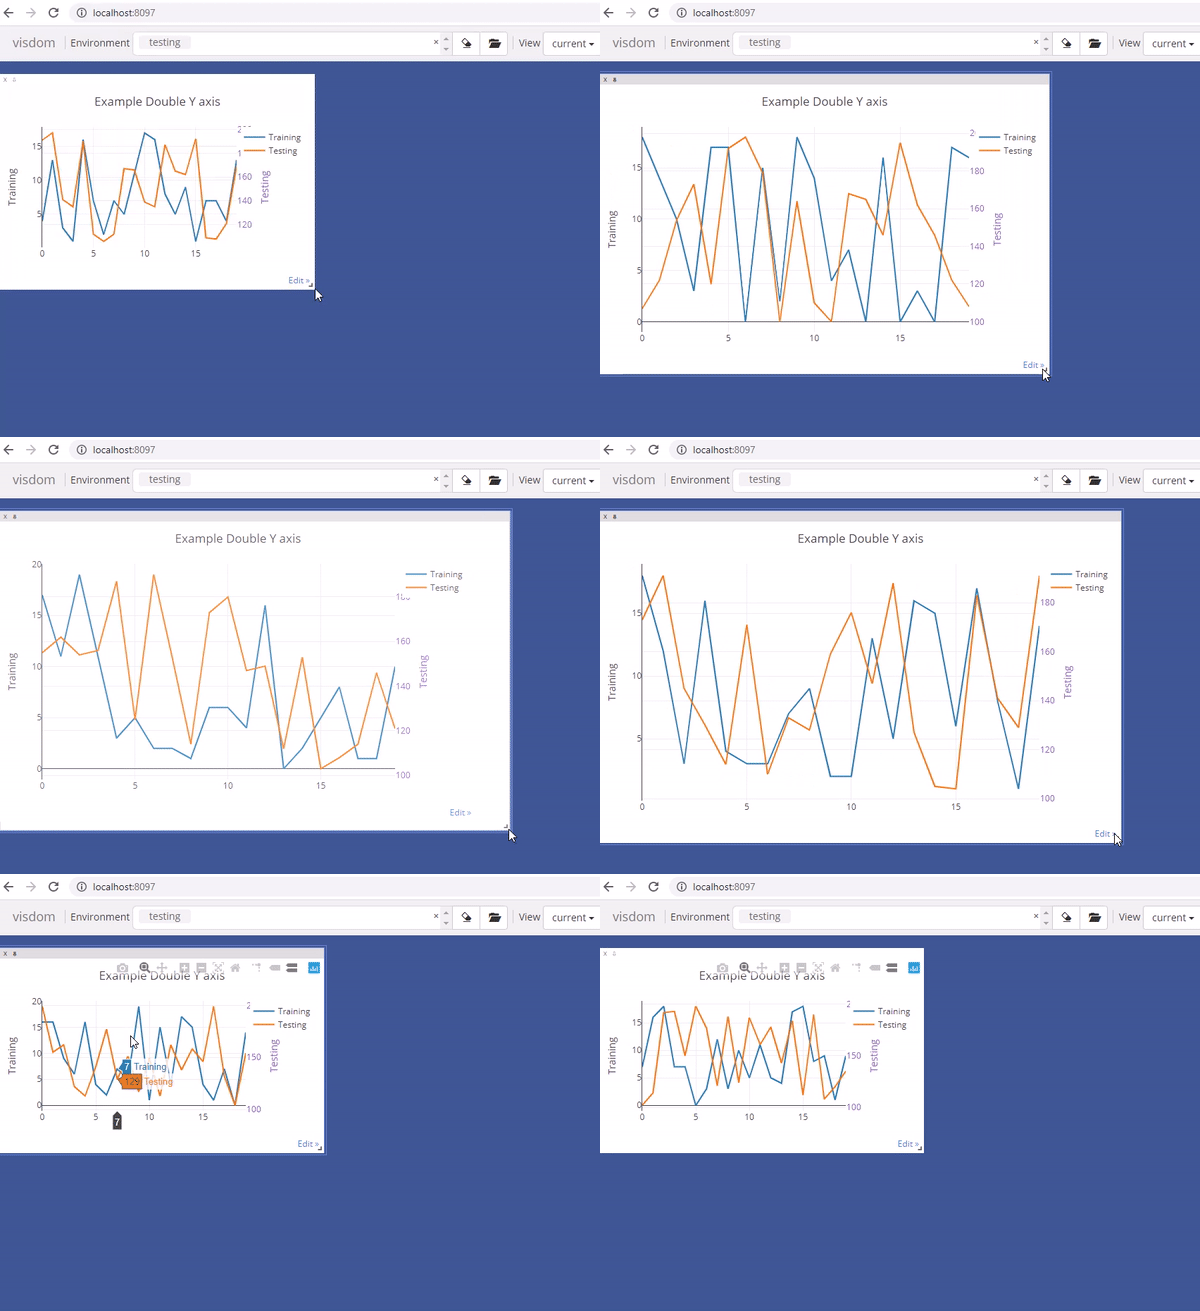
#### vis.graph
This function draws a graph, in which the nodes and edges are taken from a 2-D matrix of size [,2] where each row contains a source and destination node value. The numeric value used to define nodes should be strictly between (0 to n-1), where n is the number of nodes.
There are two optional arguments :
- `edgeLabels` : list of custom edge labels. If not provided each edge gets a label, "source-destination", eg "1-2", size should be equal to size of input "edges". Optional.
- `nodeLabels` : list of custom node labels. If not provided each node gets a label same as the numeric value defined in the "edges". size should be equal to number of nodes present. Optional.
The following opts are supported:
- `opts.height` : Height of the plot. Default : 500
- `opts.width` : Width of the plot. Default : 500
- `opts.directed` : whether the plot should have an arrow or not. Default : false
- `opts.showVertexLabels` : Whether to show vertex labels. Default : true
- `opts.showEdgeLabels` : Whether to show edge labels. Default : false
- `opts.scheme` : Whether all nodes should have "same" color or "different". Default : "same"
### Customizing plots
The plotting functions take an optional `opts` table as input that can be used to change (generic or plot-specific) properties of the plots.
All input arguments are specified in a single table; the input arguments are matches based on the keys they have in the input table.
The following `opts` are generic in the sense that they are the same for all visualizations (except `plot.image`, `plot.text`, `plot.video`, and `plot.audio`):
- `opts.title` : figure title
- `opts.width` : figure width
- `opts.height` : figure height
- `opts.showlegend` : show legend (`true` or `false`)
- `opts.xtype` : type of x-axis (`'linear'` or `'log'`)
- `opts.xlabel` : label of x-axis
- `opts.xtick` : show ticks on x-axis (`boolean`)
- `opts.xtickmin` : first tick on x-axis (`number`)
- `opts.xtickmax` : last tick on x-axis (`number`)
- `opts.xtickvals` : locations of ticks on x-axis (`table` of `number`s)
- `opts.xticklabels` : ticks labels on x-axis (`table` of `string`s)
- `opts.xtickstep` : distances between ticks on x-axis (`number`)
- `opts.xtickfont` : font for x-axis labels (dict of [font information](https://plot.ly/javascript/reference/#layout-font))
- `opts.ytype` : type of y-axis (`'linear'` or `'log'`)
- `opts.ylabel` : label of y-axis
- `opts.ytick` : show ticks on y-axis (`boolean`)
- `opts.ytickmin` : first tick on y-axis (`number`)
- `opts.ytickmax` : last tick on y-axis (`number`)
- `opts.ytickvals` : locations of ticks on y-axis (`table` of `number`s)
- `opts.yticklabels` : ticks labels on y-axis (`table` of `string`s)
- `opts.ytickstep` : distances between ticks on y-axis (`number`)
- `opts.ytickfont` : font for y-axis labels (dict of [font information](https://plot.ly/javascript/reference/#layout-font))
- `opts.marginleft` : left margin (in pixels)
- `opts.marginright` : right margin (in pixels)
- `opts.margintop` : top margin (in pixels)
- `opts.marginbottom`: bottom margin (in pixels)
- `opts.caption` : caption displayed below the plot (`string`; optional)
`opts` are passed as dictionary in python scripts.You can pass `opts` like:
opts=dict(title="my title", xlabel="x axis",ylabel="y axis")
OR
opts={"title":"my title", "xlabel":"x axis","ylabel":"y axis"}
The other options are visualization-specific, and are described in the
documentation of the functions.
### Others
#### vis.close
This function closes a specific window. It takes input window id `win` and environment id `eid`. Use `win` as `None` to close all windows in an environment.
#### vis.delete_env
This function deletes a specified env entirely. It takes env id `eid` as input.
> **Note**: `delete_env` deletes all data for an environment and is IRREVERSIBLE. Do not use unless you absolutely want to remove an environment.
#### vis.fork_env
This function forks an environment, similar to the UI feature.
Arguments:
- `prev_eid`: Environment ID that we want to fork.
- `eid`: New Environment ID that will be created with the fork.
> **Note**: `fork_env` an exception will occur if an env that doesn't exist is forked.
#### vis.win_exists
This function returns a bool indicating whether or not a window `win` exists on the server already. Returns None if something went wrong.
Optional arguments:
- `env`: Environment to search for the window in. Default is `None`.
#### vis.get_env_list
This function returns a list of all of the environments on the server at the time of calling. It takes no arguments.
#### vis.get_window_data
This function returns the window data for the given window. Returns data for all windows in an env if win is None.
Arguments:
- `env`: Environment to search for the window in.
- `win`: Window to return data for. Set to `None` to retrieve all the windows in an environment.
#### vis.set_tags
This function replaces an environment's key/value tags. Pass `append=True` to
keep its existing tags and add or update the supplied keys instead. `env`
defaults to the client's current environment. An empty mapping clears all tags
in replace mode.
```python
vis.set_tags({"dataset": "cifar10", "stage": "training"})
vis.set_tags({"stable": ""}, append=True)
```
Arguments:
- `tags`: mapping of string tag names to string values (maximum 20 names, 50 characters each)
- `env`: target environment; defaults to the client's current environment
- `append`: append/update instead of replace; defaults to `False`
The complete stored tag mapping is returned.
#### vis.get_tags
This function returns an environment's key/value tag mapping. `env` defaults to
the client's current environment; an environment without tags returns `{}`.
```python
tags = vis.get_tags()
# {"dataset": "cifar10", "stage": "training", "stable": ""}
```
#### vis.check_connection
This function returns a bool indicating whether or not the server is connected. It accepts an optional argument `timeout_seconds` for a number of seconds to wait for the server to come up.
#### vis.replay_log
This function takes the contents of a visdom log and replays them to the current server to restore a state or handle any missing entries.
Arguments:
- `log_filename`: log file to replay the contents of.
#### vis.restore_run
Replays a run's plots from the files a `visdom.tracking.RunTracker(..., record_data=True)` run wrote (`RunTracker.track(vis)` wraps a client so its chart calls auto-log to the run): reconstructs every chart the run plotted, in the order it plotted them, into a target environment. `record_data=True` is what makes a run replayable at all — without it, a run's files describe what happened but don't keep the exact data needed to redraw it.
```python
from visdom import Visdom
vis = Visdom(server="http://localhost", port=8097)
result = vis.restore_run(
"visdom_runs/mnist_baseline_20261020-123155_a4828e4c.json",
env="mnist_replay",
)
print(result)
```
By default every recorded update is sent back-to-back, as fast as the server accepts them, which for a run with many epochs can make the dashboard jump straight to its final state instead of filling in step by step. Pass `delay` (seconds) to instead wait that long between each replayed update, so the dashboard fills in the way the original run did. The server paces this with `asyncio.sleep` on its own event loop rather than blocking it, so other clients' requests are still served normally while a replay with `delay` is running.
Arguments:
- `json_path`: path to the run's `.json` metadata file; its sibling `.events.jsonl` (the run's full timeline) must be alongside it.
- `env`: environment to replay into. Defaults to the env the run's own calls were originally sent to.
- `delay`: seconds to wait between replayed updates. Defaults to `None` (no delay, replay as fast as possible).
Returns a dict: `run_id`, `name`, `status`, `eid` (the env replayed into), `total` (calls recorded), `replayed` (successfully resent), `failed`, and `errors` (one message per failed call, if any). Raises `visdom.tracking.restore.RunRestoreError` if the run has no replayable data recorded, and `ValueError` up front for an invalid `delay`.
Also available as `POST /restore_run` (body: `{"path": ..., "eid": ..., "delay": ...}`, `path` resolved under the `VISDOM_TRACKING_DIR` environment variable, defaulting to `visdom_runs`), so a run can be replayed directly into a running server without a Python client in between. Refused (`403`) in `-readonly` mode, and subject to the same per-workspace storage limits as any other write.
### Experiments
Attach experiment metadata — hyper-parameters, metric observations and tags — to an environment, then search and compare runs across your server. Metadata is stored under the environment's `experiment` key and persisted through the server's data store, so a server started without a persistence path (`env_path=None`) has nothing to store, search or compare. Each function returns the server's reply decoded as a dict.
#### vis.experiment
This function creates or updates the experiment metadata for an environment. Calling it again for the same env merges in new params/tags and overwrites the name/description, so it is safe to call at the start of and again during a run.
Arguments:
- `name`: Display name for the experiment. Defaults to the env id.
- `params`: Hyper-parameters as a dict of `{name: value}`.
- `tags`: Free-form tags as a dict of `{name: value}`.
- `description`: Free-form description.
- `env`: Environment to attach the experiment to. Defaults to the client's env.
#### vis.log_metrics
This function appends one or more metric observations to an env's experiment, creating the experiment automatically if it does not exist yet.
Arguments:
- `metrics`: A non-empty dict of `{name: value}` observations.
- `step`: Optional training step the observations were recorded at.
- `env`: Environment whose experiment to log to. Defaults to the client's env.
> **Note**: once an experiment is finished (see `finish_experiment`), further `experiment`/`log_metrics` writes are rejected so a completed run's recorded data cannot change after the fact.
#### vis.finish_experiment
This function marks an env's experiment terminal so its recorded data is frozen.
Arguments:
- `status`: Terminal status, either `finished` (default) or `failed`.
- `env`: Environment whose experiment to finish. Defaults to the client's env.
#### vis.search_experiments
This function searches the experiments logged on the server, across all environments. The `query` uses a small readable syntax — comparisons (`<`, `<=`, `>`, `>=`, `=`, `!=`, `contains`) over param, metric and tag names, combined with `AND`/`OR` and parentheses. A name is matched bare (`acc`) or namespaced (`metric.acc`, `param.lr`, `tag.owner`) when ambiguous; metrics compare on their latest value. Queries are evaluated in Python, never `eval`'d, so a hostile query is a parse error rather than code execution.
```python
vis.search_experiments("lr < 0.01 AND acc > 0.9")
vis.search_experiments("status = finished AND (dataset contains mnist)")
```
Arguments:
- `query`: The filter string. `None` (default) returns everything.
- `limit`: Maximum results to return (default `100`). `None` returns all matches.
- `offset`: Number of results to skip, for paging (default `0`).
- `sort_by`: Field to sort by (any of the same names). Defaults to newest-created first.
- `descending`: Sort direction (default `True`).
Returns a dict of `experiments` (one page's worth), the unpaged `total` matching the query, and the `limit`/`offset`/`query` used.
`search_experiments`, `compare_experiments` and `suggest_experiment` ask the server a question rather than record something, so an offline client (`Visdom(offline=True)`) has nothing to answer with and each returns `None`.
#### vis.compare_experiments
This function compares the named experiments field by field to see what differs. Finding the runs is `search_experiments`' job — it answers "which runs match?"; this answers "how do these runs differ?". To compare a query's matches, search first and pass the resulting ids on.
Arguments:
- `env_ids`: A list (or tuple) of environment ids to compare, in the order given. Each must have an experiment.
Returns a dict with the compared runs (`env_ids`, full `experiments`) and a `params`, `metrics` and `tags` section. Each section lists the union of `fields`, the `shared` ones every run agrees on, the `differing` rest, the per-run `values`, and `groups` clustering the runs that agree per field.
#### vis.suggest_experiment
> **Reserved**: this endpoint is a stub. Choosing the next set of hyper-parameters to try (an Optuna-backed search strategy) is planned for a later release, so the server currently replies `501 Not Implemented` and this function returns a stub dict `{"status": "not_implemented", "suggestion": None, ...}` rather than a real suggestion. The method, its arguments and the endpoint are in place so callers and docs are ready for when the strategy is wired in.
Arguments:
- `params`: The search space to suggest over, as a dict of `{name: spec}`. Currently ignored by the stub.
- `env`: Environment (study) to suggest against. Defaults to the client's env.
#### vis.hparams
This function opens a hyper-parameter pane over the experiments logged on the server. The selection is resolved server-side: the matching runs are flattened into one record each — the run's hyper-parameters, the latest value of each of its metrics, and its tags — and registered as an `hparams` window, so the pane appears in the browser like any other visualization and reloads with its environment. The environment is saved as soon as the pane exists, so it survives a server restart without an explicit save. The pane heads the window with how many runs, params, metrics and tags the selection holds and lists the runs by name with their status; its download button saves the records as JSON.
```python
vis.hparams("lr < 0.01 AND acc > 0.9") # by query
vis.hparams(env_ids=["run-a", "run-b"]) # by env id
vis.hparams("acc > 0.9", ["run-a", "run-b"]) # both
```
Arguments:
- `query`: Filter string selecting the runs to show, in the same readable syntax as [`vis.search_experiments`](#vissearch_experiments). Defaults to `None`.
- `env_ids`: Explicit list of environment ids to show, kept in the order given. Defaults to `None`.
- `mode`: One of `query`, `env_ids` or `both`. Defaults to `None`, which infers the mode from the arguments given; passing it explicitly rejects the argument that mode does not accept.
- `win`: Window id to draw into, as for the plotting functions.
- `env`: Environment to open the pane in. Defaults to the client's env.
- `opts`: Window options (`title`, `width`, `height`, ...), as for the plotting functions.
Returns the id of the created window. The resolved selection is stored on the window, so [`vis.update_hparams`](#visupdate_hparams) can re-run it later.
The modes select as follows:
- `query`: the runs matching `query`. The query must be non-empty and `env_ids` must not be given.
- `env_ids`: the runs named in `env_ids`, in that order; only those environments are read rather than every experiment. `env_ids` must be non-empty and `query` must not be given.
- `both`: the intersection — runs that match `query` *and* are named in `env_ids`, ordered by `env_ids`. Both must be given and non-empty.
There is no "show everything" call: with neither `query` nor `env_ids` the server has nothing to select and rejects the request. A blank or whitespace-only `query` counts as no query. Every id in `env_ids` must name an environment that has an experiment: a mistyped or deleted one is a `404` naming it rather than a run quietly missing from the pane. Under `both`, an id that does have an experiment but does not match the query is filtered out as the query asked.
The pane then keeps itself current: logging a run (`log_experiment`, `log_metrics`, `finish_experiment`) refreshes every open pane whose selection that run could affect, and pushes the rebuilt pane to connected clients. A pane selected by `query` is re-run on any logged run, since a run that did not match before may match now; a pane selected by `env_ids` only follows the runs it names. Refreshes are batched over a short window, so a training loop logging a metric every step costs one rebuild per burst rather than one per step.
#### vis.update_hparams
This function changes or refreshes an existing hyper-parameter pane — the dedicated write path for `hparams` windows, since the generic update route only understands plot windows. Called with a `query`/`env_ids`/`mode` selection the pane's selection is replaced, under the rules of [`vis.hparams`](#vishparams); called with only `win` the selection stored on the window is re-run, a manual refresh that picks up runs logged (or newly matching) since the pane was built. That refresh is also what a logged run triggers on its own, so calling it by hand is mainly for panes in environments the server has not loaded. The pane keeps its id and position, is rebuilt in place, and the environment is saved so the update reaches disk immediately.
```python
win = vis.hparams("lr < 0.01")
vis.update_hparams(win, "lr < 0.1 AND acc > 0.9") # replace the selection
vis.update_hparams(win) # refresh as-is
```
Arguments:
- `win`: Id of the pane to update (required). Unknown windows are a 404; non-hparams windows a 400.
- `query` / `env_ids` / `mode`: The replacement selection, validated exactly as on [`vis.hparams`](#vishparams).
- `env`: Environment holding the window. Defaults to the client's env.
- `opts`: Overrides the pane's title/size; when omitted the current ones are kept.
Returns the window id.
## Customizing Visdom
The user config directory for visdom is
- `~/.config/visdom` for Linux
- `~/Library/Preferences/visdom` for OSX
- `%APPDATA%/visdom` for Windows
By placing a `style.css` in you user config directory, visdom will serve the customized css file along with the default style-file.
In addition, it is also possible to create a project-specific file; just place the file `style.css` in your `env_path`.
## License
visdom is Apache 2.0 licensed, as found in the LICENSE file.
## Note on Lua Torch Support
Support for Lua Torch was deprecated following `v0.1.8.4`. If you'd like to use torch support, you'll need to download that release. You can follow the usage instructions there, but it is no longer officially supported.
## Contributing
See guidelines for contributing and running E2E/visual tests with Playwright [here.](./CONTRIBUTING.md)
## Acknowledgments
Visdom was inspired by tools like [display](https://github.com/szym/display) and relies on [Plotly](https://plot.ly/) as a plotting front-end.