# Livemark [![Build](https://img.shields.io/github/actions/workflow/status/frictionlessdata/livemark/general.yaml?branch=main)](https://github.com/frictionlessdata/livemark/actions) [![Coverage](https://img.shields.io/codecov/c/github/frictionlessdata/livemark/main)](https://codecov.io/gh/frictionlessdata/livemark) [![Registry](https://img.shields.io/pypi/v/livemark.svg)](https://pypi.python.org/pypi/livemark) [![Codebase](https://img.shields.io/badge/codebase-github-brightgreen)](https://github.com/frictionlessdata/livemark) [![Support](https://img.shields.io/badge/support-slack-brightgreen)](https://join.slack.com/t/frictionlessdata/shared_invite/zt-17kpbffnm-tRfDW_wJgOw8tJVLvZTrBg) ```yaml remark type: primary text: This documentation portal is completely written and published in Livemark notation ``` Data presentation framework for Python that generates static sites from extended Markdown with interactive charts, tables, scripts, and other features. ## Purpose - **Data Journalism**: Livemark provides a complete toolset for working with data, starting from data extraction and ending with a published website containing interactive charts, tables, and other features. - **Software Education**: Livemark is perfectly suited for writing education materials as it uses code execution model in markdown documents. It solves a range of problems with testing and having your code example up-to-date. - **Python Development**: Livemark can be used in software development as a helper tool for working on Python projects. It provides an ability to create documentation sites and works as a task runner. ## Examples ```html markup
``` ## Features ```html markup
  • Open Source (MIT)
  • Full Markdown compatibility
  • Markdown extensions such as tables and charts
  • Straight-forward command-line interface
  • Much faster than many competitors
  • Livereload development server
``` ```yaml remark type: success text: Most important Markdown features added by Livemark are listed below ``` ## Logic > https://jinja.palletsprojects.com/en/3.0.x/templates/ Livemark processes your document using the Jinja templating language. Inside templates, you can use [Frictionless Framework](https://framework.frictionlessdata.io/) as a `frictionless` variable to work with tabular data. This is a high-level data preprocessing framework so you can combine Logic with other syntax, such as Table or Chart: {% raw %} ``` {% for car in frictionless.Resource('data/cars.csv').read_rows(size=5) %} - {{ car.brand }} {{ car.model }}: ${{ car.price }} {% endfor %} ``` {% endraw %} {% for car in frictionless.Resource('data/cars.csv').read_rows(size=5) %} - {{ car.brand }} {{ car.model }}: ${{ car.price }} {% endfor %} ## Table > https://datatables.net/manual/index Livemark supports CSV table rendering using DataTables, which you can see in the example below (replace the single quotes with back ticks). The `data` property will be read at the build stage so in addition to DataTables options you can pass a [file path](https://raw.githubusercontent.com/frictionlessdata/livemark/main/data/cars.csv) as `data` property (CSV/Excel/JSON are supported). Use `columns` property to customize fields or their order: ```yaml '''yaml table data: data/cars.csv width: 600 order: - [3, 'desc'] columns: - data: type - data: brand - data: model - data: price - data: kmpl - data: bhp ''' ``` ```yaml table data: data/cars.csv width: 600 order: - [3, 'desc'] columns: - data: type - data: brand - data: model - data: price - data: kmpl - data: bhp ``` ## Chart > https://vega.github.io/vega-lite/ Livemark supports Vega Lite visualisations rendering (to try this example, replace the single quotes with back ticks): ```yaml '''yaml chart data: url: data/cars.csv mark: circle selection: brush: type: interval # other options are omitted width: 500 height: 300 ''' ``` ```yaml chart data: url: data/cars.csv mark: circle selection: brush: type: interval encoding: x: type: quantitative field: kmpl scale: domain: [12,25] y: type: quantitative field: price scale: domain: [100,900] color: condition: selection: brush field: type type: nominal value: grey size: type: quantitative field: bhp width: 500 height: 300 ``` ## Script > https://www.python.org/ Livemark supports Python/Bash script execution inside Markdown. We think of this as a lightweight version of Jupyter Notebooks. Sometimes, a declarative Logic/Table/Chart is not enough for presenting data so you might also want to include the scripts. This example uses [Frictionless Framework](https://framework.frictionlessdata.io/) code to transform the dataset: ```python script from pprint import pprint from frictionless import Resource, transform, steps brands = transform( Resource("data/cars.csv"), steps=[ steps.table_normalize(), steps.table_aggregate(group_name="brand", aggregation={"price": ("price", max)}), steps.row_sort(field_names=["price"], reverse=True), steps.row_slice(head=5), ], ) pprint(brands.read_rows()) ``` ## Markup > https://getbootstrap.com/docs/5.0/getting-started/introduction/ With Livemark you can use HTML inside Markdown with Bootstrap support. Here is an example of creating a responsive grid of cards (note that if we set a `livemark-markdown` class we can use markdown inside html): ```html '''html markup
![Package](assets/data-package.png)

Data Package

A simple container format for describing a coherent collection of data in a single package.

''' ``` ```html markup

Data Package

A simple container format for describing a coherent collection of data in a single package.

Data Resource

A simple format to describe and package a single data resource such as a individual table or file.
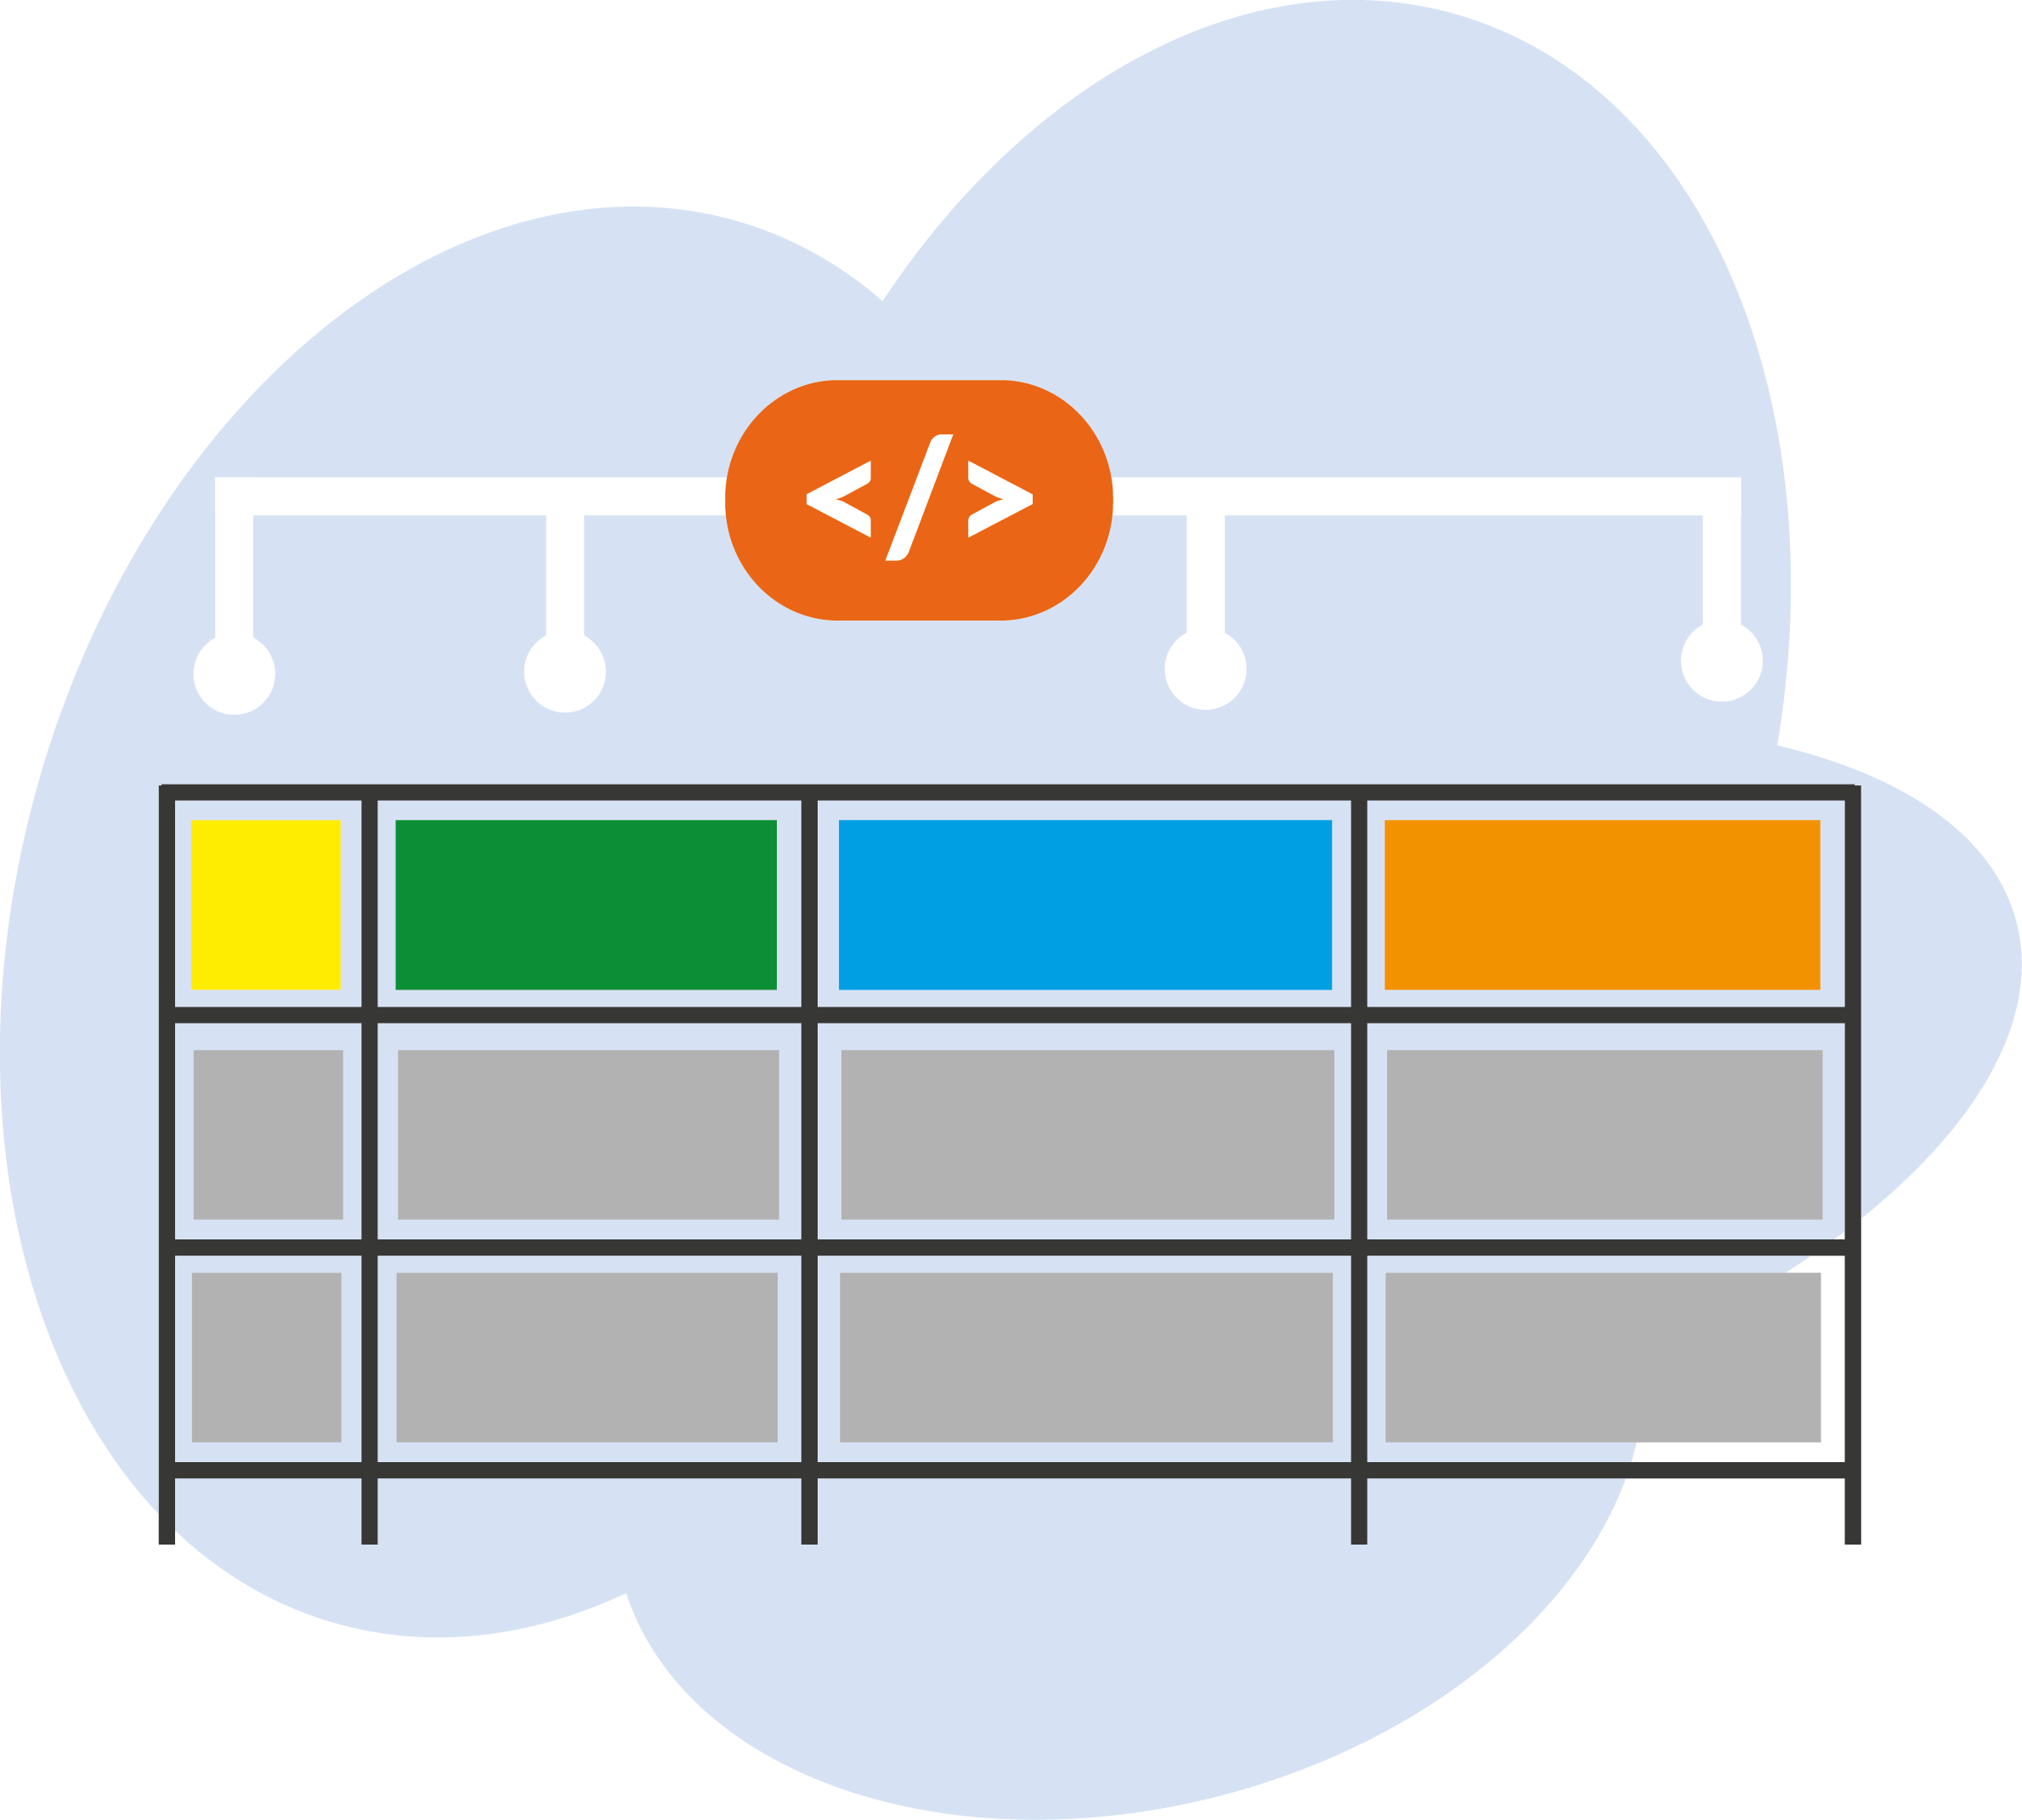
Table Schema

A simple format to declare a schema for tabular data. The schema is designed to be expressible in JSON.

``` --- Please read the full [Feature Reference](pages/feature-reference/general.html) to learn about all of Livemark's features.