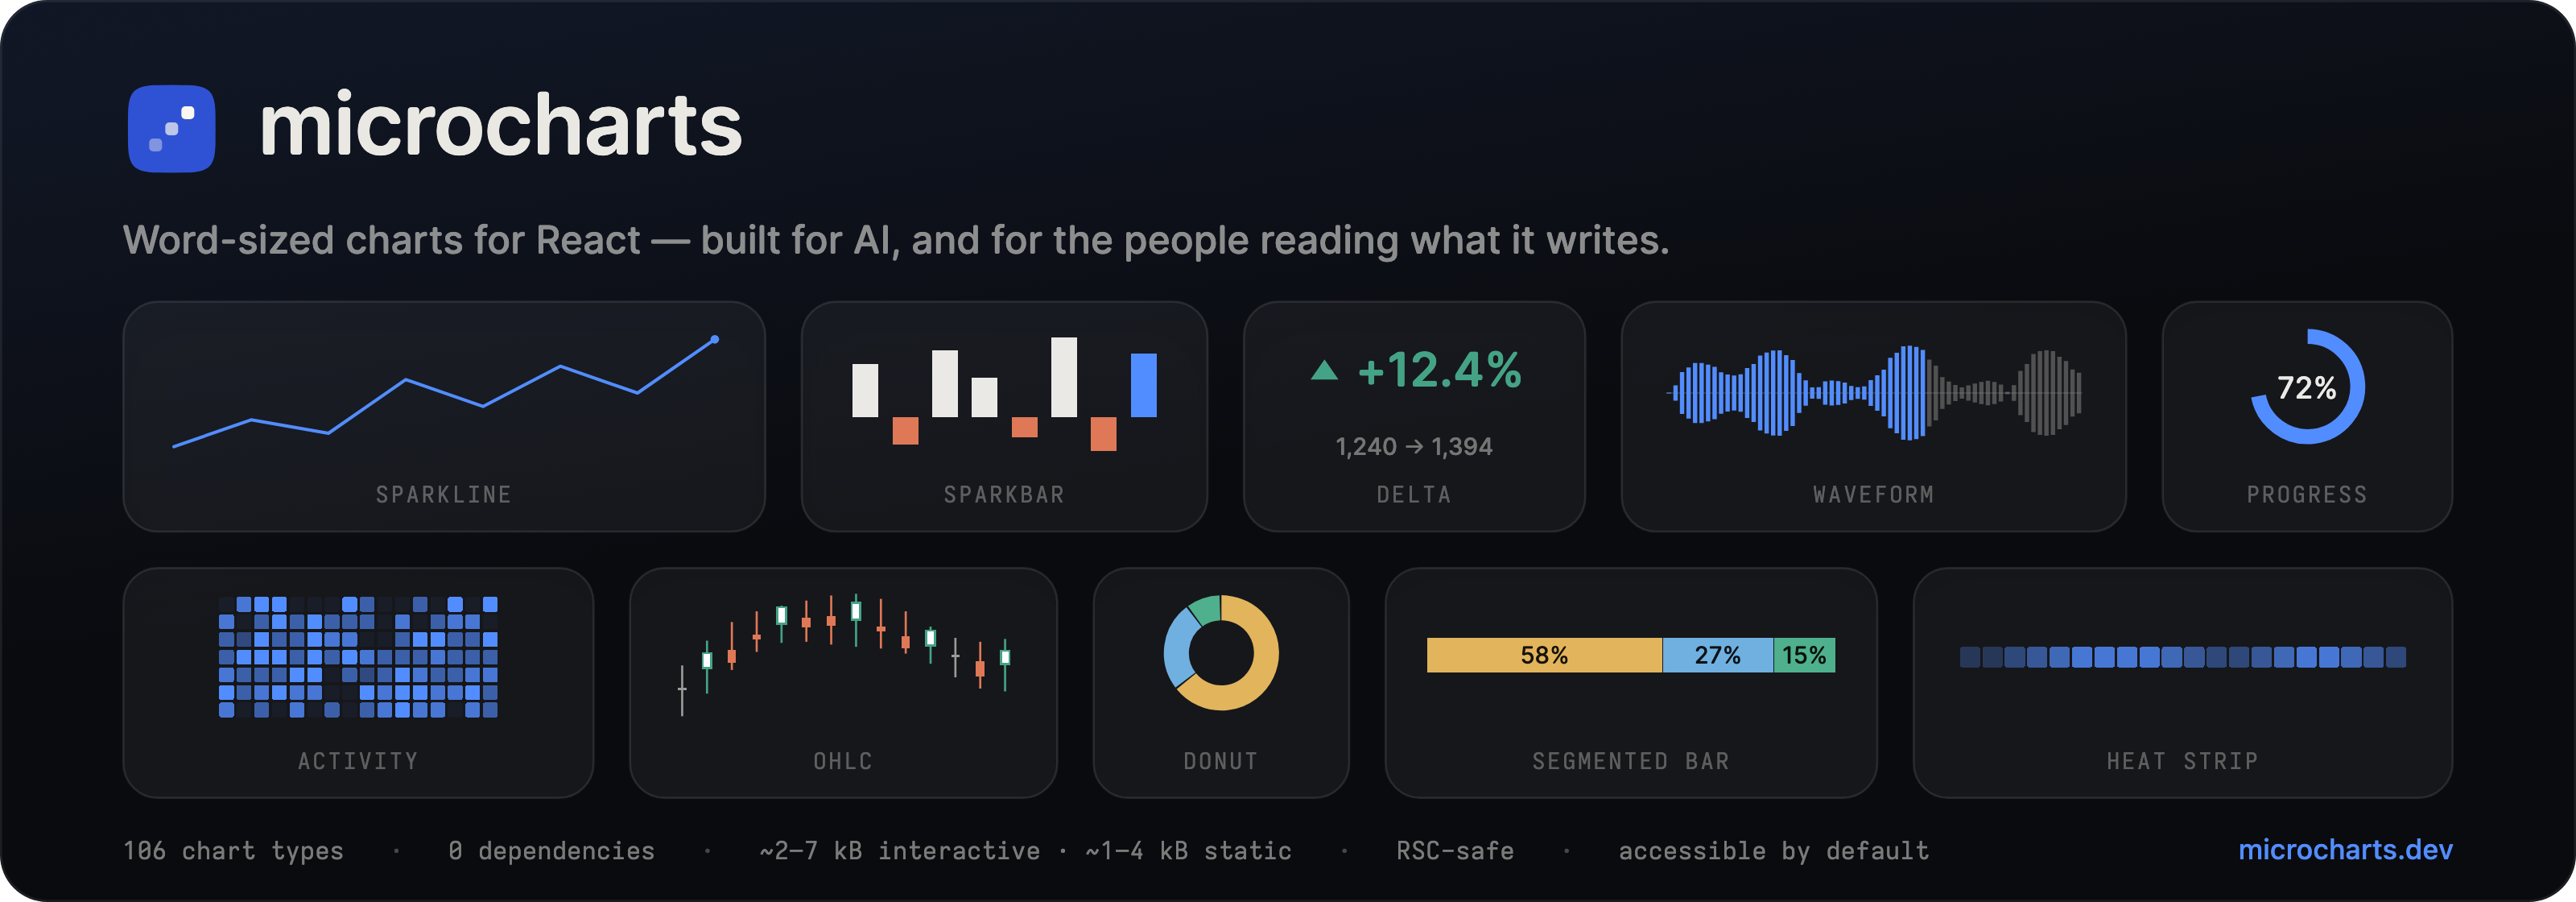
microcharts — word-sized charts for React, made for AI first and for the people reading what it writes. 106 chart types, zero dependencies, ~2–7 kB interactive · ~1–4 kB static. # @microcharts/react **Word-sized charts for React** — zero runtime dependencies, ~2–7 kB interactive · ~1–4 kB static, accessible by default, and server-component safe.
[![npm](https://img.shields.io/npm/v/@microcharts/react?color=2f52d4&label=npm)](https://www.npmjs.com/package/@microcharts/react) [![gzip per chart](https://img.shields.io/badge/per_chart-~2–7_live_·_~1–4_static_kB-2f52d4)](https://microcharts.dev/docs/performance) [![zero dependencies](https://img.shields.io/badge/dependencies-0-077353)](https://microcharts.dev) [![types](https://img.shields.io/npm/types/@microcharts/react?color=2f52d4)](https://microcharts.dev) [![React 18 · 19](https://img.shields.io/badge/React-18_·_19-077353)](https://microcharts.dev/docs/quickstart) [![MIT](https://img.shields.io/npm/l/@microcharts/react?color=666)](./LICENSE) [![Reviewed with Argos](https://argos-ci.com/badge.svg)](https://argos-ci.com?utm_source=ganapativs/microcharts&utm_campaign=oss) **[Docs](https://microcharts.dev)** · **[Gallery](https://microcharts.dev/docs/charts)** · **[Quickstart](https://microcharts.dev/docs/quickstart)** · **[AI usage](https://microcharts.dev/docs/ai)** · **[llms.txt](https://microcharts.dev/llms.txt)**

--- microcharts is **106 tiny, handcrafted chart types** built to sit _inside_ an interface: a sentence, a table cell, a KPI card, a tab header, a streamed AI reply. The grammar is small enough for a model to emit correctly mid-sentence, and every chart describes itself in words, so a chart an LLM streams into a chat reply is one a person can read and check. > **Status:** tested and in production use, but not across every stack and edge yet. If you hit something, open an issue > on [GitHub](https://github.com/ganapativs/microcharts/issues). ## Why - **AI-native.** A chart is plain `data` plus a generated sentence. One grammar across all 106 types — a model that has seen one chart can write them all. → [AI usage](https://microcharts.dev/docs/ai) - **Zero dependencies.** No chart engine, no D3 — just SVG. React is the only peer. CI-enforced, forever. - **Server-component safe.** Static charts are hook-free and render to HTML with **zero client JavaScript**. Interactivity is a separate opt-in `/interactive` import. - **Accessible by default.** Every chart is an `img` with a natural-language summary built from your data; it updates when the numbers do. → [Accessibility](https://microcharts.dev/docs/accessibility) - **Tiny.** **~2–7 kB interactive · ~1–4 kB static** gzip per chart, budget-gated in CI. Every type has one documented, honest encoding channel and a stated precision. - **Motion, opt-in.** Interactive charts draw on with `animate` plus one `import "@microcharts/react/motion"`, and glide continuous marks when data updates. Entrances respect `prefers-reduced-motion` and never replay over server-rendered HTML. → [Motion](https://microcharts.dev/docs/motion) ## Install ```bash npm install @microcharts/react ``` Import the stylesheet **once** at the root of your app — it carries every theming token and chart style in a low-specificity cascade layer, so your own styles always win: ```tsx // app/layout.tsx import "@microcharts/react/styles.css"; ``` ## Your first chart Every chart renders from `data` alone. This works in a **React Server Component** with zero client JavaScript — pure SVG, and its accessible name is generated from the data. ```tsx import { Sparkline } from "@microcharts/react/sparkline"; ; ``` Each chart imports from its **own subpath**, so you only ship what you use. Every chart follows the same two-entry pattern: a static default, and an `/interactive` twin. ## Add interactivity Need hover, keyboard navigation, touch, or live announcements? Import the same chart from `/interactive`. The rendered output and the accessible name are identical, because the interactive entry composes its static twin. It only **adds** props; you opt into the client component where it matters. ```tsx import { Sparkline } from "@microcharts/react/sparkline/interactive"; ; ``` Every interactive chart shares one contract, so you learn it once. Hover or arrow keys make a unit **active**; a click, tap, Enter, or Space **selects** it and pins the readout so it survives blur; Escape or a press outside the chart clears; Home/End jump to the ends. Read it back with `onActive` and `onSelect` — payload `{ index, value, label?, formatted? }`, where `value` is the raw number and `formatted` is the chart's ready-to-display string — and control the pin with `selectedIndex` / `defaultSelectedIndex`. Set `readout={false}` to hide the in-chart value chip and render `datum.formatted` wherever you like. Single-unit scalar charts (Delta, Progress, StatusDot, Bullet, …) take `onSelect` alone. ```tsx setHovered(d?.value ?? null)} onSelect={(d) => pin(d)} /> ``` ## Annotate with children Thresholds, markers, and target zones are **children** — the same grammar on every chart that supports them: ```tsx import { Sparkline } from "@microcharts/react/sparkline"; import { Threshold, Marker } from "@microcharts/react/annotations"; ; ``` ## Theme it About two dozen `--mc-*` CSS custom properties are the runtime contract; presets are token bundles. Set one on a subtree with the provider — presets are visual only and never change what the data means: ```tsx import { MicroProvider } from "@microcharts/react"; ; ``` Presets: `modern` (default), `editorial`, `mono`, `vivid`, plus output-context `print` and `eink`. Dark mode is hand-tuned, not inverted. For a whole brand theme, `defineTheme` (from `@microcharts/react/theme`) derives a matched, color-blind-safe palette and dark twins from one accent: ```tsx import { defineTheme } from "@microcharts/react/theme"; const brand = defineTheme({ accent: "#6d28d9" }); …; ``` Retune density with one scalar (`--mc-density`), give figures their own face (`--mc-font-numeric`), or recolor a single categorical chart with a `colors` array. → [Theming guide](https://microcharts.dev/docs/theming) ## The catalog **106 stable chart types** — 34 core, 26 decision, 23 expressive, 23 frontier — grouped by the _question_ each one answers. `data` alone always renders something correct, and a prop name means the same thing on every chart (`domain`, `color`, `title`, `summary`, `label`, `format`…), so picking a chart is picking the question you need answered. Sparklines, bars, deltas, and bullets through bump charts, funnels, honeycombs, calendar strips, and confidence bands — **[browse them all in the live gallery →](https://microcharts.dev/docs/charts)** > **Not shipping, on purpose:** pie, needle-gauge/speedometer, battery, waffle, violin. Each fails at micro scale or on > the honest-encoding bar, and each has an in-catalog replacement (Bullet for gauges, SegmentedBar for pie, MicroBox for > violin). → [what to use instead](https://microcharts.dev/llms.txt) ## Made for models A model writes the chart; a person reads it. The docs site publishes machine surfaces alongside the human ones: | Surface | What it is | | --------------------------------------------------------- | --------------------------------------------------- | | [`/llms.txt`](https://microcharts.dev/llms.txt) | Curated map of the catalog and guides | | [`/llms-full.txt`](https://microcharts.dev/llms-full.txt) | The complete generated docs corpus | | [`/catalog.json`](https://microcharts.dev/catalog.json) | Every chart's name, import path, props, data shapes | ## The MCP server The surfaces above are for reading. [`@microcharts/mcp`](https://www.npmjs.com/package/@microcharts/mcp) lets an assistant call the library directly: a Model Context Protocol server that runs on your machine over stdio, with three tools backed by this library — **find** the chart type that answers a question, **get** its exact props and a ready-to-render sample, and **render** it to a self-contained SVG with the generated alt text attached. ```json { "mcpServers": { "microcharts": { "command": "npx", "args": ["-y", "@microcharts/mcp"] } } } ``` Works in Claude Desktop, Claude Code, Cursor, and VS Code; nothing is hosted and no key is involved. The same three capabilities ship as Vercel AI SDK tools on the `@microcharts/mcp/ai-sdk` subpath. Full reference: [microcharts.dev/docs/mcp](https://microcharts.dev/docs/mcp). Also listed in the [Glama MCP registry](https://glama.ai/mcp/servers/ganapativs/microcharts). ## Compatibility React **18 and 19**. ESM-only, per-component subpath exports, types-first export conditions. Static charts render in any RSC or SSR setup with no client runtime. `sideEffects` is a two-entry allowlist, never `false`: `styles.css` and the opt-in `./motion` engine are both imported for their side effects, and `false` would let a bundler drop them. Every other module is side-effect free and tree-shakes normally, and since charts ship as per-component subpaths, you only pay for the ones you import. ## Contributing ```bash pnpm install pnpm check # typecheck + lint + format + test + knip pnpm size # gzip budgets (needs a build first) pnpm build ``` Bug fixes and fixes to existing charts are the most useful thing to send. New props and new chart types are open but held to a high bar — the catalog is already broad at 106 types, so a new one needs a question the others can't answer. Either way, open an issue and wait for a yes before you open a PR. [CONTRIBUTING.md](./CONTRIBUTING.md) has the policy, the CI gates, and what a good bug report contains. ## License [MIT](./LICENSE) © [Ganapati V S](https://meetguns.com)
