" to ask it to launch/attach to the target process.
(Default: `2345`)
|
| `processId` | _n/a_ |
Option 1: Use process picker to select a process to attach, or Process ID as integer.
Allowed Values: `"${command:pickProcess}"`, `"${command:pickGoProcess}"`
Option 2: Attach to a process by name. If more than one process matches the name, use the process picker to select a process.
Option 3: The numeric ID of the process to be debugged. If 0, use the process picker to select a process.
(Default: `0`)
|
| `program` | Path to the program folder (or any go file within that folder) when in `debug` or `test` mode, and to the pre-built binary file to debug in `exec` mode. If it is not an absolute path, the extension interprets it as a workspace relative path.
(Default: `"${workspaceFolder}"`)
|
_n/a_ |
| `remotePath` | _n/a_ | (Deprecated) *Use `substitutePath` instead.*
The path to the source code on the remote machine, when the remote path is different from the local machine. If specified, becomes the first entry in substitutePath. Not supported with `dlv-dap`.
(Default: `""`)
|
| `showGlobalVariables` | Boolean value to indicate whether global package variables should be shown in the variables pane or not.
(Default: `false`)
| _same as Launch_|
| `showLog` | Show log output from the delve debugger. Maps to dlv's `--log` flag.
(Default: `false`)
| _same as Launch_|
| `showPprofLabels` | Configures which pprof lables to show as the goroutine name in the threads view
| _same as Launch_|
| `showRegisters` | Boolean value to indicate whether register variables should be shown in the variables pane or not.
(Default: `false`)
| _same as Launch_|
| `stackTraceDepth` | Maximum depth of stack trace collected from Delve.
(Default: `50`)
| _same as Launch_|
| `stderrTo` | Writes the program's standard error to a file
(Default: `""`)
| _n/a_ |
| `stdinFrom` | Reads the program's standard input from a file
(Default: `""`)
| _n/a_ |
| `stdoutTo` | Writes the program's standard output to a file
(Default: `""`)
| _n/a_ |
| `stopOnEntry` | Automatically stop program after launch.
(Default: `false`)
| Automatically stop program after attach.
(Default: `false`)
|
| `substitutePath` | An array of mappings from a local path (editor) to the remote path (debugee). This setting is useful when working in a file system with symbolic links, running remote debugging, or debugging an executable compiled externally. The debug adapter will replace the local path with the remote path in all of the calls.
- `"from"`: The absolute local path to be replaced when passing paths to the debugger.
(Default: `""`)
- `"to"`: The absolute remote path to be replaced when passing paths back to the client.
(Default: `""`)
| An array of mappings from a local path (editor) to the remote path (debugee). This setting is useful when working in a file system with symbolic links, running remote debugging, or debugging an executable compiled externally. The debug adapter will replace the local path with the remote path in all of the calls. Overridden by `remotePath`.
- `"from"`: The absolute local path to be replaced when passing paths to the debugger.
(Default: `""`)
- `"to"`: The absolute remote path to be replaced when passing paths back to the client.
(Default: `""`)
|
| `trace` | Various levels of logging shown in the debug console & 'Go Debug' output channel. When using the `legacy` debug adapter, the logs will also be written to a file if it is set to a value other than `error`.
Allowed Values: `"verbose"`, `"trace"`, `"log"`, `"info"`, `"warn"`, `"error"`
(Default: `"error"`)
|
_same as Launch_|
| `traceDirPath` | Directory in which the record trace is located or to be created for a new output trace. For use on 'replay' mode only
(Default: `""`)
| _n/a_ |
| `waitFor` | _n/a_ | Wait for a process with a name beginning with the given prefix
(Default: `""`)
|
⚠️ Delve resolves relative paths from `dlv dap` process's working directory, but
from which directory the extension spawns the `dlv dap` process is an
implementation detail. Thus, use
[the VS Code variables substitution](https://code.visualstudio.com/docs/editor/variables-reference)
to ensure consistent expansion of paths. VS Code will resolve the variables
inside strings in `launch.json` before passing the configuration to the Go
extension and `dlv dap`. For example, `${workspaceFolder}` will be replaced with
the absolute path to the workspace root folder. When appropriate, the Go
extension will resolve relative paths or home directory (~) before sending the
configuration to `dlv dap`.
### Debug symlink directories
Since the debugger and go compiler use the actual filenames, extra configuration
is required to debug symlinked directories. Use the `substitutePath` property to
tell the `debugAdapter` how to properly translate the paths. For example, if
your project lives in `/path/to/actual/helloWorld`, but the project is open in
vscode under the linked folder `/link/to/helloWorld`, you can add the following
to your config to set breakpoints in the files in `/link/to/helloWorld`:
```json
{
"name": "Launch with symlinks",
"type": "go",
"request": "launch",
"mode": "debug",
"program": "/path/to/actual/helloWorld",
"substitutePath": [
{
"from": "/link/to/helloWorld",
"to": "/path/to/actual/helloWorld"
}
]
}
```
### Settings
You can adjust the default value of the following configuration properties using
`go.delveConfig` settings. These default values are useful when you choose to
run a debug session without the launch configuration set in `launch.json`. For
example, debug sessions started using the `Debug Test` code lenses use the
adjusted values from these settings.
* [`go.delveConfig`](settings.md#go.delveConfig)
* `debugAdapter`: Controls which debug adapter to use (default: `legacy`).
Select ‘dlv-dap’.
* `showGlobalVariables`: Show global variables in the Debug view (default:
`false`).
* `substitutePath`: Path mappings to apply to get from a path in the editor to
a path in the compiled program (default: `[]`).
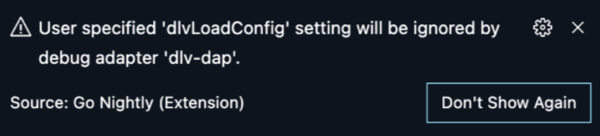
⚠️ Where is the `dlvLoadConfig` setting? Delve debugger imposes variable loading
limits to avoid loading too many variables at once and negatively impacting
debugging latency. The legacy adapter supported `dlvLoadConfig` to adjust these
limits for the duration of the session. The user therefore had to come up with a
one-size-fits-all limit if the default behavior was not satisfactory. `dlv-dap`
mode uses a different approach as described in
[the Data Inspection section](#data-inspection). If this setting is configured
and `dlv-dap` mode is used, the extension will show a warning prompt now. If the
current variable loading behavior and internal limits are not working for you,
please [open an issue](https://github.com/golang/vscode-go/issues/new) and share
your feedback.
## Advanced topics
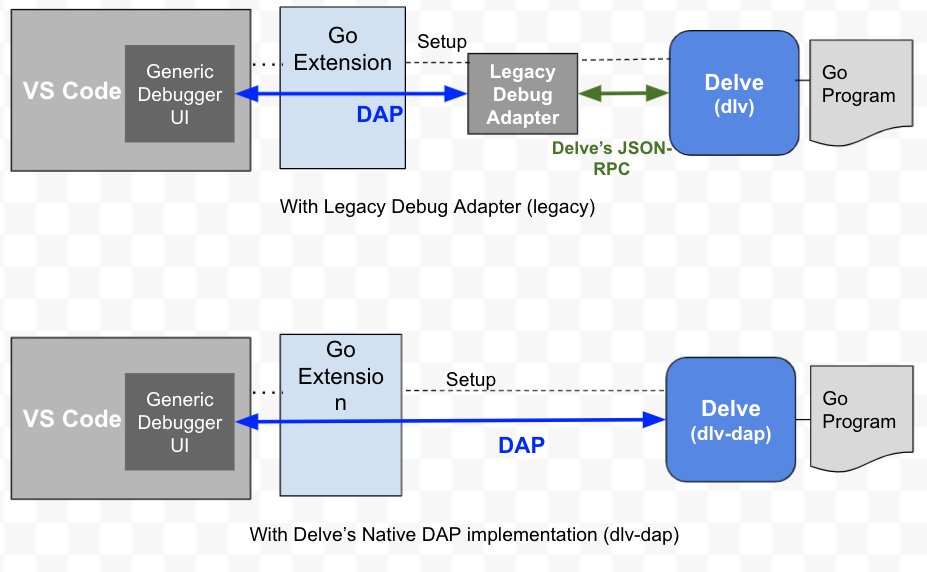
### Go debug extension architecture overview
VS Code implements a generic, language-agnostic debugger UI based on
[Debug Adapter Protocol](https://microsoft.github.io/debug-adapter-protocol/)
(DAP), an abstract protocol for communicating with debugger backend. Previously,
the Go extension used an intermediary typescript program (legacy debug adapter)
to launch Delve and adapt Delve to DAP. With
[the new, native DAP implementation in Delve](https://github.com/go-delve/delve/tree/master/service/dap),
the intermediary program is no longer necessary, and efficient and tight
integration with Delve becomes possible.
For information on debugging using the legacy debug adapter, please see the old
[Debugging Documentation](debugging.md). Note that many new or enhanced features
discussed in this document may not be available with the legacy debug adapter.
### Handling STDIN
The Go extension and `dlv` started as a subprocess of the extension do not have
access to `tty`. The Go extension captures and forwards STDOUT/STDERR of the
debug program to VS Code, so they can appear in `DEBUG OUTPUT` panel. But this
arrangement does not handle STDIN.
When the target program needs to read from STDIN or access terminals (`tty`),
use the `"console"` launch option that controls where the `dlv` debugger and the
target process run:
* `integratedTerminal` for the terminal inside VS Code
* `externalTerminal` for the terminal outside VS Code
The Go extension delegates interaction with terminals to VS Code
[using Debug Adapter Protocol's `RunInTerminal` functionality](https://github.com/golang/vscode-go/discussions/1626).
For configuring VS Code's terminal related behavior, see VS Code's
[documentation](https://code.visualstudio.com/docs/editor/integrated-terminal).
### Debug programs and tests as root
In order to run and debug a program or a package test running as root, the
debugger (`dlv`) must run with root privilege, too. You can start the debug
session with root privilege utilizing the `"asRoot"` AND `"console"` launch
options. This is currently supported only on Linux and Mac.
When `asRoot` is true, the Go extension will use the `sudo` command to run
`dlv`. Since `sudo` may ask you to enter password, the debug session needs
[terminal access](#handling-stdin) so set `"console": "integratedTerminal"` or
`"console": "externalTerminal"` in the launch configuration.
#### Debug a program as root
For example, the following launch configuration will start `myprogram` and debug
it by running `sudo dlv dap` command in the integrated terminal.
```json
{
"name": "Launch as Root",
"request": "launch",
"mode": "exec",
"asRoot": true,
"program": "${workspaceRoot}/myprogram",
"console": "integratedTerminal",
...
}
```
The `asRoot` setting can be used with `auto`/`test`/`debug` launch modes that
**build** the target binary to debug. That means the `go` command will be
invoked as root to compile the binary, too. This can cause issues:
* by default, `sudo` does not preserve the user's current environment variables
(see documentations about sudo's `--preserve-env` option). For example, `PATH`
or library paths required for build may be different.
* Go environment variable settings usually associated in the home directory are
different.
* Module/build caches used during build as root may be different from the caches
used in your normal build. If they are the same, you may encounter permission
errors due to cache data written to the caches as root.
Instead, you can arrange the `exec` launch mode to work with a pre-launch
[task](https://code.visualstudio.com/docs/editor/tasks).
First, configure a debug build task to compile the target binary.
In `.vscode/tasks.json`:
```json
{
...
"tasks": [
{
"label": "go: build (debug)",
"type": "shell",
"command": "go",
"args": [
"build",
"-gcflags=all=-N -l",
"-o",
"${fileDirname}/__debug_bin"
],
"options": {
"cwd": "${fileDirname}"
},
...
}
]
}
```
The `-gcflags=all=-N -l` flag tells the `go build` command to preserve the debug
information. The `-o` flag causes the compiled binary to be placed in
`"${fileDirname}/__debug_bin"`. Extra build flags and environment variables
_used for build_ should be configured here as `args` or `options`'s `env`
settings.
It might be useful to add `__debug_bin` to your `.gitignore` to avoid debugging
binaries getting checked-in into your repository.
Then, configure the launch config to run the task before starting debugging.
In `.vscode/launch.json`:
```json
...
"configurations": [
{
"name": "Launch Package as root",
"type": "go",
"request": "launch",
"mode": "exec",
"asRoot": true,
"console": "integratedTerminal",
"program": "${fileDirname}/__debug_bin",
"preLaunchTask": "go: build (debug)",
}
]
```
Settings (`args`, `cwd`, `env`, ...) configured in the above `launch.json` will
only apply when _running_ the compiled binary, not when building the binary.
#### Debug a package test as root
To debug package tests as root add the following launch and task configurations.
In `.vscode/tasks.json`:
```json
...
"tasks": [
{
...
},
{
"label": "go test (debug)",
"type": "shell",
"command": "go",
"args": [
"test",
"-c",
"-o",
"${fileDirname}/__debug_bin"
],
"options": {
"cwd": "${fileDirname}",
},
...
}
]
```
In `.vscode/launch.json`:
```json
...
"configurations": [
{
...
},
{
"name": "Debug Package Test as root",
"type": "go",
"request": "launch",
"mode": "exec",
"asRoot": true,
"program": "${fileDirname}/__debug_bin",
"cwd": "${fileDirname}",
"console": "integratedTerminal",
"preLaunchTask": "go test (debug)"
}
]
```
### Manually install `dlv`
On rare occasions, you may want to install `dlv` by yourself instead of letting
the extension handle its installation.
First, find where the Go extension finds tools. Like
[other tools the extension uses](tools.md#tools), the Go extension searches the
`dlv` executable from `${GOPATH}/bin`, `${GOBIN}` and `${PATH}` (or `Path` in
Windows). So, install `dlv` in the directory. The easiest way to check the tool
installation location the Go extension uses is currently by running the
`Go: Locate Configured Go Tools` command from the command palette (⇧+⌘+P or
Ctrl+Shift+P).
If your Go version is 1.16 or newer:
```
GOBIN= go install github.com/go-delve/delve/cmd/dlv@latest
```
If your Go version is older than 1.16:
```
cd $(mktemp -d)
GO111MODULE=on GOBIN= go get github.com/go-delve/delve/cmd/dlv@latest
```
You can choose to install a different version of `dlv` by specifying a specific
commit hash, a branch name (e.g. `master`), or a released version instead of
`latest`. For more details about manual installation, see
[Delve's documentation](https://github.com/go-delve/delve/tree/master/Documentation/installation).
If you want to explicitly specify the location of the delve binary, use the
`go.alternateTools` setting:
```json5
"go.alternateTools": {
"dlv": ""
}
```
### Remote debugging
> If you are able to use the
> [Remote Development](https://aka.ms/vscode-remote/download/extension)
> extensions and VS Code’s universal
> [remote development capabilities](https://code.visualstudio.com/docs/remote/remote-overview),
> that is the recommended way to debug Go programs remotely. Check out
> [Getting started](https://code.visualstudio.com/docs/remote/remote-overview#_getting-started)
> section and
> [Remote tutorials](https://code.visualstudio.com/docs/remote/remote-overview#_remote-tutorials)
> to learn more.
Remote debugging is the debug mode commonly used to work with a debugger and
target running on a remote machine or a container. In spite of its name, it can
also be used on a local machine with server started in an external terminal
(e.g. to support entering stdin into the server's terminal window).
With the introduction of `dlv dap` users now have two options for remote (i.e.
external) debugging.
#### Connect to headless delve with target specified at server start-up
In this mode the user must first manually start a
[`dlv --headless`](https://github.com/go-delve/delve/tree/master/Documentation/api)
server listening at `host:port` while specifying the target program to
debug/test/exec or a process to attach to on the command-line. A
[remote attach](#attach) configuration is then used to connect to the debugger
with a running target.
The
[headless dlv server](https://github.com/go-delve/delve/tree/master/Documentation/api)
can now be used with both `"debugAdapter": "legacy"` (default value) and
`"debugAdapter": "dlv-dap"` (with Delve v1.7.3 or newer) as well as Delve's
[command-line interface](https://github.com/go-delve/delve/tree/master/Documentation/cli)
via `dlv connect`. The `--accept-multiclient` flag makes this a multi-use server
that persists on `Disconnect` from a client and allows repeated connections from
any of the aforementioned clients. A combination of
`--accept-multiclient --continue` flags can be used to resume process execution
on start-up. Please see `dlv --help` and `dlv [command] --help` for dlv's
command-line options.
We encourage you to give the newly added `"debugAdapter": "dlv-dap"` support a
try and to
[let us know of any issues](https://github.com/golang/vscode-go/issues/new). If
you need to use the `legacy` mode, please also see the
[legacy remote debugging](debugging-legacy.md#remote-debugging) documentation.
For example, start external headless server:
```
dlv debug /path/to/program/ --headless --listen=:12345 # also add as needed: --accept-multiclient --continue
```
Connect to it with a remote attach configuration in your `launch.json`:
```json5
{
"name": "Connect to external session",
"type": "go",
"debugAdapter": "dlv-dap", // `legacy` by default
"request": "attach",
"mode": "remote",
"port": 12345,
"host": "127.0.0.1", // can skip for localhost
"substitutePath": [
{ "from": "${workspaceFolder}", "to": "/path/to/remote/workspace" },
...
]
}
```
#### Connect to delve dap with target specified at client start-up
In this mode the user must first manually start a
[`dlv dap` server](https://github.com/go-delve/delve/blob/master/Documentation/usage/dlv_dap.md)
listening at `host:port` and then specify the target program via
[launch](#launch) or [attach](#attach) client config with a `"port"` attribute.
Instead of starting a new local server, the Go extension will tell VS Code to
connect to the server specified by `host:port` attributes and then send a
request with the target to debug. This option provides the flexibility of easily
adapting local configurations to connect to external servers, but ⚠️ must be
used with care since anyone who can connect to the server can make it run
arbitrary programs.
When using `launch` mode, the `program` attribute must point to the absolute
path of the package or binary to debug in the remote host’s file system even
when `substitutePath` is specified. When using `attach` mode outside of local
host, you need to specify the `processId` in the config since
[the processId resolution feature](#attach) cannot gather information about
processes running remotely.
Start a `dlv dap` server ready to accept a client request to launch or attach to
a target process:
```
dlv dap --listen=:12345
```
Use the following `launch` configuration to tell `dlv` to execute a binary
precompiled with `go build -gcflags=all="-N -l"`:
```json5
{
"name": "Connect and launch",
"type": "go",
"debugAdapter": "dlv-dap", // the default
"request": "launch",
"port": 12345,
"host": "127.0.0.1", // can skip for localhost
"mode": "exec",
"program": "/absolute/path/to/remote/workspace/program/executable",
"substitutePath": [
{ "from": "${workspaceFolder}", "to": "/path/to/remote/workspace" },
...
]
}
```
Or have the binary compiled by `dlv dap` by modifying the above configuration to
use:
```json5
"mode": "debug",
"program": "/absolute/path/to/remote/workspace/package",
```
⚠️ Limitations
* Unlike `dlv --headless` above, `dlv dap` does not support
`--accept-multiclient` or `--continue` flags, which means after a debug
session ends, the `dlv dap` process will always exit.
* If you use `debug` or `test` mode `launch` requests, Delve builds the target
binary. Delve tries to build the target from the directory where the `dlv`
process is running, so make sure to run the `dlv` command from the directory
you would run the `go build` or `go test` command.
### Run debugee externally
Sometimes you might like to launch the program for debugging outside of VS Code
(e.g. as a workaround of the missing `console` support to enter stdin via an
external terminal or separate target's output from debug session logging). There
are currently two options:
* Compile and run the target program from the external terminal and use
[the "attach" configuration](#attach).
* Run the debug server from the external terminal with `--listen=:` and
have VS Code connect to it using `port` in your launch configuration (see
["Remote Debugging"](#remote-debugging) for more details)
## Troubleshooting
The suggestions below are intended to help you troubleshoot any problems you
encounter. If you are unable to resolve the issue, please take a look at the
[current known debugging issues](https://github.com/golang/vscode-go/issues?q=is%3Aissue+is%3Aopen+label%3ADebug)
or [report a new issue](#reporting-issues).
1. Read documentation and [FAQs](#faqs). Also check the
[Delve FAQ](https://github.com/go-delve/delve/blob/master/Documentation/faq.md)
in case the problem is mentioned there.
1. Check your `launch.json` configuration. Often error messages appearing in the
DEBUG CONSOLE panel reveal issues.
1. Update Delve (`dlv`) to pick up most recent bug fixes. Follow
[the instruction](debugging.md#staying-up-to-date).
1. Check if you can reproduce the issue with `dlv`, the command line tool from
the integrated terminal. If it's reproducible when
using `dlv`, take a look at the
[Delve project issue tracker](https://github.com/go-delve/delve/issues).
1. Capture [logs](debugging.md#collecting-logs) and inspect them.
1. Look at the
[existing debugging issues](https://github.com/golang/vscode-go/labels/Debug)
if similar issues were reported.
1. If none of these solve your problem, please
[open a new issue](#reporting-issues).
## FAQs
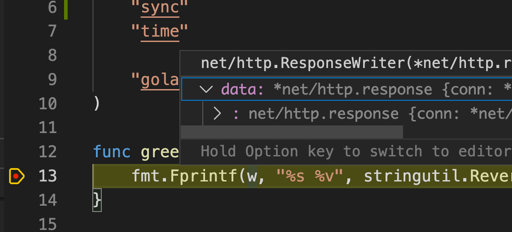
### I need to view large strings. How can I do that if `dlvLoadConfig` with `maxStringLen` is deprecated?
The legacy adapter used `dlvLoadConfig` as one-time session-wide setting to
override dlv's conservative default variable loading limits, intended to protect
tool's performance. The new debug adapter is taking a different approach with
on-demand loading of composite data and updated string limits, relaxed when
interacting with individual strings. In particular, if the new default limit of
512, applied to all string values in the variables pane, is not sufficient, you
can take advantage of a larger limit of 4096 with one of the following:
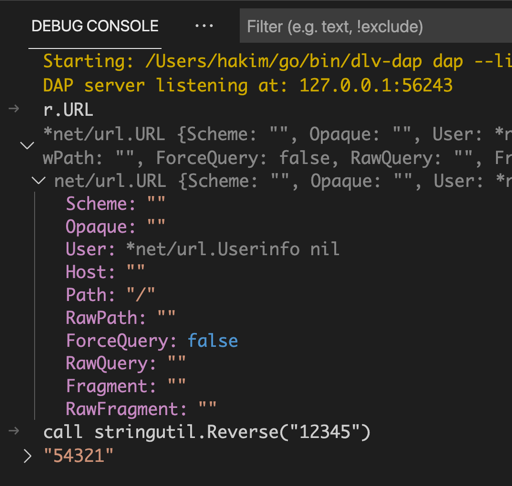
* Hover over the variable in the source code
* `Copy as Expression` to query the string via REPL in the DEBUG CONSOLE panel
* `Copy Value` to clipboard
Please [open an issue](https://github.com/golang/vscode-go/issues/new) if this
is not sufficient for your use case or if you have any additional feedback.
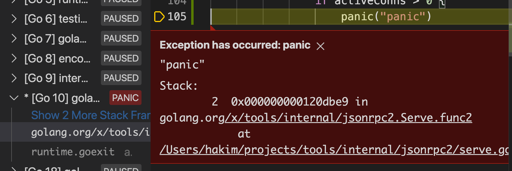
### Why does my debug session have an `invalid command` error when I try to step?
When stepping through a program on a particular goroutine, the debugger will
make sure that the step is completed, even when interrupted by events on a
different goroutine. If a breakpoint is hit on a different goroutine, the debug
adapter will stop the program execution to allow you to inspect the state, even
though the step request is still active.
If you attempt to make another step request you will get an `invalid command`
error.
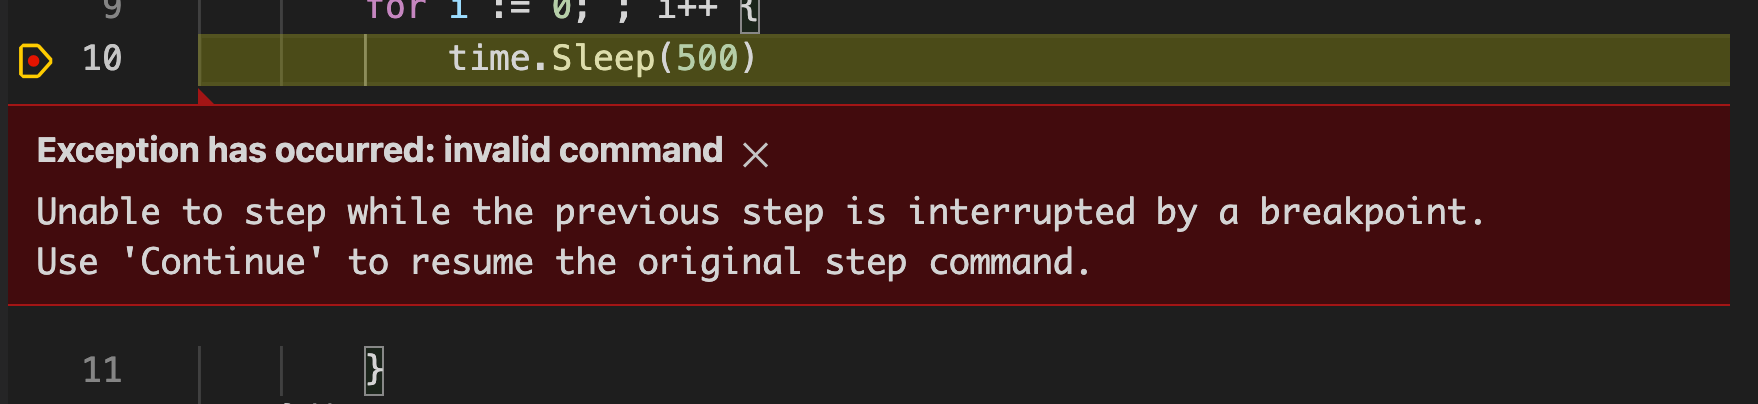
Use `Continue` to resume program execution.
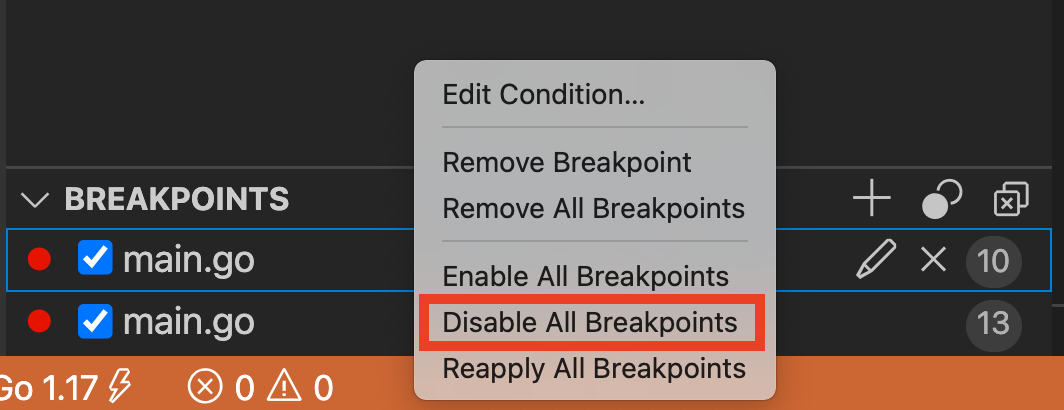
If you do not want the step request to be interrupted, you can disable all
breakpoints from VS Code from the context menu in the `Breakpoints` view.
### My program does not stop at breakpoints
Check the "BREAKPOINTS" section in the debug view and see if the breakpoints are
[greyed out](https://code.visualstudio.com/docs/editor/debugging#_breakpoints)
when your debug session is active. Setting `stopOnEntry` is a great way to pause
execution at the start to _verify_ breakpoints are set correctly. Or
[enable logging](#collecting-logs) and see if `setBreakpoints` requests
succeeded with all the breakpoints _verified_.
This problem often occurs when the source location used in compiling the
debugged program and the workspace directory VS Code uses are different. Common
culprits are remote debugging where the program is built in the remote location,
use of symbolic links, or use of `-trimpath` build flags. In this case,
configure the `substitutePath` attribute in your launch configuration.
#### Trimpath tips
If you are using `-trimpath` to build your program, you need to add entries to substitute
path to let the debugger know how to map the package paths that are compiled in the
binary to the files that you are looking at in the editor.
Here are some tips for configuring substitutePath. This assumes that your program is using module mode, which is the default.
One rule that you will need will map your main module. The mapping will map `"from"` the file path to the directory containing the module, `"to"` the module path.
You will also need to create a similar mapping for all dependencies. These include modules
in the module cache, vendored modules, and the standard library.
```json
"substitutePath": [
// Main module.
{
"from": "${workspaceFolder}",
"to": "moduleName",
},
// Module cache paths.
{
"from": "${env:HOME}/go/pkg/mod/github.com",
"to": "github.com",
},
{
"from": "${env:HOME}/go/pkg/mod/golang.org",
"to": "golang.org",
},
...
// Standard library paths.
// This rule should come last since the empty "to" will match every path.
{ "from": "/path/to/local/goroot/pkg" , "to": ""}
],
```
Since rules are applied both from client to server and server to client,
rules with an empty string will be applied to _all_ paths that it sees, so even
dependencies will be mapped to `"/path/to/module"`.
We plan to make this easier in the future. Progress can be tracked
in the issue tracker [golang/vscode-go#1985](https://github.com/golang/vscode-go/issues/1985).
### Debug sessions started with the "debug test" CodeLens or the test UI does not use my `launch.json` configuration
The "debug test" CodeLens and the [test UI](features.md#test-and-benchmark) do
not use the `launch.json` configuration
([Issue 855](https://github.com/golang/vscode-go/issues/855)). As a workaround,
use the `go.delveConfig` setting and the `go.testFlags` setting. Please note
that these all apply to all debug sessions unless overwritten by a specific
`launch.json` configuration.
### Starting a debug session fails with
`decoding dwarf section info at offset 0x0: too short` or
`could not open debug info` error
These errors indicate that your binary was built with linker flags that stripped
the symbol table (`-s`) or the DWARF debug information (`-w`), making debugging
impossible. If the binary is built while launching the session, make sure your
`launch.json` configuration does not contain
`"buildFlags": "--ldflags '-s -w'"`. If you use `debug test` or Test Explorer,
check `go.buildFlags` in `settings.json`. If the binary is built externally,
check the command-line flags and do not use `go run`. Unlike `go build`,
`go run` passes `-s -w` to the linker under the hood. If you try to attach to
such a binary with a debugger, it will fail with one of the above errors (see Go
Issue [24833](https://github.com/golang/go/issues/24833)). Instead let dlv build
the binary for you or use `go build -gcflags=all="-N -l"`.
## Report issues
When you are having issues in `dlv-dap` mode, first check if the problems are
reproducible after updating `dlv` and using the most recent version of `dlv`.
It's possible that the problems are already fixed. You can also try to install
`dlv` at tree head. Follow the instruction for
[updating `dlv`](#staying-up-to-date) and
[updating extension](https://code.visualstudio.com/docs/editor/extension-gallery#\_extension-autoupdate).
Please report issues in
[our issue tracker](https://github.com/golang/vscode-go/issues) with the
following information.
* `go version`
* `go version -m `
* VS Code and VS Code Go version (e.g. `code --version`)
* Instructions to reproduce the issue (code snippets, your `launch.json`, screenshot)
* DAP trace (See [the instruction](#collecting-logs))
### Collect logs
```json5
{
"name": "Launch file",
"type": "go",
"trace": "verbose",
"showLog": true,
"logOutput": "dap",
...
}
```
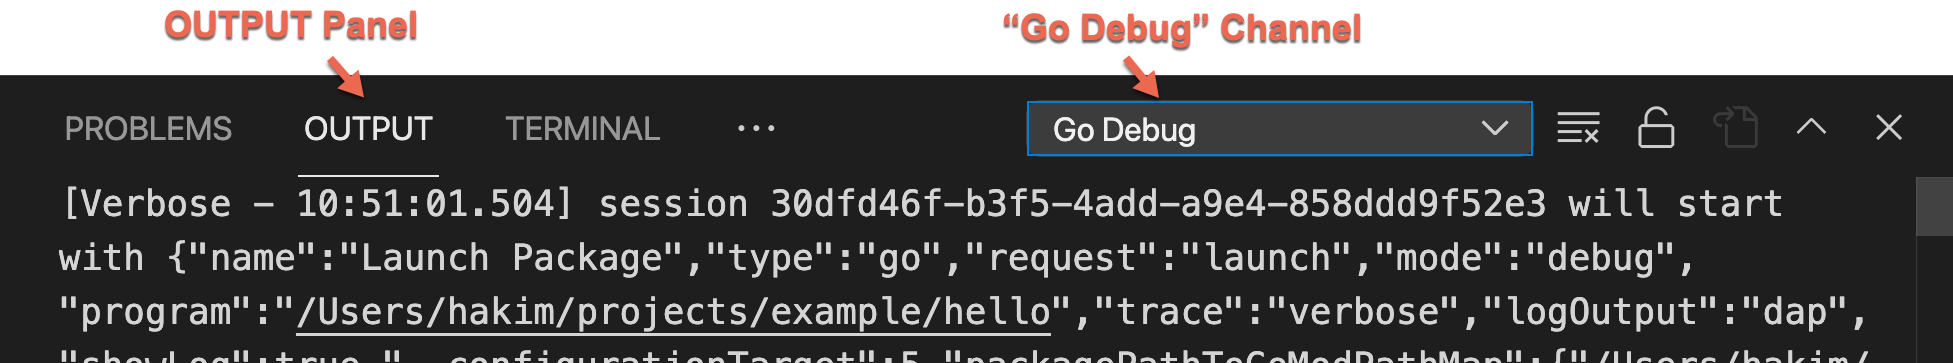
The `logOutput` and `showLog` attributes in `launch.json` enable Delve-side
logging (server-side) and DAP message tracing. The `trace` attribute controls
the verbosity of Go extension's side logging (client-side).
The logging will appear in the `Go Debug` output channel (Command Palette ->
"View: Toggle Output" -> Select "Go Debug" from the dropdown menu). By nature,
debug logs may contain sensitive information. Please review the logs carefully
before sharing debug logs.
## Development
### Code location
The core part of Delve DAP implementation is in the
[`service/dap`](https://github.com/go-delve/delve/tree/master/service/dap)
package. Follow Delve project's
[contribution guideline](https://github.com/go-delve/delve/blob/master/CONTRIBUTING.md#contributing-code)
to send PRs.
Code for integration with the Go extension is mostly in
[`src/goDebugFactory.ts`](https://github.com/golang/vscode-go/blob/master/extension/src/goDebugFactory.ts)
and tests are in
[`test/integration/goDebug.test.ts`](https://github.com/golang/vscode-go/blob/master/extension/test/integration/goDebug.test.ts).
Please take a look at VS Code Go project's
[contribution guideline](contributing.md) to learn about how to prepare a change
and send it for review.
### Testing
For simple launch cases, build the `dlv` binary, and configure
`"go.alternateTools"` setting.
```json5
"go.alternateTools": {
"dlv":
}
```
If you are having issues with seeing logs and/or
suspect problems in the extension's integration, you can start the Delve DAP
server from a separate terminal and configure the extension to directly connect
to it. Please remember to
[file an issue](https://github.com/golang/vscode-go/issues/new) if you encounter
any logging-related problems.
```
dlv dap --listen=:12345 --log --log-output=dap
```
```json5
{
"name": "Launch file",
"type": "go",
"request": "launch",
"debugAdapter": "dlv-dap",
...
"port": 12345
}
```