# dsh-cost-meter
**Session cost tracking plugin for the DeepSeek Harness web GUI (bilingual UI)**
Per-conversation cost · daily totals · OpenCode Go subscription quota display · budget with usage percentage · official account balance · history · peak/off-peak pricing hours display (peak hours UTC 01:00–04:00, 06:00–10:00) · one-click price sync from the official docs · Codex-style token usage heat grid
[](https://github.com/Han-1413141/dsh-cost-meter)
[](LICENSE)
[](https://github.com/deepseek-ai/deepseek-harness)
[](https://awesome-dsh-plugin.com)
[](https://whaleharness.com/audit-report.md)
English | [中文](README.md)
---

## Feature overview
| Feature | Location | Description |
|---|---|---|
| Per-conversation cost | Below the composer / session title bar | Live accumulated cost + input/cache/output tokens; position configurable |
| Official balance | Sidebar top / Settings page (configurable) | Total / granted / topped-up balance, auto-refresh + manual refresh |
| OpenCode Go quota | Sidebar / Settings / bottom-right dock (configurable) | Rolling-5h / weekly / monthly usage percent and reset times, each window toggleable independently, budget used % can show alongside; key auto-discovered (DSH credential store OPENCODE_GO_API_KEY / env / opencode login) or entered manually |
| Coding plan quotas | Settings page | Multi-vendor coding-plan quota queries (Anthropic Claude Pro/Max, Z.ai / Zhipu GLM Coding Plan, MiniMax Token Plan, Kimi/Moonshot balance, OpenRouter credits, SiliconFlow balance); per-vendor enable switch and key, credentials only sent to official endpoints; neutral hints when no credentials/subscription |
| Today's cost | Sidebar bottom (above the settings button) | “Today ¥x”, hover for call count and token details |
| Budget box | Sidebar bottom (between the balance row and the settings button) | Rounded-square frame: budget, used %, progress bar, today's cost & share of budget, used/limit; ≥80% warning, ≥100% over-budget |
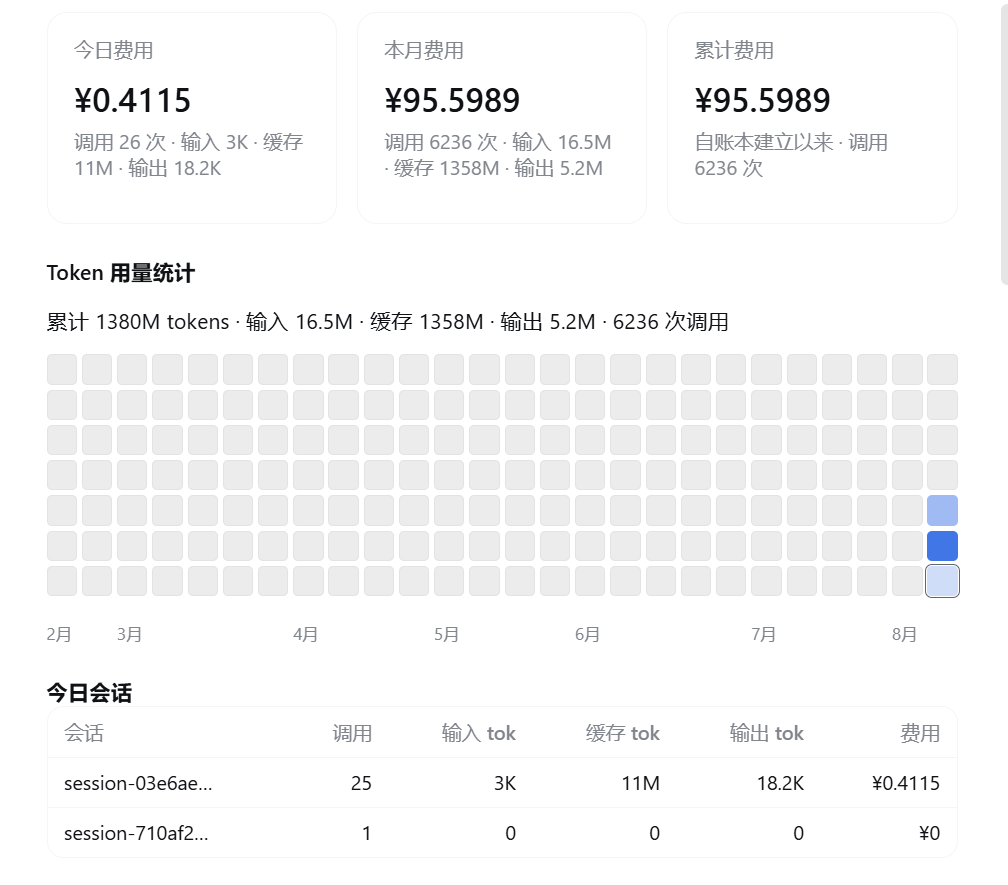
| Summary cards | Settings page | Today / this month / cumulative cost and call counts |
| Token usage stats | Settings page (Cost section) | All-time token totals (input/cache/output/calls) + a Codex-style 26-week daily usage heat grid that fills the settings width; hover a cell for that day's detail |
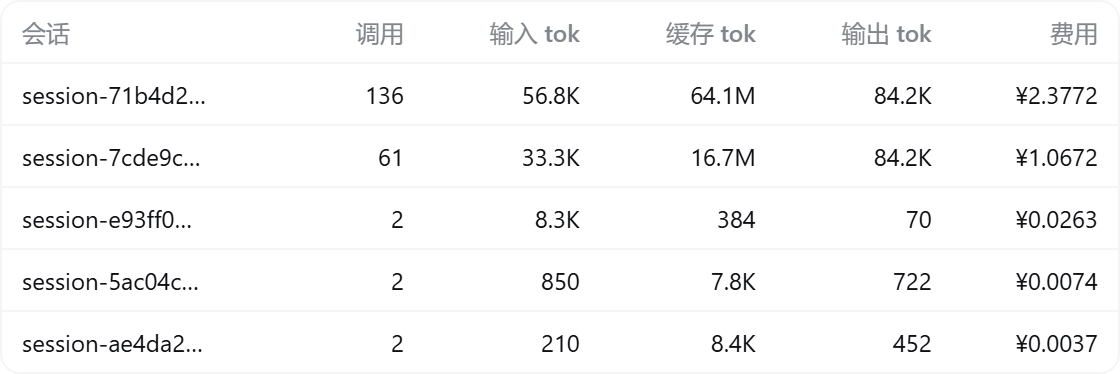
| Today's sessions | Settings page | Per-session call count, input/cache/output tokens and cost |
| History | Settings page | Per-day totals; retention days configurable (default 180) |
| Budget settings | Settings page, top | Limit, period (today / month / cumulative / custom date range), used % |
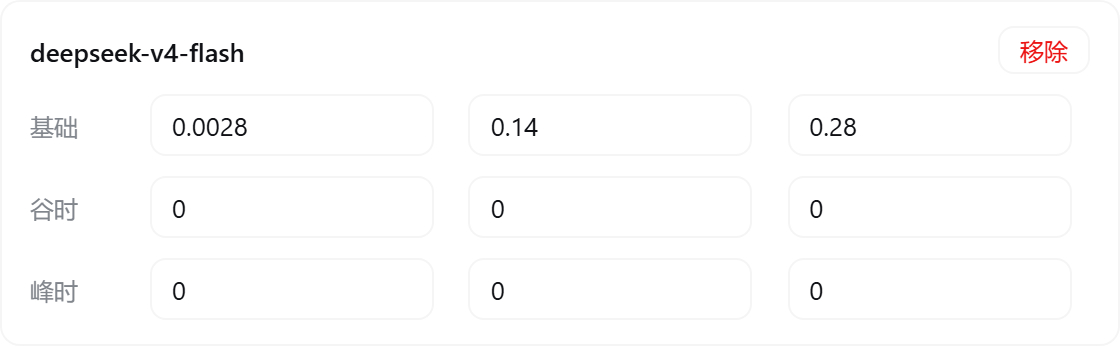
| Price table | Settings page | Per-model off-peak / peak prices (input/output shorthand supported; cache prices derived automatically); fully editable |
| Peak/off-peak hours display | Settings / budget / today | Shows UTC peak hours 01:00–04:00 and 06:00–10:00 with the current tier; expanded view shows a peak/off-peak period strip (current period + countdown), collapsed (rail) view shows a vertical peak/off-peak progress bar; independently toggleable |
| Official price sync | Settings page | Fetches and parses the official pricing page, applies with one click |
| UI language | Settings → Display settings | Simplified Chinese / English / Follow browser (auto); switches instantly and auto-saves |
| AI price sync | [prompt](docs/AI-PRICE-SYNC-PROMPT.en.md) | DeepSeek official sync; other providers use the verified official price catalog and manual configuration |
| Model & Plan adaptation guide | [adaptation doc](docs/model-and-plan-adaptation.en.md) | Adaptation matrix for per-model billing and the 6 Coding Plan vendors, the auto-matching mechanism and price sources ([中文](docs/model-and-plan-adaptation.md)) |
| Multi-provider billing | Settings / ledger | OpenAI, Anthropic, Google Gemini, Mistral and other providers with input/output, cache and reasoning-token pricing isolated by provider + model |
| Model-name auto-matching | Settings / ledger | Unknown model ids are matched against the price table: case/spaces/hyphens/dots and bracket annotations (e.g. (go)) are ignored — a normalized-equal or containing name hits (e.g. `gpt5.6 luna(go)`); router providers (opencode/zen etc.) search across all vendors; can be restricted to exact match, and unmatched models can be pinned to a specific entry in Settings |
| Extended price catalog | Settings → Extended price catalog | Built-in reference catalog grouped by vendor and model family (expandable; vendors collapsed by default); mount entries into billing with one click — mounted third-party models live inside the catalog and stay editable; a per-model “Show directly in Cost settings” toggle chooses which models (DeepSeek included) appear directly in the price table |
## Bilingual UI
The plugin UI (session badge, sidebar balance row & budget box, and the entire Settings page) supports **Simplified Chinese** and **English**:
- Language options: **Simplified Chinese** / **English** / **Follow browser (auto)**;
- Default is “Follow browser”: the browser language is auto-detected (`zh*` → Chinese, otherwise English), and the detected value is written back into the config so server-side messages (balance query, price sync, etc.) match the UI language;
- Switch it under **Settings → Cost → Display settings → Language** — the whole plugin UI updates instantly and auto-saves; the section label in the Settings sidebar switches too (费用 / Cost);
- Server-generated notices (balance refresh, official price sync, config validation errors, …) are also output in the current language.
## Screenshots & walkthrough
> All screenshots were captured on a live DeepSeek Harness instance. They show the Chinese UI by default; the plugin UI itself is bilingual (Simplified Chinese / English) — switch to English under Settings → Cost → Display settings → Language.
### Main page
**Sidebar bottom** (top to bottom: official balance → quota/budget box → settings button):
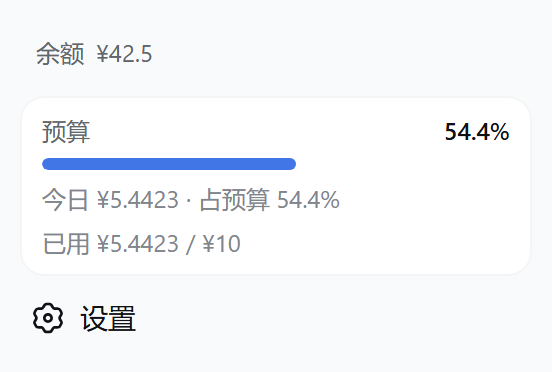
- The balance row shows the official open-platform total balance; hovering reveals the granted/topped-up split;
- With no budget enabled, that spot shows the “Today ¥x” badge.
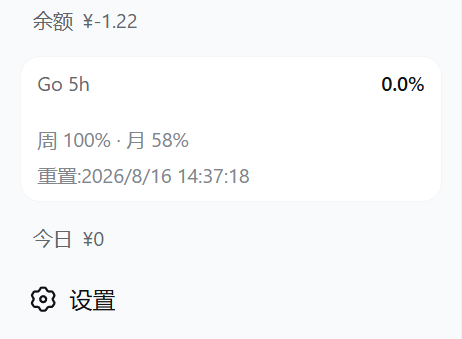
**Quota / budget box — three states** (OpenCode Go quota and the budget each toggle independently in the same rounded style; with both on they **merge into one card** — Go on top, budget below, thin divider, each keeps its own warning colors; the “box details” toggle collapses secondary rows to just label + used % + progress bar):
| Go quota only | Budget only | Merged |
|---|---|---|
|  | 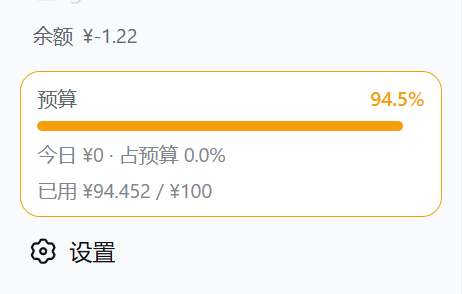 | 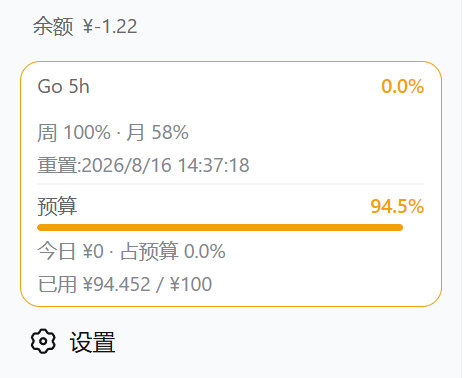 |
- The budget box shows “budget · used % · progress bar · today's cost & share of budget · used/limit”; ≥80% warning, ≥100% over-budget; rail mode narrows to a percentage tile;
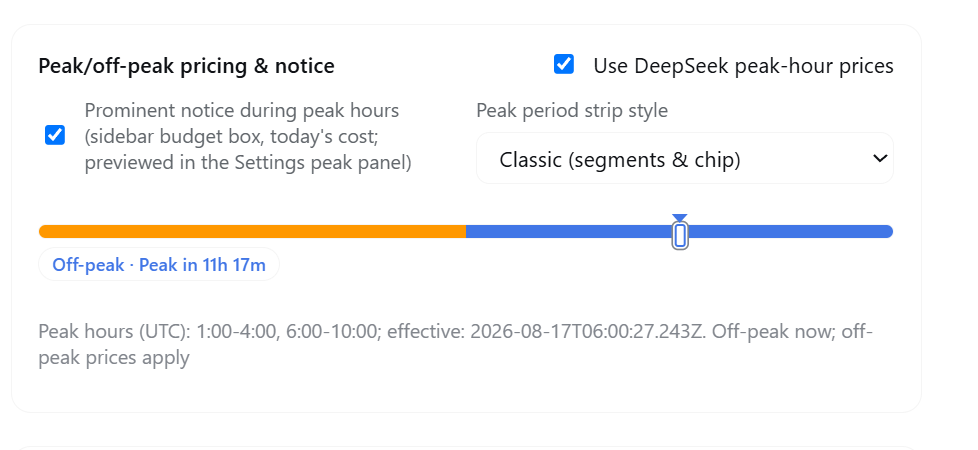
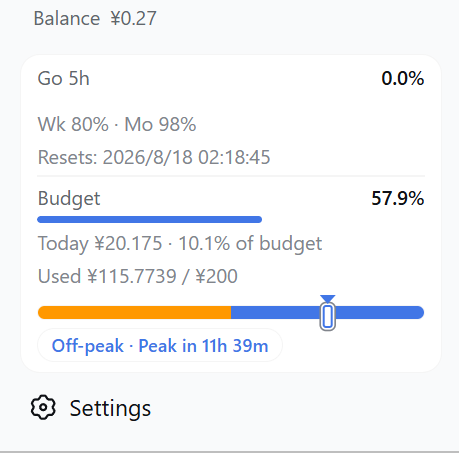
- The peak/off-peak hours display shows UTC peak hours 01:00–04:00 and 06:00–10:00 with the current tier; the budget box and today's cost area show a compact one-line period strip — a thin orange/blue track with a marker line on the current period, and text on the right showing the current period plus the countdown to the next switch (refreshed every 30 seconds); no prices are shown; it can be disabled independently in Settings, and the “Peak period strip style” option switches between the Compact and Classic looks; collapsed rail mode shows the same design vertically with a short horizontal label (“Peak / Off-peak”) below — the countdown and full text appear on hover;
**Peak/off-peak period strip & collapsed vertical progress bar**:
| Settings peak panel (notice toggle / style switch / preview) | Settings bottom-right (dock) display & box details |
|---|---|
|  |  |
Real captures from an actual DSH sidebar of the period strip and collapsed vertical bar (current looks), grouped by UI type (shown during peak hours):
**Expanded** — the budget box / today's cost area shows a one-line period strip:
| Compact | Classic |
|---|---|
| 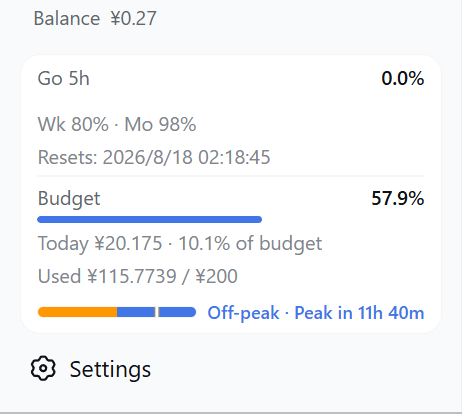 |  |
- Compact: thin orange/blue track with a marker line on the current period and a short caption, e.g. “Peak · Off-peak in 1h 40m”;
- Classic: same track and marker line with the full caption “Peak · Off-peak in HH:MM:SS” countdown (refreshed every 30 seconds); no prices are shown.
**Collapsed (rail)** — a vertical period bar stacked at the sidebar bottom, centered with the percentage squares:
| Compact | Classic |
|---|---|
|  |  |
- Compact: only the short horizontal label (“Peak / Off-peak”) below the vertical bar;
- Classic: the full caption stacked vertically below the bar, including the countdown to the next switch; in both styles the full text is also available on hover.
- The display follows the `peakNotice` / `peakEnabled` / `peakEffectiveAt` / `peakWindows` gates and uses the configured UTC peak windows;
- Settings → Cost → Peak/off-peak pricing includes an independent “Prominent notice during peak hours” toggle; turning it off hides both the expanded strip and the collapsed vertical bar;
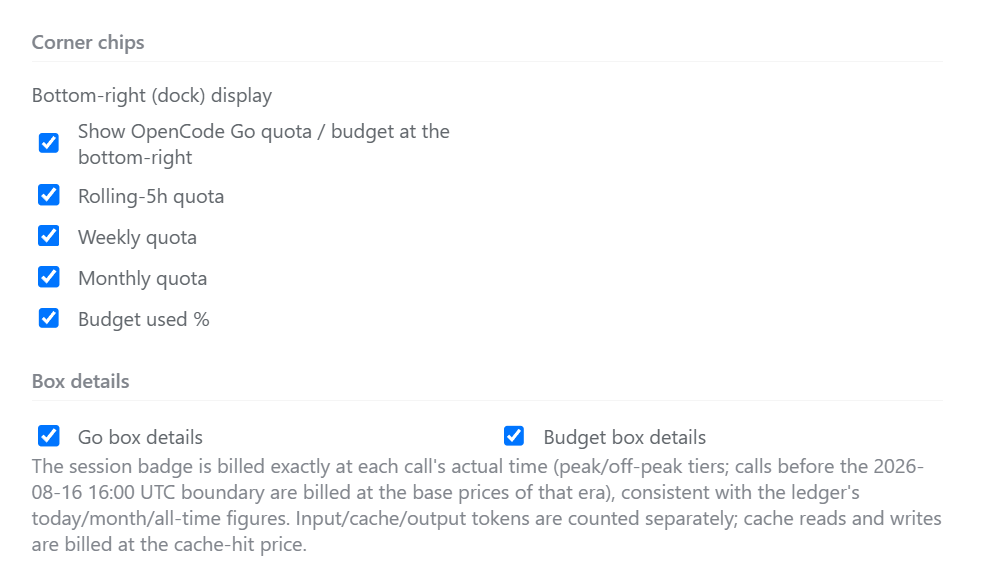
- The first image above is the Settings peak panel (notice toggle, style switch and live preview); see the grouped captures for the strip and collapsed vertical bar; the dock toggles and box-details switches are shown in the second image.
- The Go box shows the main window's used % and progress bar (default rolling 5h; switchable to weekly/monthly in Display settings), with the other two windows and reset times in a row below:
**Bottom-right (dock) quota / budget chips** (enabled in Display settings; four independent toggles: 5h / weekly / monthly quota + budget used %):
| Corner chips in action | Display settings (where the toggles live) |
|---|---|
|  |  |
**Per-conversation cost** (two positions, switchable in Settings):
| Below the composer | Session title bar |
|---|---|
|  |  |
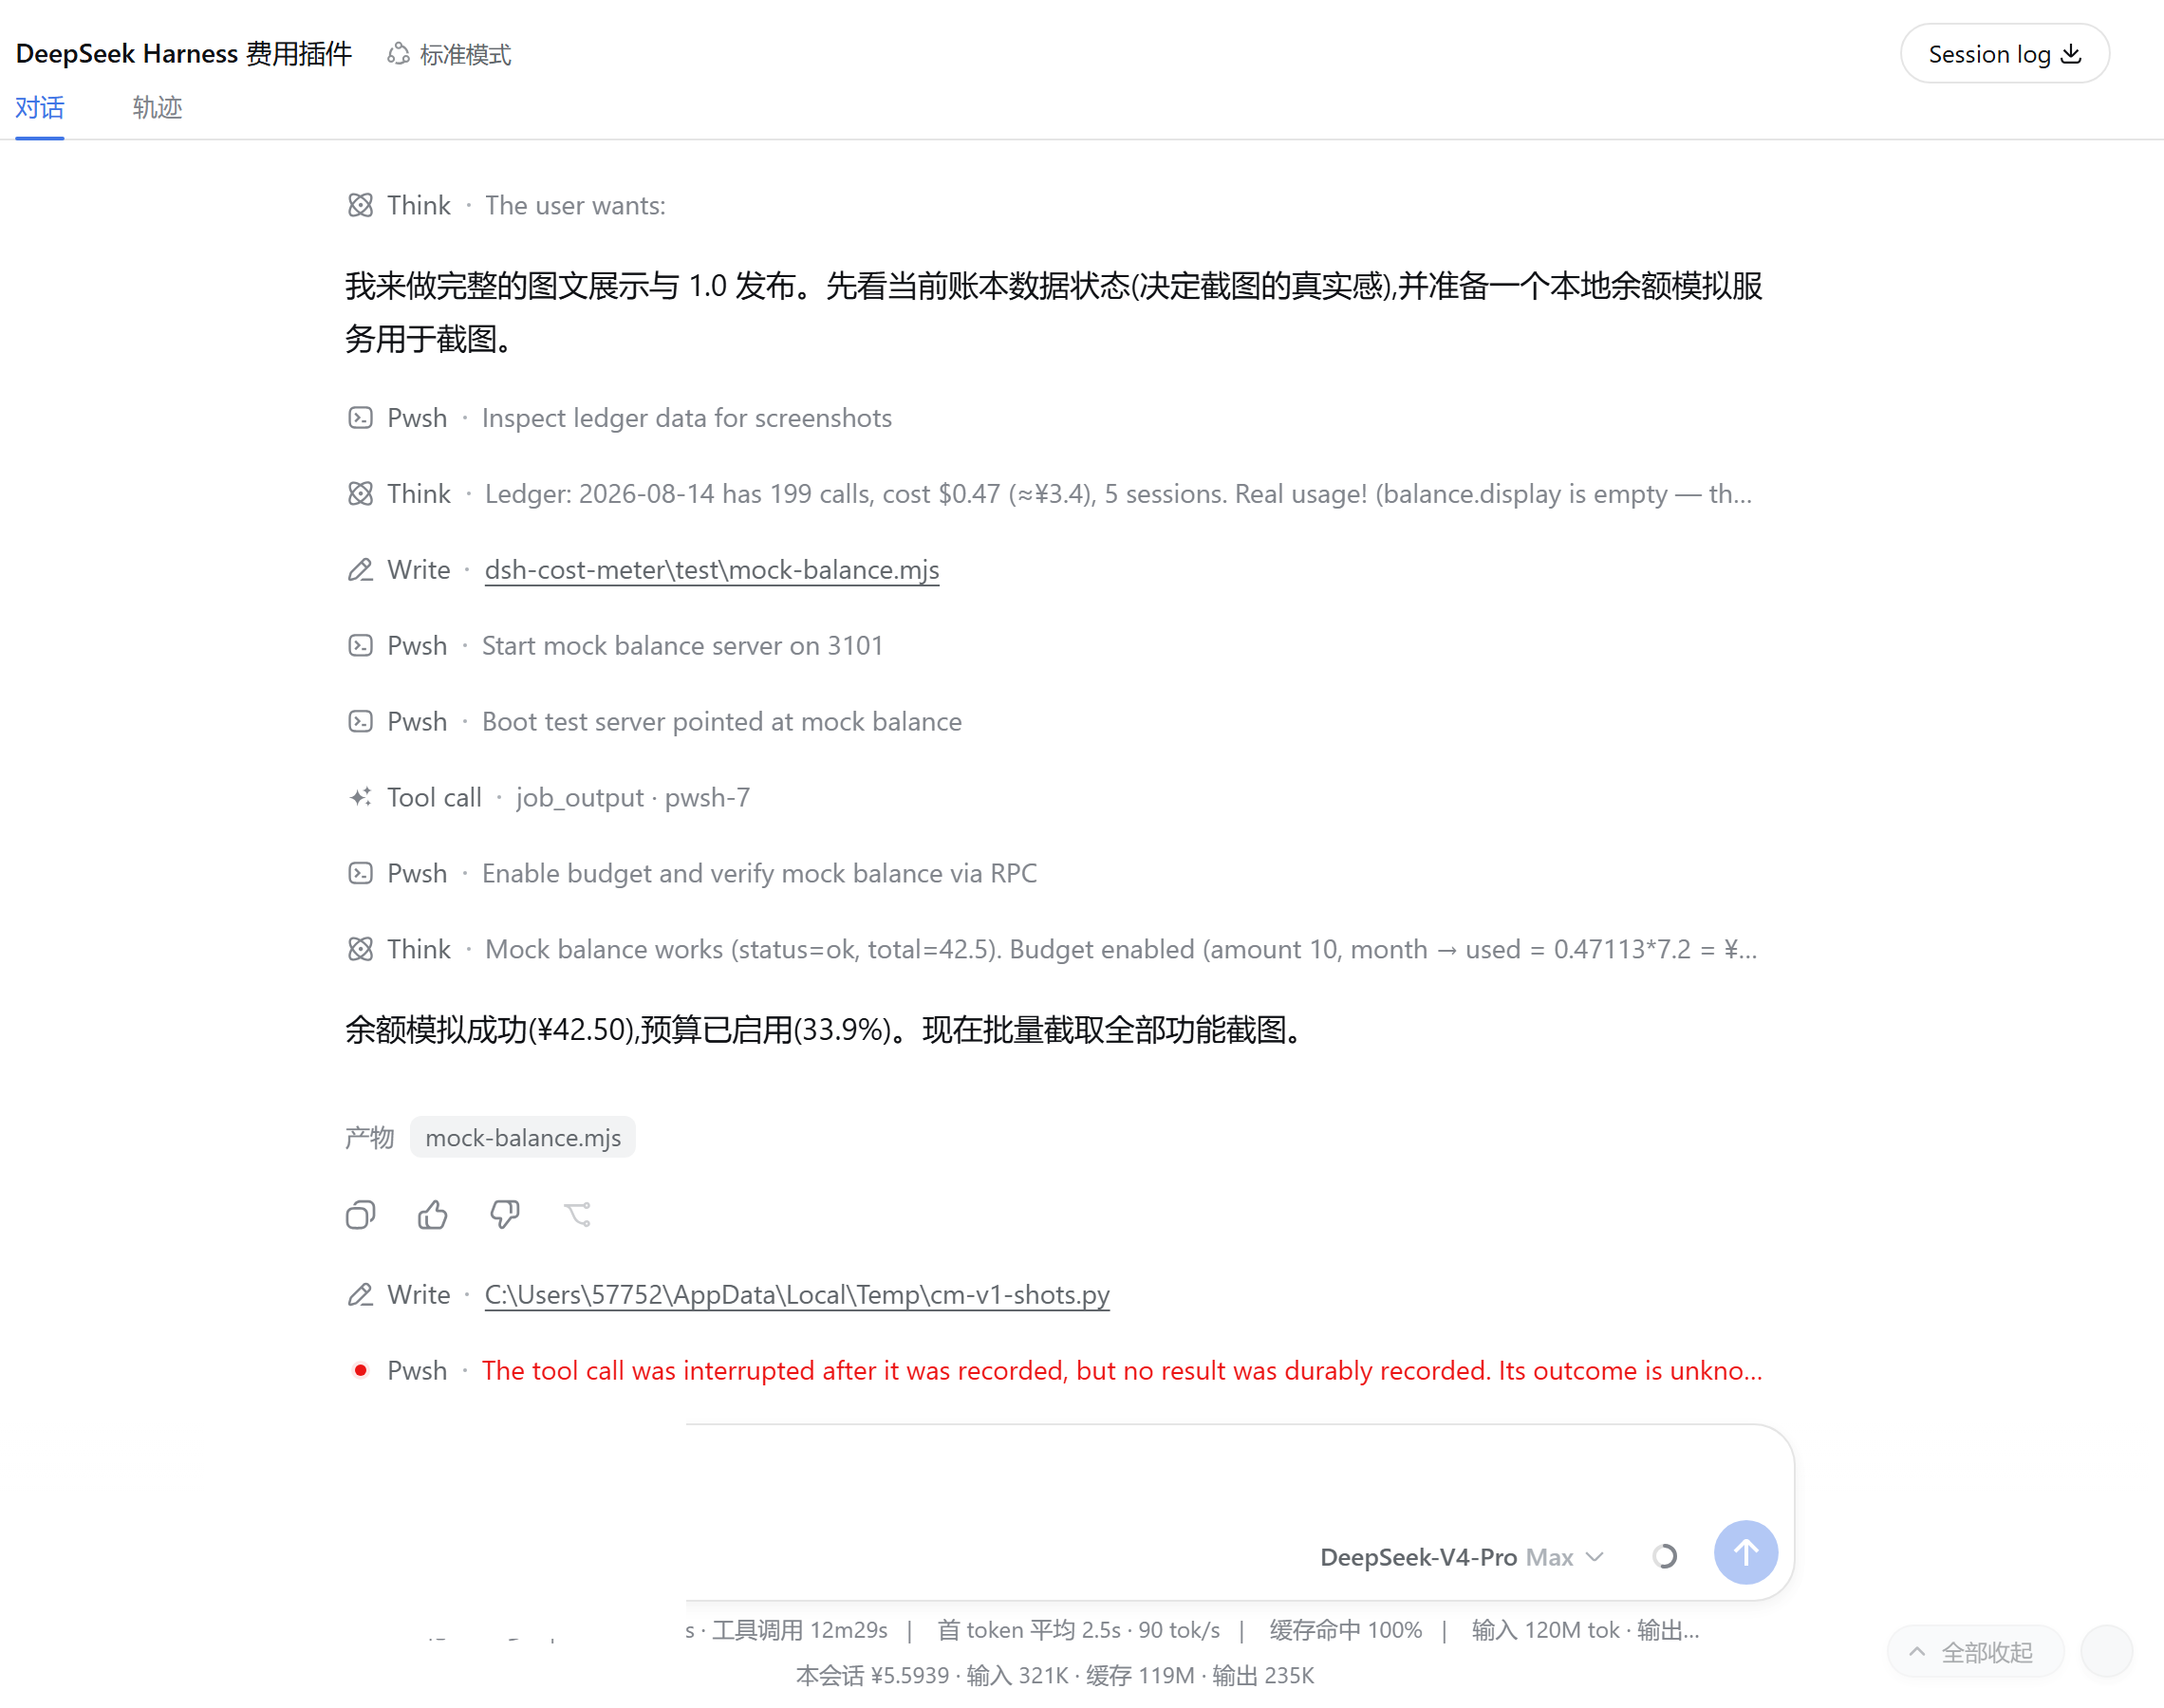
> Left: this session ¥5.5939 · input 321K · cache 119M · output 235K; right: title-bar badge “cost ¥6.1606” (real session captures)
### Settings → Cost
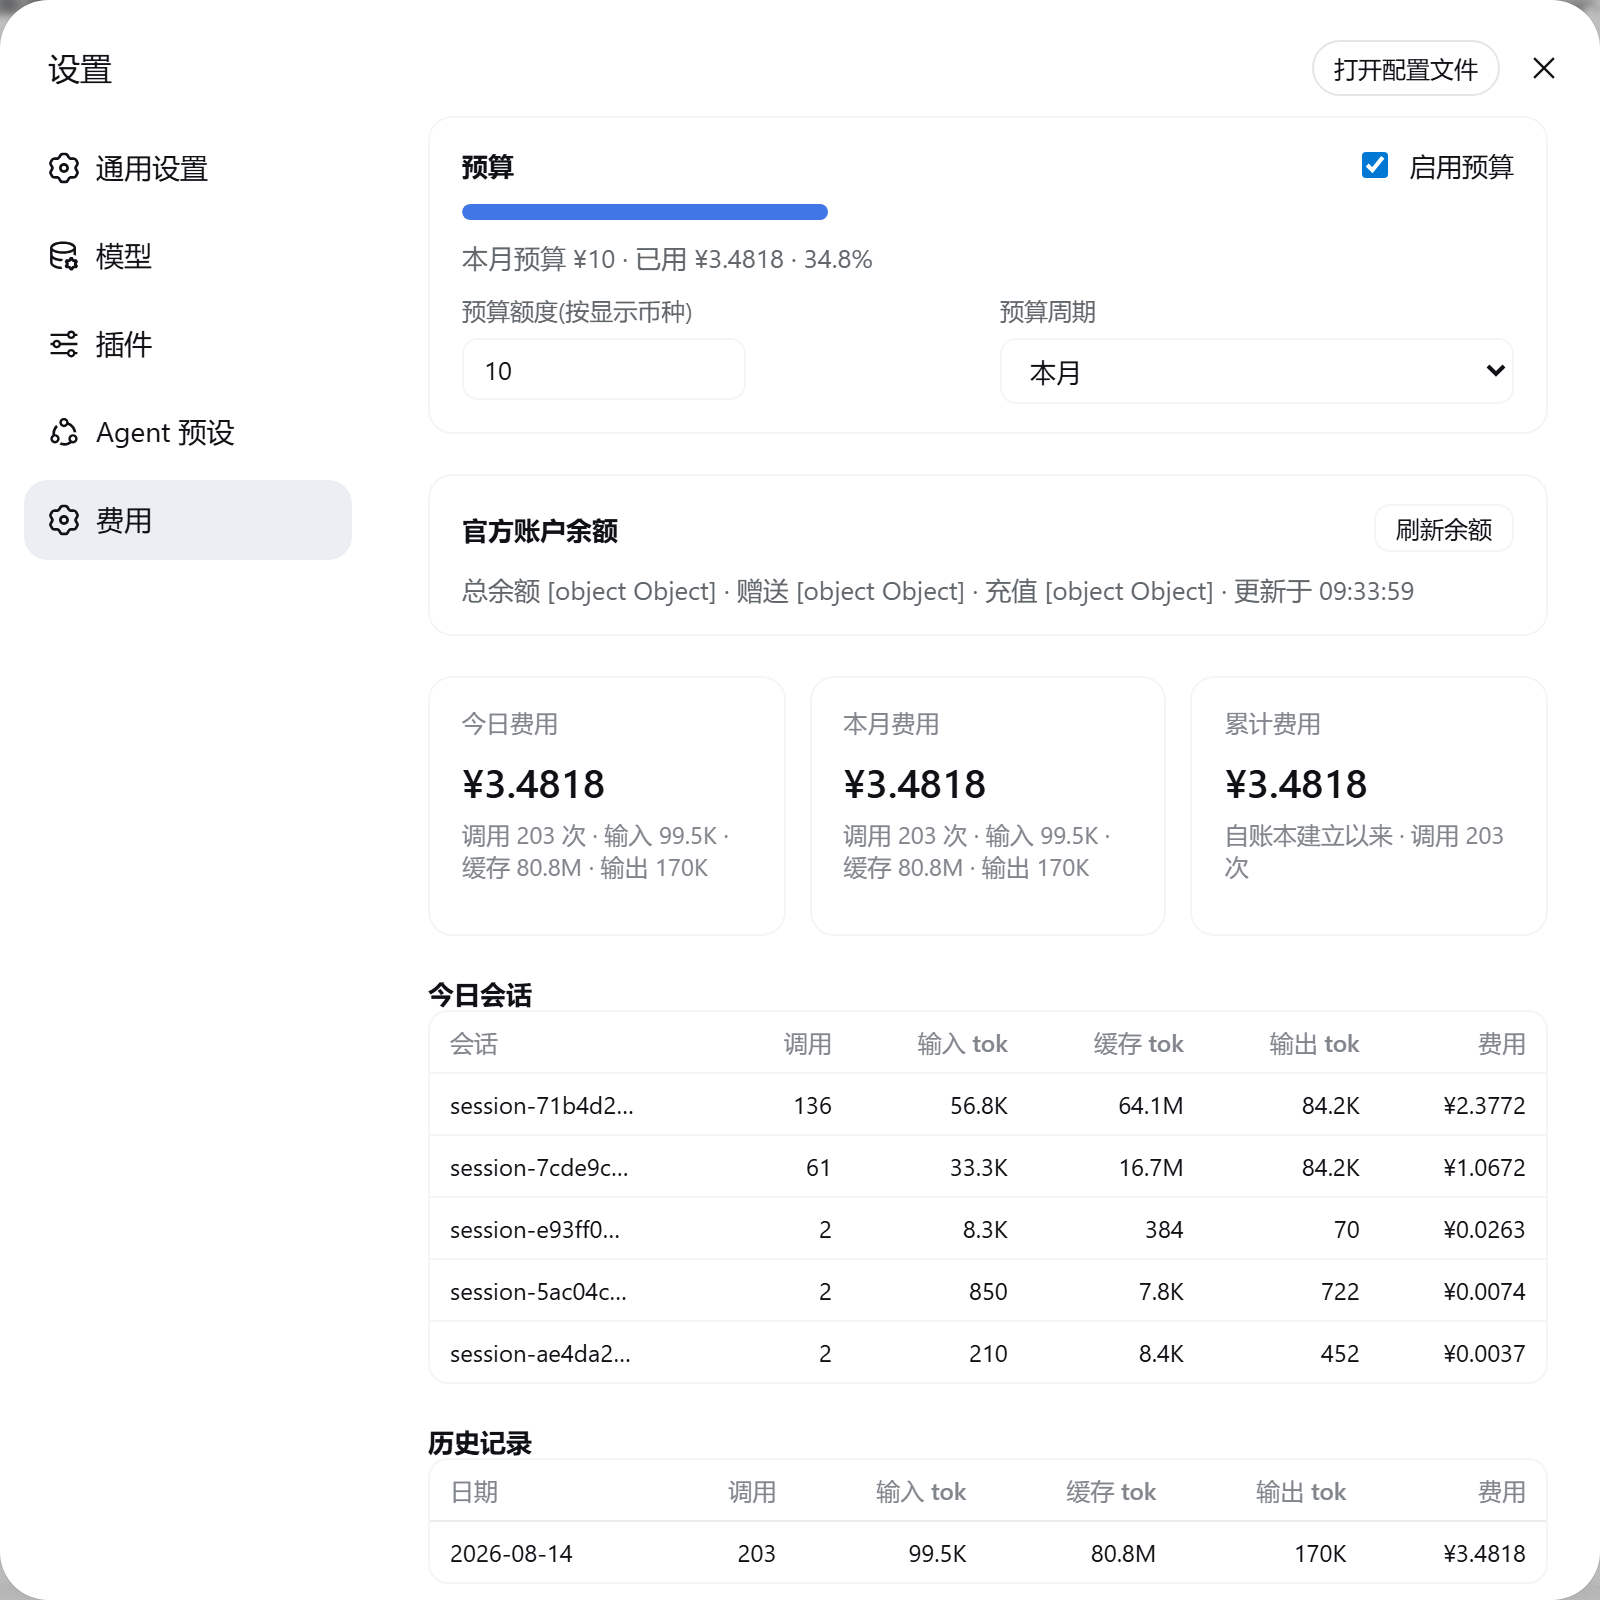
**Overview** (OpenCode Go quota → budget → balance → summary cards → today's sessions → history → display settings → price table → data & sync):
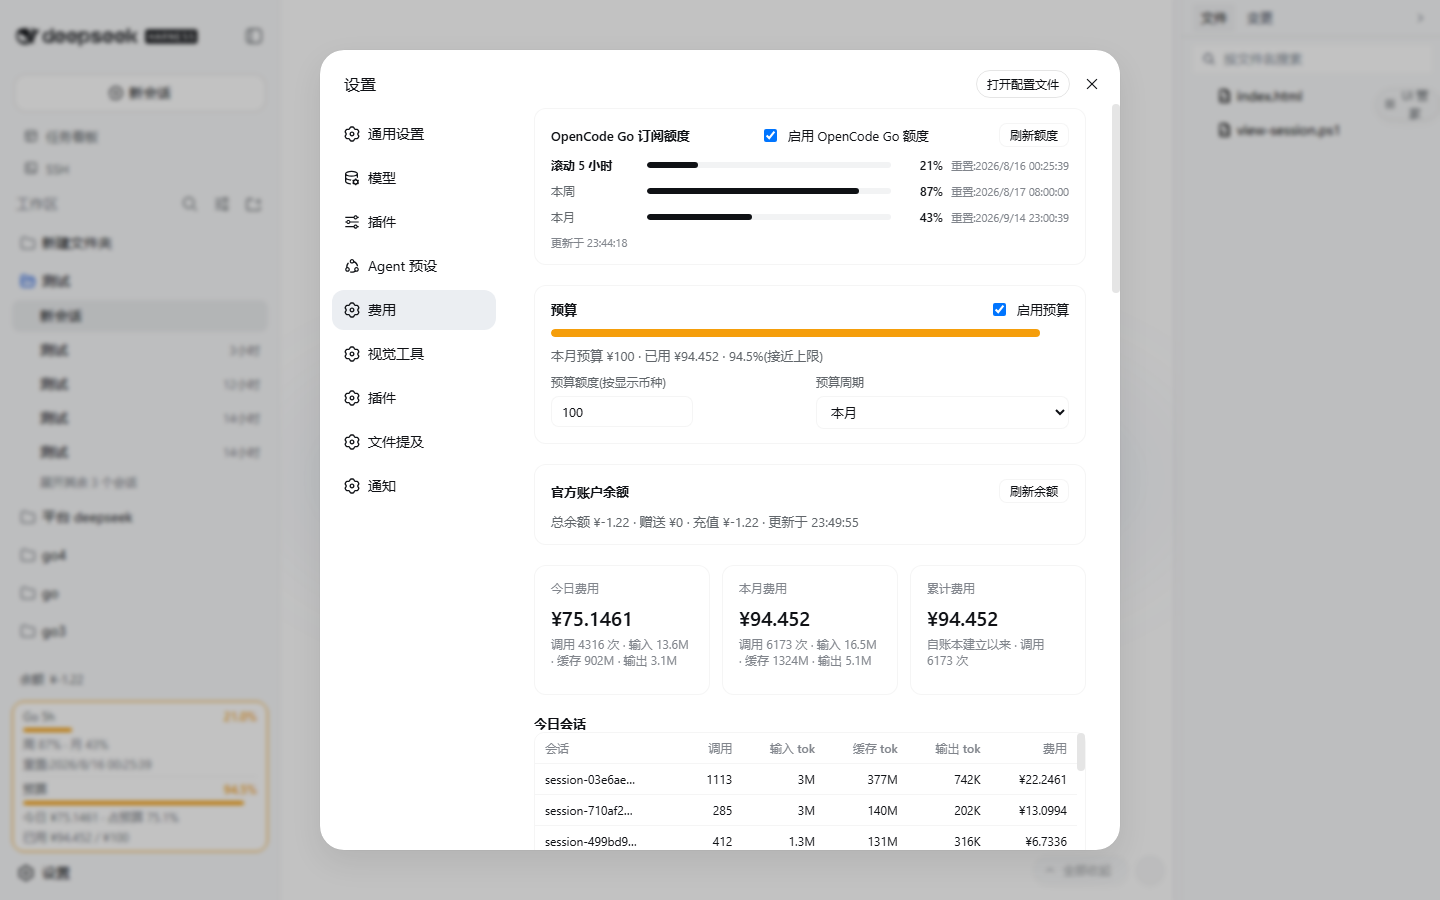
**OpenCode Go quota panel** (very top of the Settings page: three progress bars, main window highlighted, manual refresh; a neutral hint when there is no subscription, one-click disable):
**Budget panel** (including custom date ranges):

**Balance panel** (total/granted/topped-up + manual refresh):

**Display settings** (Go main window & key, corner chips, box details, …):
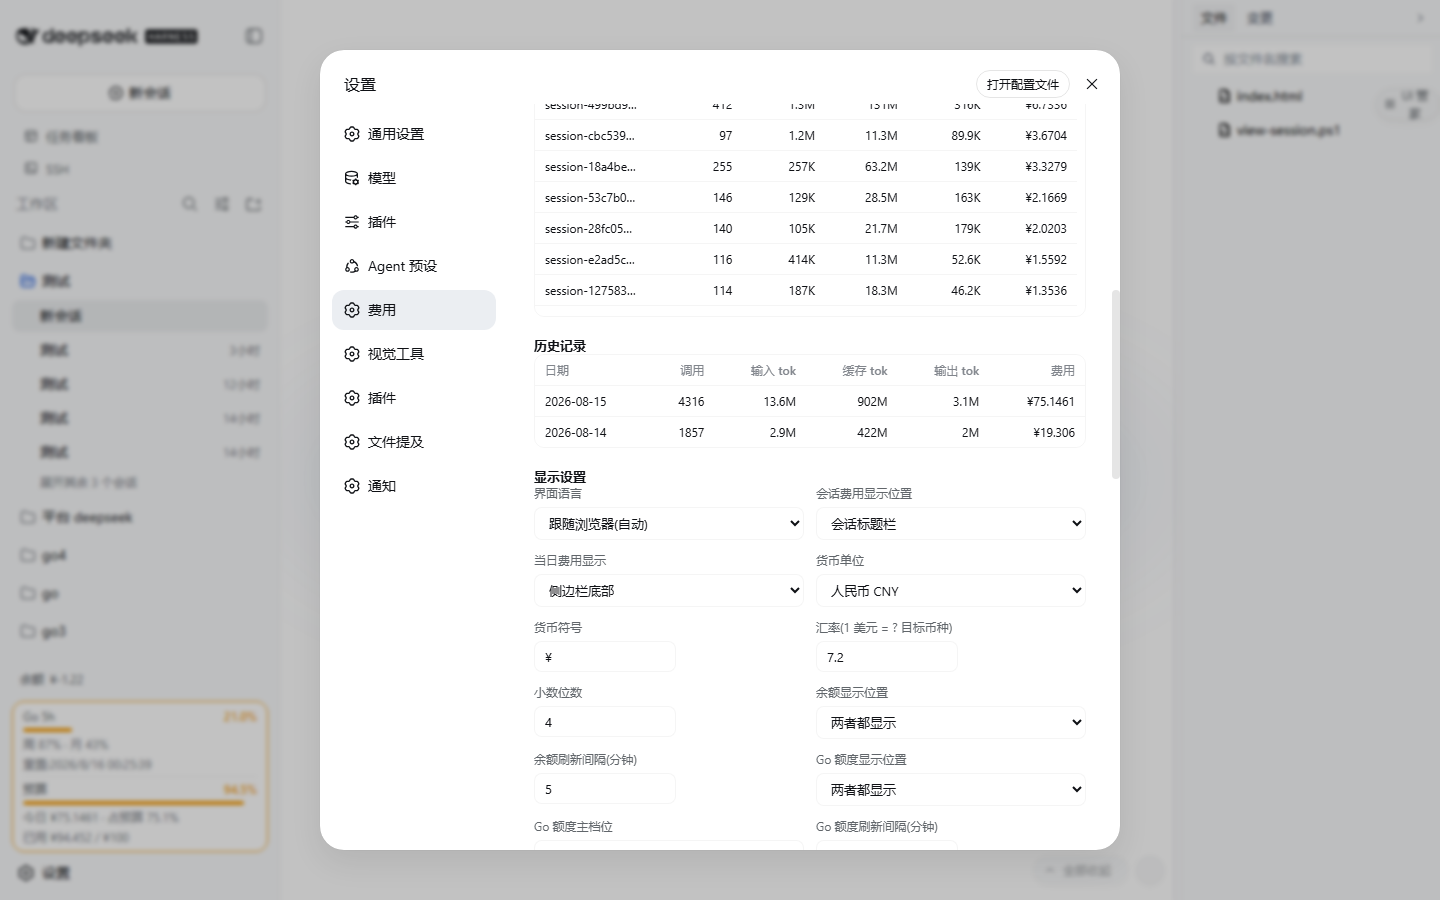
**Summary cards**:

**Token usage stats** (all-time totals + a Codex-style 26-week heat grid filling the settings width; translucent glass cells for unused days):
**Today's sessions / history** (input, cache and output tokens in separate columns):
**Price table** (off-peak / peak tiers, with input/output shorthand support, USD / 1M tokens):
**Data & sync** (instant auto-save of settings + official price sync + clear history):

## Installation
> Requirements: Node.js ≥ 20 + DeepSeek Harness (a version with the `dsh plugin` command; `npm install -g @deepseek-ai/dsh`).
### One-click install (recommended)
**PowerShell one-click script** (copy the whole line, paste, press Enter; pnpm is provisioned automatically, git is auto-detected — no clone needed; the install chain is **pinned to the release tag `v1.5.2`** — review the script before running):
```powershell
irm https://raw.githubusercontent.com/Han-1413141/dsh-cost-meter/v1.5.2/install.ps1 | iex
```
**Or a plain command line** (the machine must already have pnpm and git; also pinned to the tag):
```sh
dsh plugin --profile web add github:Han-1413141/dsh-cost-meter#v1.5.2
```
Without git, use the GitHub tag archive:
```sh
dsh plugin --profile web add https://github.com/Han-1413141/dsh-cost-meter/archive/refs/tags/v1.5.2.tar.gz
```
After installing, **restart** `dsh web` (plugin rows, the Typert manifest and the client bundle are all scanned at startup):
```sh
dsh web
```
### Update / Uninstall
```sh
# update: re-run the new release's install.ps1 (the pinned tag inside it moves with the release)
dsh plugin --profile web remove dsh-cost-meter # uninstall
```
### Local development
```sh
git clone https://github.com/Han-1413141/dsh-cost-meter.git
cd
dsh plugin --profile web add link:./dsh-cost-meter # symlink; edit lib/client.js, refresh the page, done
```
## Billing rules
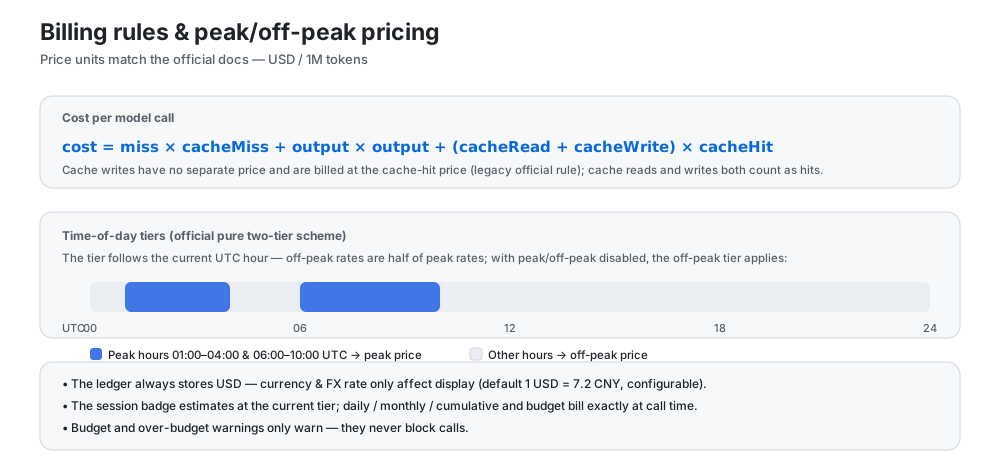
- Price units match the official docs: **USD / 1M tokens**;
- cost = cache-missed input × cache-miss + output × output + (cache read + cache write) × cache-hit (cache writes follow the legacy official rule and are billed at the hit price);
- **Pure two-tier peak/off-peak pricing** (the official scheme since 2026-08): peak hours (01:00–04:00, 06:00–10:00 UTC) bill at the peak price and all other hours at the off-peak price (off-peak = half of peak). The base tier equals the off-peak tier, and billing falls back to off-peak when peak/off-peak is disabled; the Settings page shows the live tier (peak / off-peak); the budget/today's cost area shows a peak/off-peak period strip (current/next period with countdown), and the collapsed rail shows a vertical peak/off-peak progress bar;
- **Historical billing correctness**: calls before 2026-08-16 16:00 UTC (the peak-era boundary) are billed at the base prices of that time, and later calls at the two-tier scheme;
- The ledger always stores amounts in **USD**; currency and FX rate only affect display (default 1 USD = 7.2 CNY, configurable);
- The session badge is **billed exactly** at the moment each call is made (host-exported per-call cost), just like daily/monthly/cumulative totals and the budget;
- Billing sources are the `usage` block of every model call (including sub-agents, compression, title generation and other auxiliary calls), matching the billable view;
- Budget and over-budget warnings **only warn — they never block calls**.
## Data storage
- Ledger: `$DSH_HOME/storages/cost-meter/ledger.json` (atomic write + 2-second debounce; retained per `historyDays`, up to 200 per-session entries per day);
- Every settings change is **saved instantly and automatically** (600 ms debounce) — no manual save needed;
- Delete the ledger file to reset everything, or use “Clear all history” in Settings.
## Architecture
```
dsh-cost-meter
├── cordis.patch.yml # bundle patch: inserts the cost-meter row into the web profile
├── install.ps1 # one-click install/update script (irm … | iex)
├── .github/workflows/ # CI: install-smoke for the one-click install path
├── package.json # dsh.bundle patch declaration + dsh.client browser declaration
└── lib/
├── index.js # host plugin: llm/stream billing wrapper, costUsage session
│ # projection, costMeter service (hand-written typertRemote
│ # binding), balance lookup
├── pricing.js # official price table, official page HTML parsing, peak/off-peak math
├── store.js # ledger persistence & config management ($DSH_HOME/storages/cost-meter)
├── typert.host.js # ./typert export: Typert manifest (auto-registered by typert-loader)
└── client.js # ./client export: browser single-file bundle (badges/box/settings)
```
Data channels:
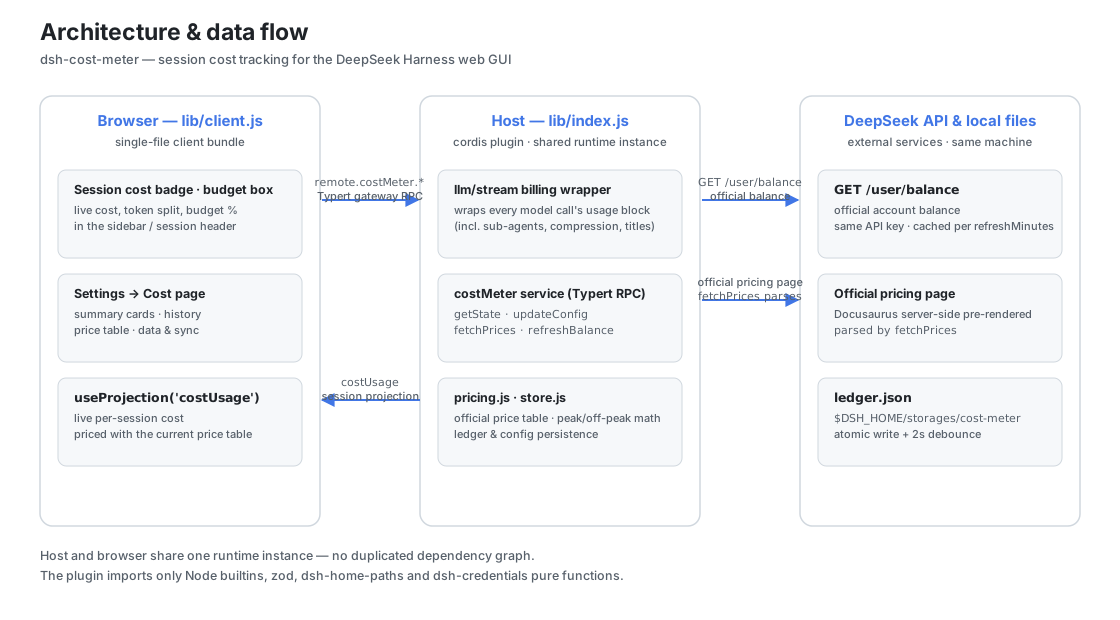
- **Per-conversation cost**: the host registers the `costUsage` session projection (pure token buckets, split per model); the browser reads it via `useProjection('costUsage')` and prices it with the current price table;
- **Global ledger / budget / balance / config**: `costMeter/getState | updateConfig | fetchPrices | refreshBalance | resetHistory` over the Typert gateway RPC (`remote.costMeter.*`);
- **Balance**: calls the official `GET {baseURL}/user/balance`, reusing the same API key as model requests (credential service / env var), with an in-process cache expiring per `refreshMinutes`.
The plugin never imports cordis/dsh Service/Context runtime classes (only Node builtins, zod, and pure functions from dsh-home-paths and dsh-credentials), so it shares one runtime instance with the host with no duplicated dependency risk.
## How official price sync works
`fetchPrices` fetches the official pricing page (Docusaurus server-side pre-rendered) and parses:
1. the base price table (transposed layout: first row MODEL + model ids, price labels followed by the prices);
2. the peak/off-peak price table (two rows per model: OFF-PEAK / PEAK);
3. the effective time (“take effect at …”) and the peak-hour windows (“Peak hours are …”).
The parsed result is written into the price table and persisted; if the page structure changes, sync reports an error and keeps the previous prices, with manual editing as a fallback.
## AI price sync
[docs/AI-PRICE-SYNC-PROMPT.en.md](docs/AI-PRICE-SYNC-PROMPT.en.md) (English) and [docs/AI-PRICE-SYNC-PROMPT.md](docs/AI-PRICE-SYNC-PROMPT.md) (中文) provide prompts you can copy straight into any AI:
the AI reads the official pricing on its own → outputs per-model, time-of-day (base/off-peak/peak + effective time) price JSON → you review and apply it (Settings page / RPC / file — pick one). Handy when the official prices change.
## Development & verification
```sh
corepack pnpm install # dependencies
node --check lib/index.js && node --check lib/pricing.js \
&& node --check lib/store.js && node --check lib/typert.host.js \
&& node --check lib/client.js # syntax checks
node test/verify.mjs # pure-module verification (parsing/billing/ledger/config)
node test/mock-balance.mjs # (optional) local balance API mock: 3101
dsh --profile web --dump-config # composition-tree check
dsh --profile web --port 3099 # real startup (watch logs and the UI)
```
## Known limitations
- Official-page parsing depends on the current page structure; after a redesign, “Sync prices from official docs” fails — edit the price table manually as a fallback;
- The session badge is estimated at the current price tier; exact figures come from the ledger;
- Price sync overwrites the same-named models listed on the official page; custom model entries are unaffected;
- Balance lookup needs network access to api.deepseek.com and a valid API key; **the API key is only ever sent to the official domain** (if baseURL points at a non-official host, balance queries refuse to run — model requests are unaffected);
- The OpenCode Go quota endpoint is the official opencode.ai endpoint (community-documented); if its response shape changes, the Settings page shows an error and the display can be turned off in Display settings;
- A restart of `dsh web` is required after installing/updating the plugin.
## Update history
A per-version overview and the community-issue resolution log live in [docs/UPDATE-HISTORY.md](docs/UPDATE-HISTORY.md) (中文); the itemized changelog is [CHANGELOG.md](CHANGELOG.md).
## License
[MIT](LICENSE) © 2026 dsh-cost-meter contributors