# DSH Usage Statistics Panel
English | [中文](README.md)




[](https://awesome-dsh-plugin.com)
[](https://github.com/HaoyueQin/dsh-usage-statistics-panel/graphs/commit-activity)
[](https://github.com/HaoyueQin/dsh-usage-statistics-panel/commits)
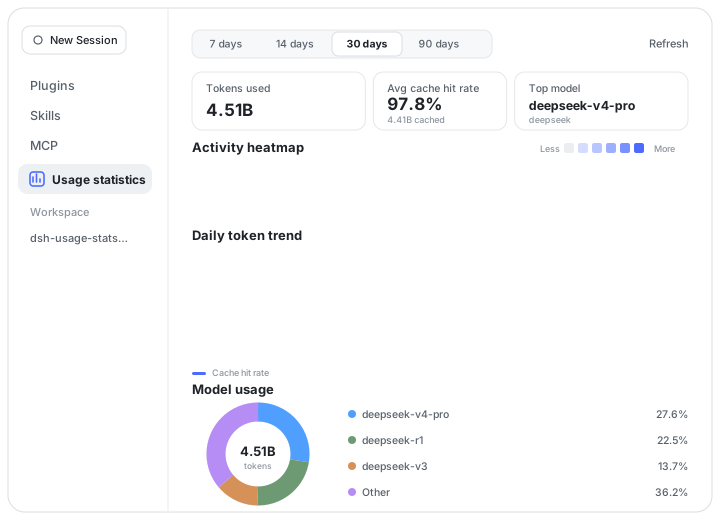
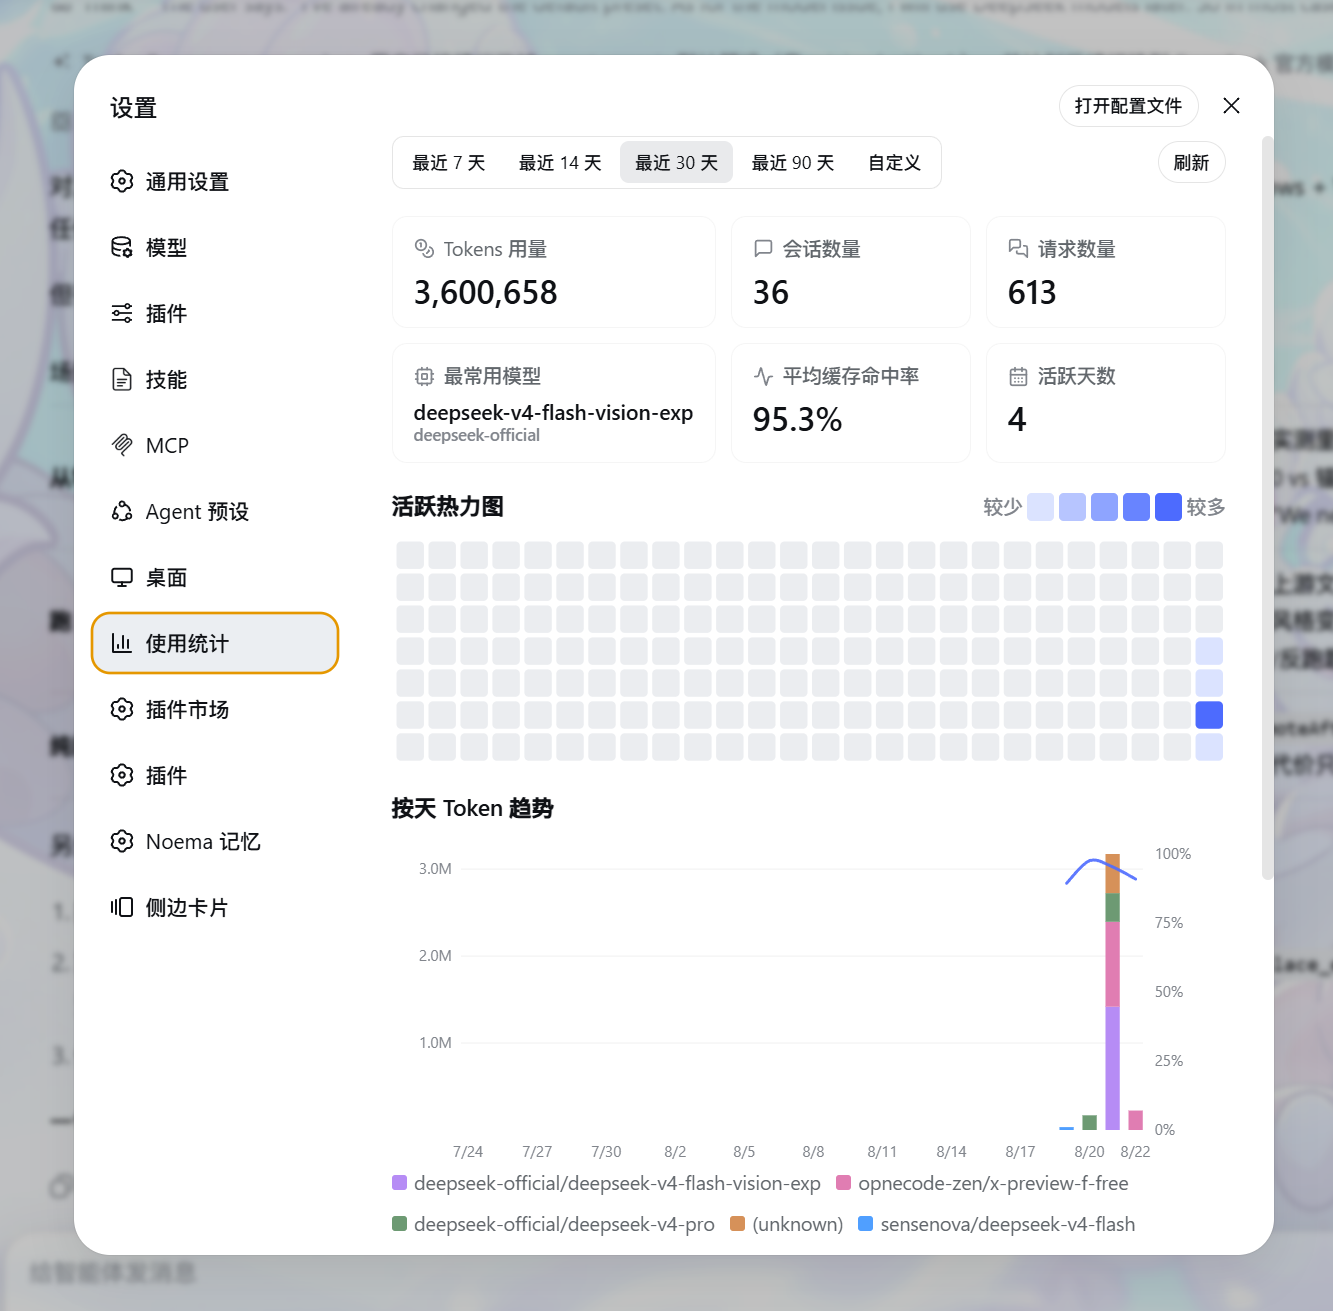
A usage statistics panel plugin for the DSH web UI: per-day token trend, a GitHub-style activity heatmap, a cache hit-rate curve, and two breakdowns — by model and by provider (donut + detail list each) — living on the plugin's own page inside the Plugins page, with its own row in the left rail.
All charts are hand-drawn SVG with no chart library; the palette uses GitHub Primer's data-viz two-set tokens (the top ten models and the top five providers each get a distinct rank colour, everything else collapses into a gray "Other" bucket) and adapts to the DSH theme.
## Preview
## Features
- **Time ranges**: last 7 / 14 / 30 / 90 days, or a custom from/to pair
- **Summary cards**: token usage, sessions (completed turns), requests, active days, average cache hit-rate, top model
- **52-week activity heatmap**: GitHub-style day cells, hover for the day's detail; the data window is a fixed year and the column count adapts to the available width (a narrow pane shows fewer weeks), so the chart always spans its container edge to edge
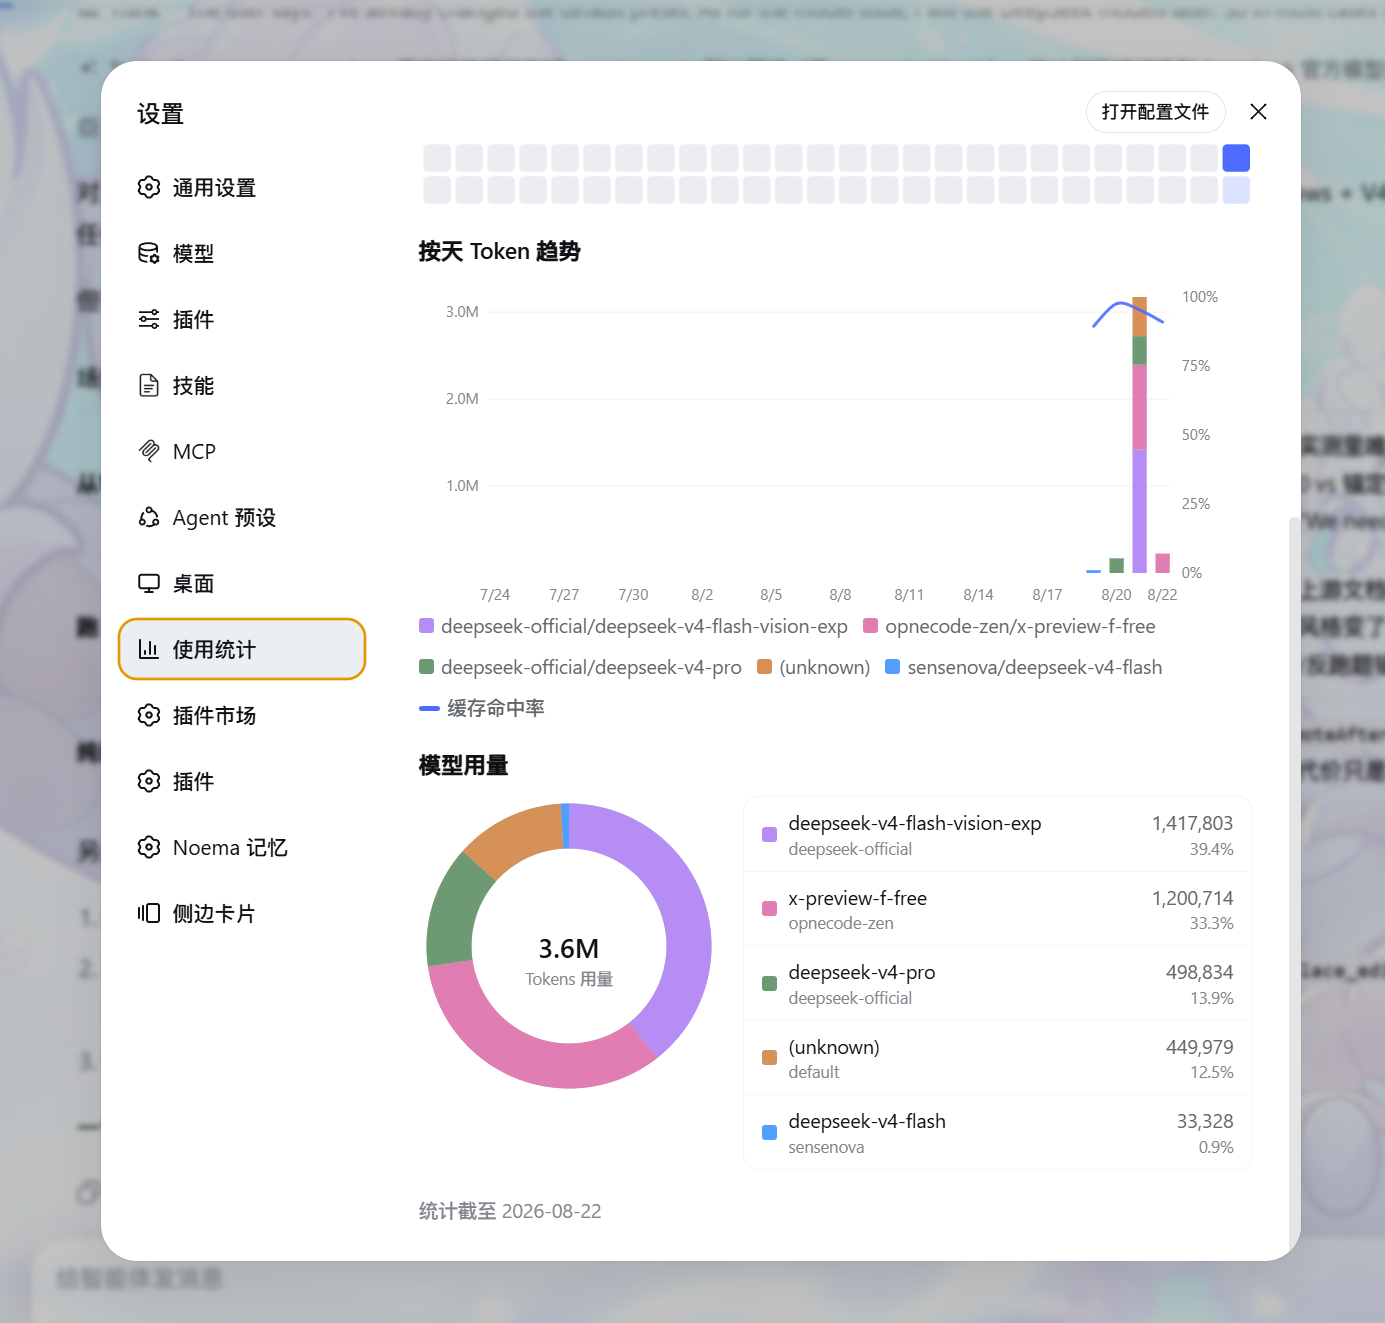
- **Daily token trend**: stacked bars with a smooth cache hit-rate curve (Catmull-Rom), hover for the per-model breakdown; the plot spans the container width at any size
- **Model usage**: donut + detail list; the top ten models keep distinct colours, the tail collapses into an expandable "Other" row, and the ring's diameter adapts to the available width between 200 and 280px, centred against the list beside it
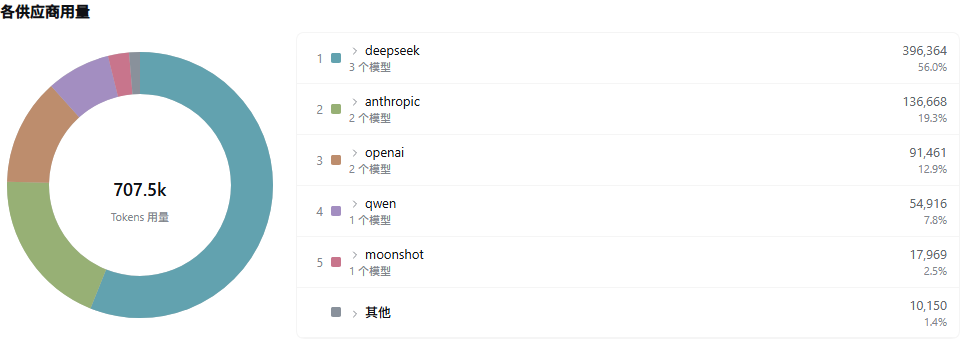
- **Provider usage**: the same anatomy one dimension up — the top five providers keep distinct colours from their own palette, the tail collapses into a gray "Other" bucket, hovering either side lights the other, and the ring's hover tip lists every model that provider served. Each row expands (the Other bucket opens the providers it folded, and each of those opens its own models); expanding never resizes the ring
- **Bottom-bar enhancements**: three switches at the bottom of the panel, all in the same framed style and applied instantly — "Precise cache hit rate" (two decimals, e.g. 85.25%), "Session token breakdown" (total, input, cached input, uncached input and output in place of the default input/output pair), and "Streaming throughput" (the speed reading refreshes to a live estimate on every stream delta and hands back to the session's exact figure once the step settles; the estimate starts from DeepSeek's published character density and is calibrated against the chars-per-token ratio measured from the session's own settled steps, and the live rate counts only the token growth actually observed inside the last 2 s and smooths it, so neither a backlog the UI delivered late nor one noisy frame moves the display, and a step that goes quiet holds its last reading instead of dropping back to the session average)
- **History backfill**: on first enable, the plugin enumerates and replays existing session logs; for a live session the collector attached to mid-flight, its pre-attachment history is recovered on the next boot by replaying the log prefix below the recorded seq boundary, so historical usage is accounted from day one as faithfully as the logs allow
- **Local persistence**: data lands in `$DSH_HOME/storages/usage_history.json` (storage-domain), fully local, no external services
## Install
```sh
dsh plugin --profile add dsh-usage-statistics-panel@latest
```
After mounting, **hard-refresh the browser** (Cmd/Ctrl+Shift+R): client-half changes hot-reload in DSH, no restart needed; only host-half updates (collector/storage/routes) require restarting DSH.
Once mounted there are two ways in: the **Usage statistics** row in the left rail under New Session, or **Plugins** → **Installed** → `usage-statistics-panel` on its detail page (the card shows the short name; the full package name is on that page). Both render the same panel.
**Compatibility**: this plugin supports DeepSeek Harness `>= 0.1.2-rc.1` with a dual-path backfill: `list`+`inspect` on `0.1.2-rc.1`, `list`+`open`+paged `read`+`close` on `0.1.3-alpha.*` and later (`inspect` was removed upstream). Dev dependencies and the verification target track host `0.1.6-alpha.2`, verified against `0.1.2-rc.1`, `0.1.5-rc.2`, `0.1.6-alpha.1` and `0.1.6-alpha.2`; V3 log compatibility is covered by unit tests.
The bottom-bar row adapts to the container it is rendered in: from `0.1.6-alpha.2` the host places it in a flex row beside the context-occupancy ring (which owns the centring, the gap, the top pad and the side clearance), while through `0.1.6-alpha.1` the row still owns its content width, its side gutters and its 4px top pad — one build stays aligned on both.
> The `@deepseek-ai/*` peer declarations state the capability floor only (`>=0.1.2-rc.1` is the earliest interface surface the plugin uses) and are all marked optional: no semver range matches a future pre-release host (`>=0.1.2-rc.1` satisfies neither `0.1.5-rc.2` nor `0.1.6-alpha.2`), so the supported host versions are those stated in this section rather than npm peer validation.
> **Older-host users**: if you run DeepSeek Harness `0.1.1-rc.2` or `0.1.2-alpha.*`, please install an older plugin version (`0.1.9` or earlier). `0.1.10` supports only `>= 0.1.2-rc.1`; from `0.1.11` one build serves both `0.1.2-rc.1` and `0.1.3-alpha.*`.
## Data source
The collector is observational: it subscribes to the session event stream (`session/event`), reads provider-reported `TokenUsage` from `assistant/message` and `assistant/chunk` (input / output / cache-read / cache-write), and dedupes by `(turn, step)` WITHIN one session (each call counts once, keeping the first report — the shipped adapters report identical values on the streaming sample and the final message; concurrent sessions never swallow each other's samples). Model attribution prefers the message's own `source` (stamped per call) and falls back to the session's route fold (`request/context` events or the session's `requestContext()`), so a host restart never drops samples into the "(unknown)" bucket. On first enable it also backfills by replaying persisted session logs.
> Note: usage accumulates from the day the panel is enabled (including the backfill). Sessions whose logs predate the feature carry no provider-reported usage and cannot be reconstructed.
**Token semantics**: the headline token total on the cards and in the trend is PROVIDER-INCLUSIVE — uncached input + output + cache reads + cache writes, matching what a provider dashboard reports for the same calls (DeepSeek splits prompt tokens into disjoint input/cache-read buckets, so a naive input+output sum would hide the typically dominant cached share). The average cache hit-rate keeps an input-side-only denominator (hits + misses), and the hit-rate card also shows the absolute cached volume; the two denominators never mix.
**Rebuilding stats**: `POST /usage/api/reset` (behind the same trust fence as the panel) wipes the local statistics and replays every persisted session log under the CURRENT attribution rules — the escape hatch for corrupted history or attribution-logic upgrades. Sessions still open at reset time are re-bounded at their wipe-time log length: everything below is rebuilt by the replay, everything after stays with the live collector, and nothing counts twice.
## Development
```sh
pnpm install
pnpm typecheck # tsc --noEmit
pnpm test # vitest
pnpm build # tsc declarations + tsdown (host ESM + dual-channel client bundles)
```
## Design & implementation
- **Host half** (`src/`): `collector` (event subscription + backfill fold), `store` (the `usage_history` storage domain), `query` (range aggregation, a TS translation of the reasonix query.go), `routes` (the fenced `/usage/api` JSON routes, same trust fence as the `/api` gateway)
- **Client half** (`src/client/`): `UsageStatsPanel.tsx` (hand-drawn SVG charts ported from the reasonix panel + Primer palette), `locales` (en / zh / zh-TW), `api` (the `/usage/api` fetch wrapper)
- **Dual-channel bundles**: `lib/client.js` (official profile channel, bundle id = package name) and `lib/client-registry.js` (plugin-registry channel, bundle id = manifest id)
- Full design notes: [docs/design.md](docs/design.md)
## Acknowledgements
This panel is a port of the usage statistics feature the author originally built for [DeepSeek-Reasonix](https://github.com/esengine/DeepSeek-Reasonix) (PR [#7238](https://github.com/esengine/DeepSeek-Reasonix/pull/7238) and [#7503](https://github.com/esengine/DeepSeek-Reasonix/pull/7503)). The front-end charts are largely reused from that implementation; the data layer is rebuilt on DSH's session logs and storage-domain.
## Activity
[](https://gitstock.org/HaoyueQin/dsh-usage-statistics-panel)
## License
MIT