Barplot for likert type items


This post shows how to use the likert R package. It allows to build 0-centered stacked barplot to study likert type items.

Stacked bar section Data to Viz

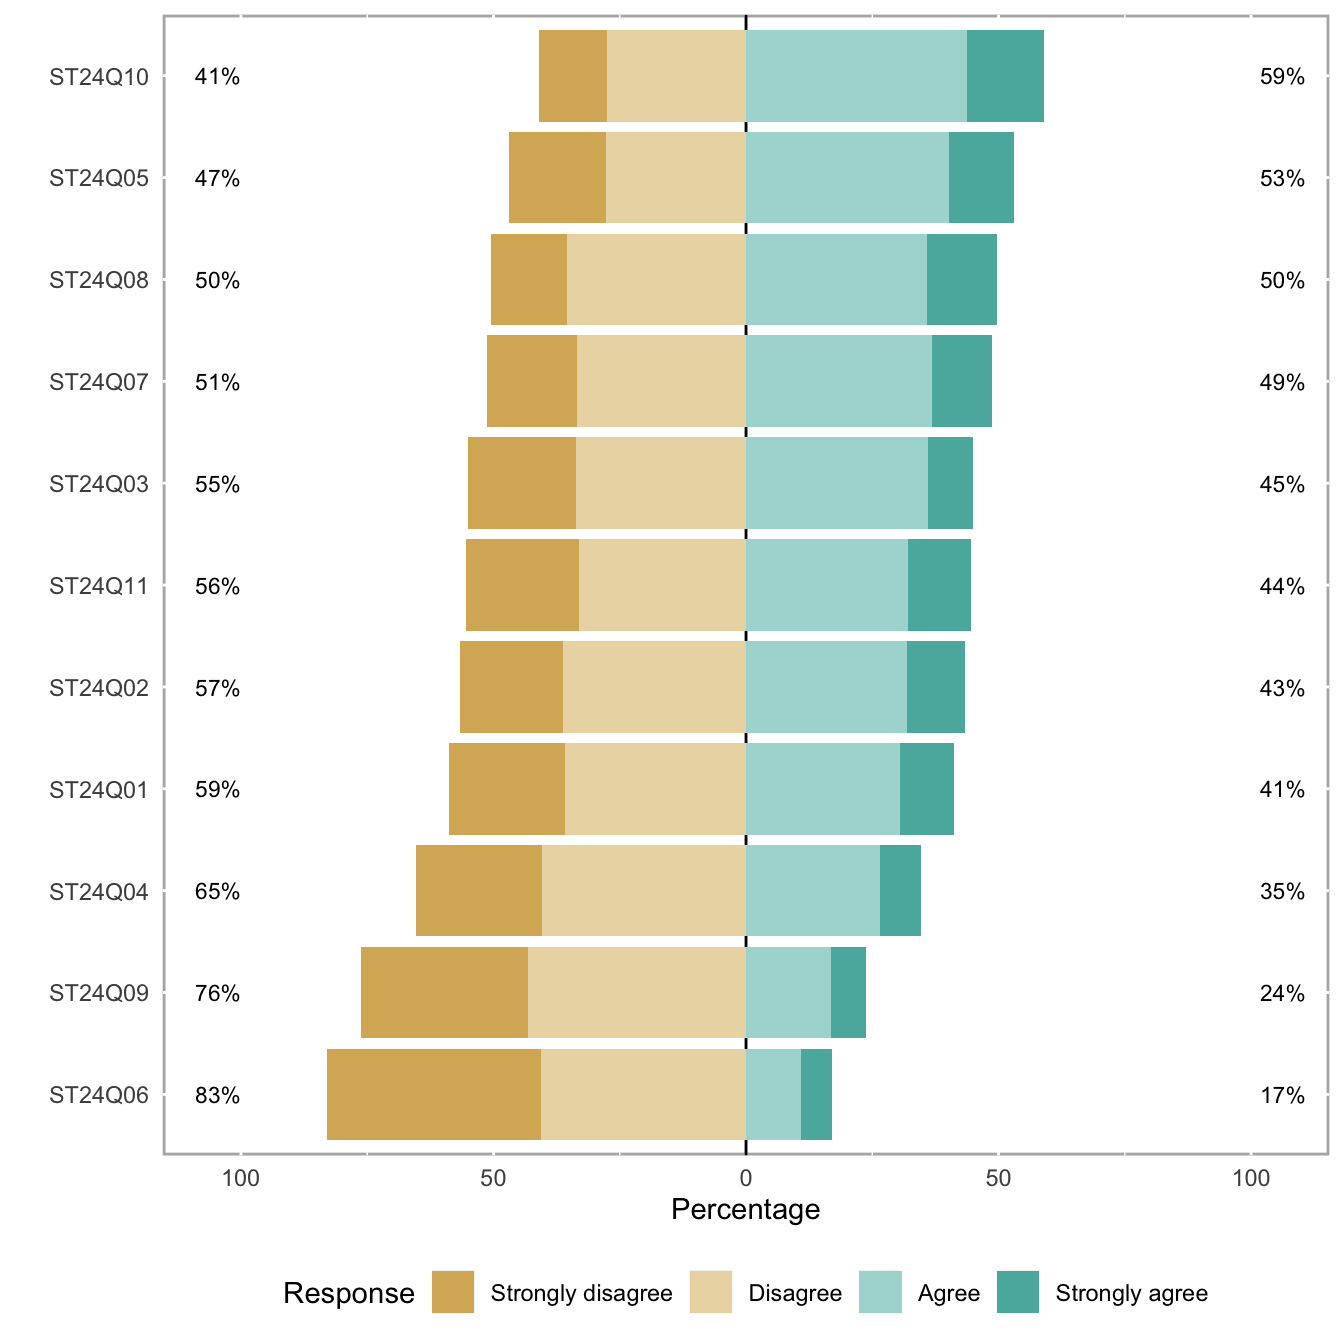
Likert is an R package designed to help analyzing and visualizing Likert type items. It has been developped by Jason Bryer and Kim Speerschneider.

This barplot comes from the demo page and has been sent by Carlos Ortega.

It allows to analyse the reading attitudes from a panel of people. Each line represents a question. The barplot explains the feeling of people concerning this question.

# library
library(likert) 
 
# Use a provided dataset
data(pisaitems) 
items28 <- pisaitems[, substr(names(pisaitems), 1, 5) == "ST24Q"] 
 
# Build plot
p <- likert(items28) 
plot(p)

Related chart types


Grouped and Stacked barplot
Treemap
Doughnut
Pie chart
Dendrogram
Circular packing


❤️ 10 best R tricks ❤️

👋 After crafting hundreds of R charts over 12 years, I've distilled my top 10 tips and tricks. Receive them via email! One insight per day for the next 10 days! 🔥