The ggplot2 library allows to
make a boxplot using
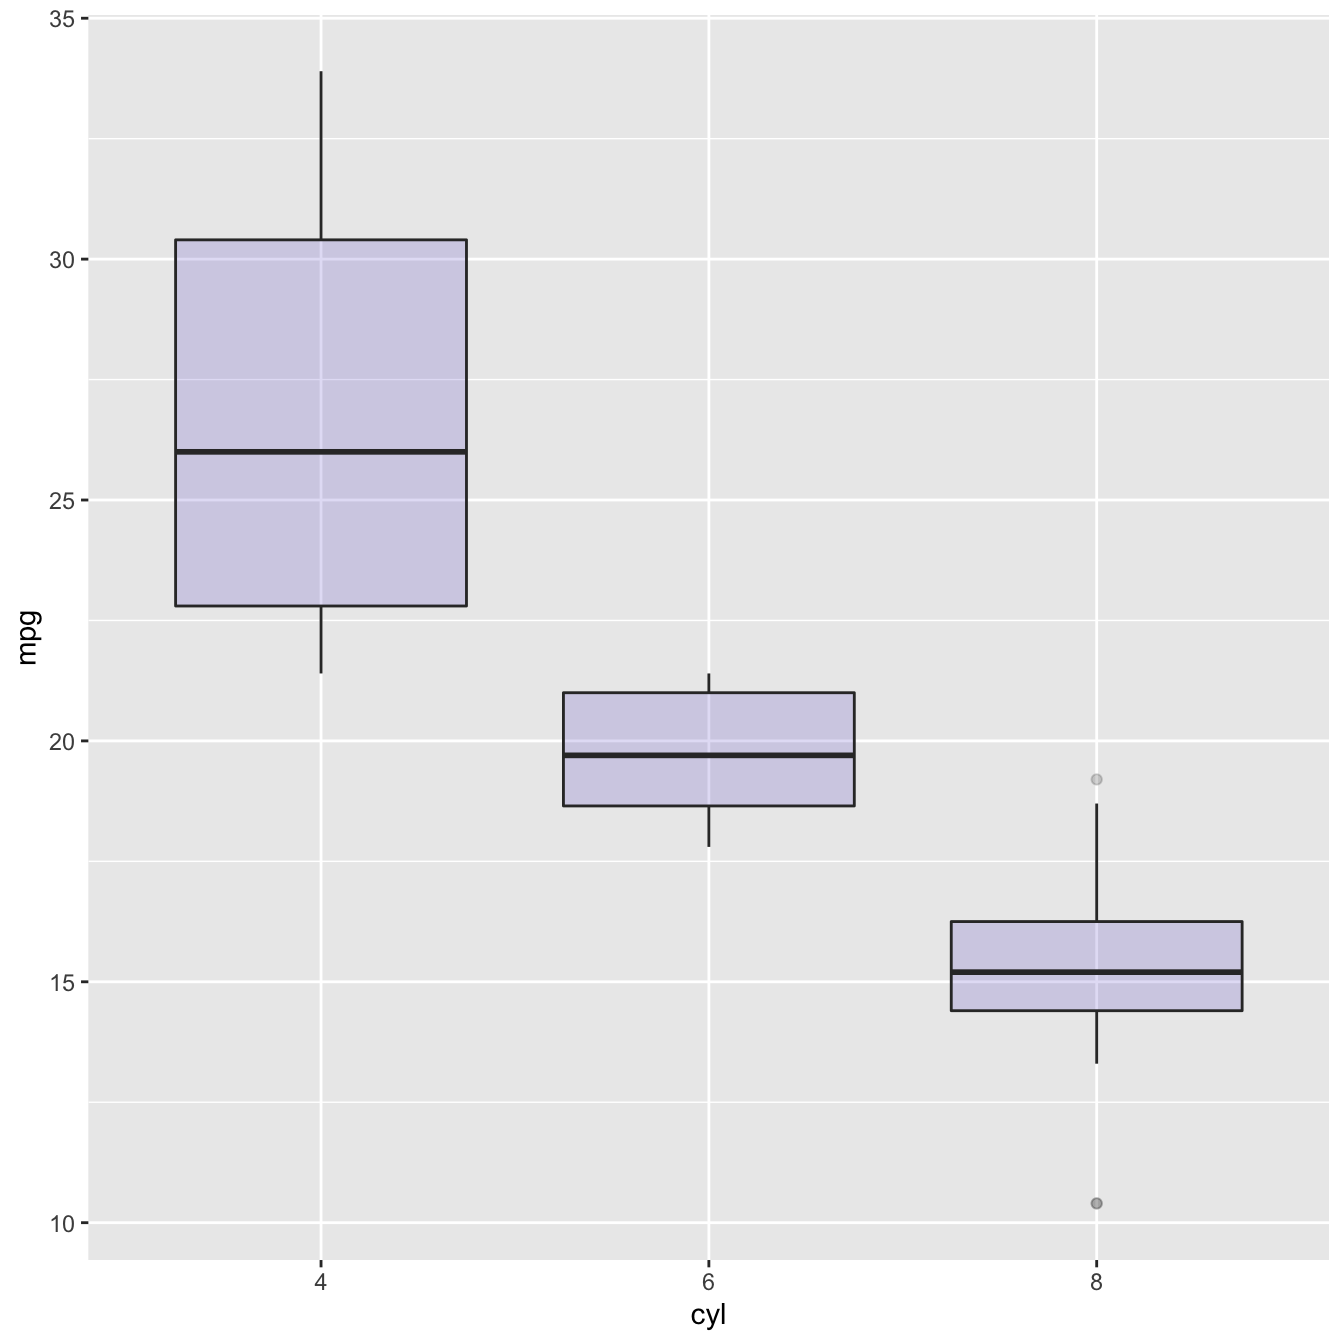
geom_boxplot(). You have to specify a quantitative
variable for the Y axis, and a qualitative variable for the X axis (
a group).
The ggplot2 library allows to
make a boxplot using
geom_boxplot(). You have to specify a quantitative
variable for the Y axis, and a qualitative variable for the X axis (
a group).
Related chart types


👋 After crafting hundreds of R charts over 12 years, I've distilled my top 10 tips and tricks. Receive them via email! One insight per day for the next 10 days! 🔥