Grouped boxplot
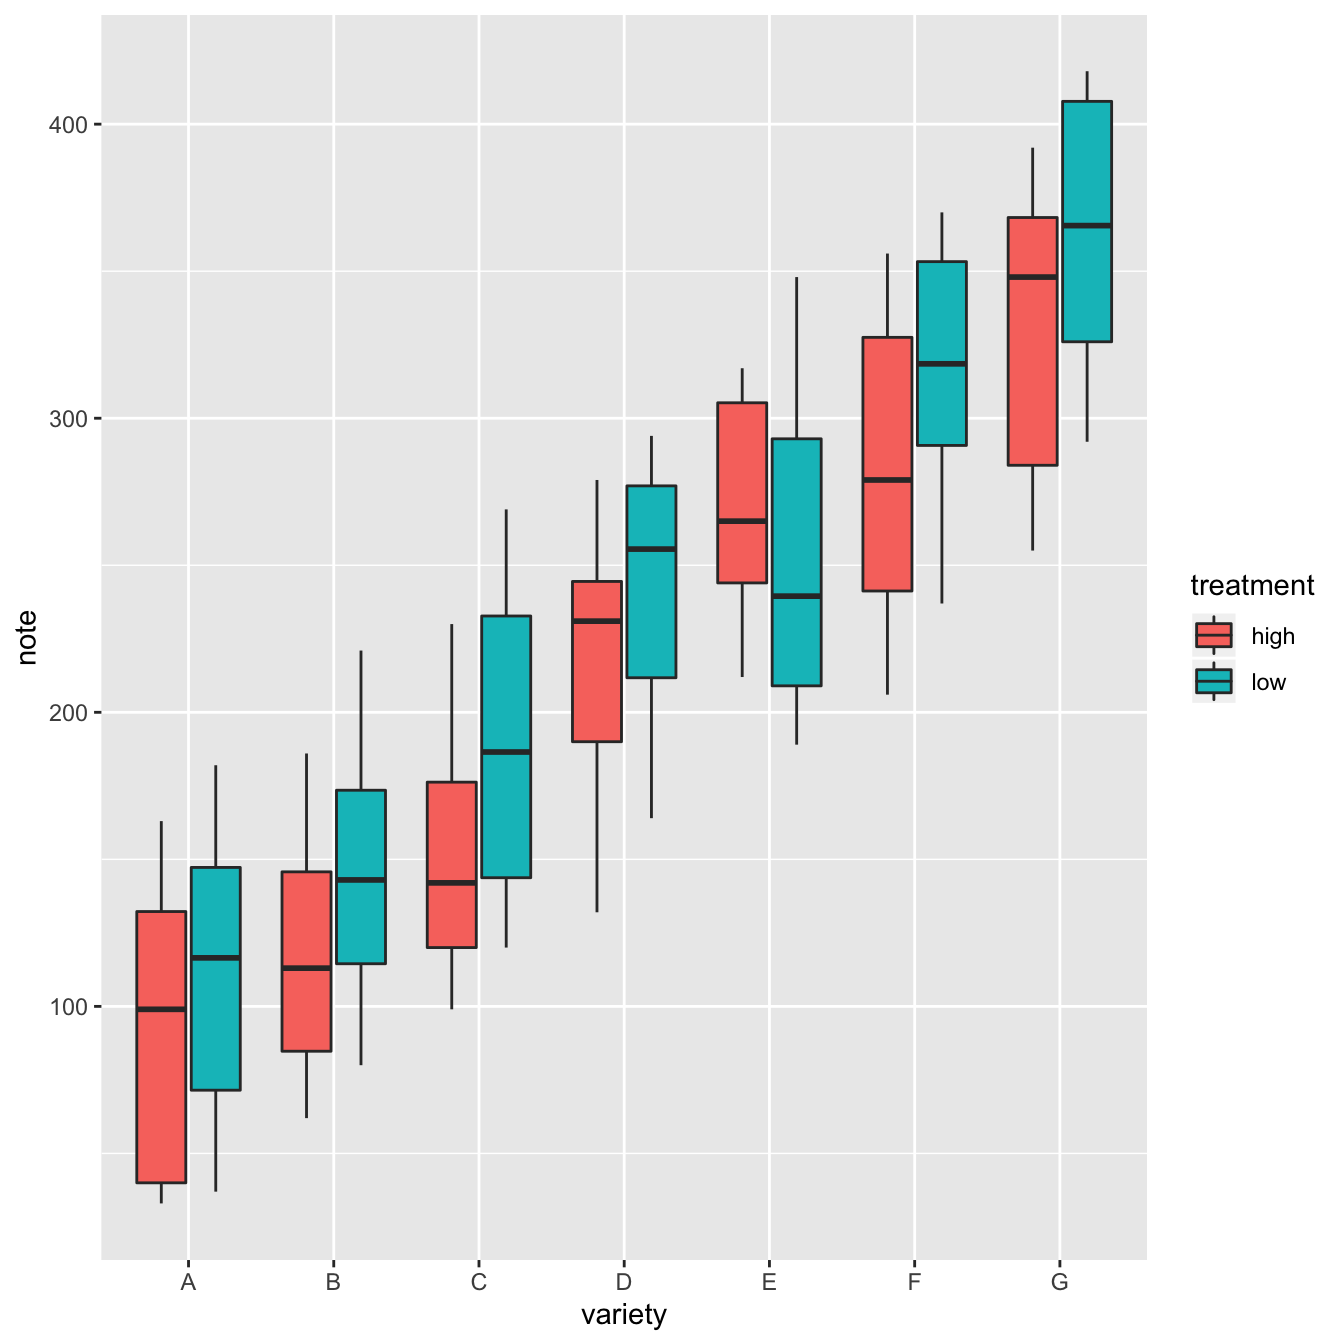
A grouped boxplot is a boxplot where categories are organized in groups and subgroups.
Here we visualize the distribution of 7 groups (called A to G) and 2
subgroups (called low and high). Note that the group must be called
in the X argument of ggplot2. The subgroup
is called in the fill argument.
# library
library(ggplot2)
# create a data frame
variety=rep(LETTERS[1:7], each=40)
treatment=rep(c("high","low"),each=20)
note=seq(1:280)+sample(1:150, 280, replace=T)
data=data.frame(variety, treatment , note)
# grouped boxplot
ggplot(data, aes(x=variety, y=note, fill=treatment)) +
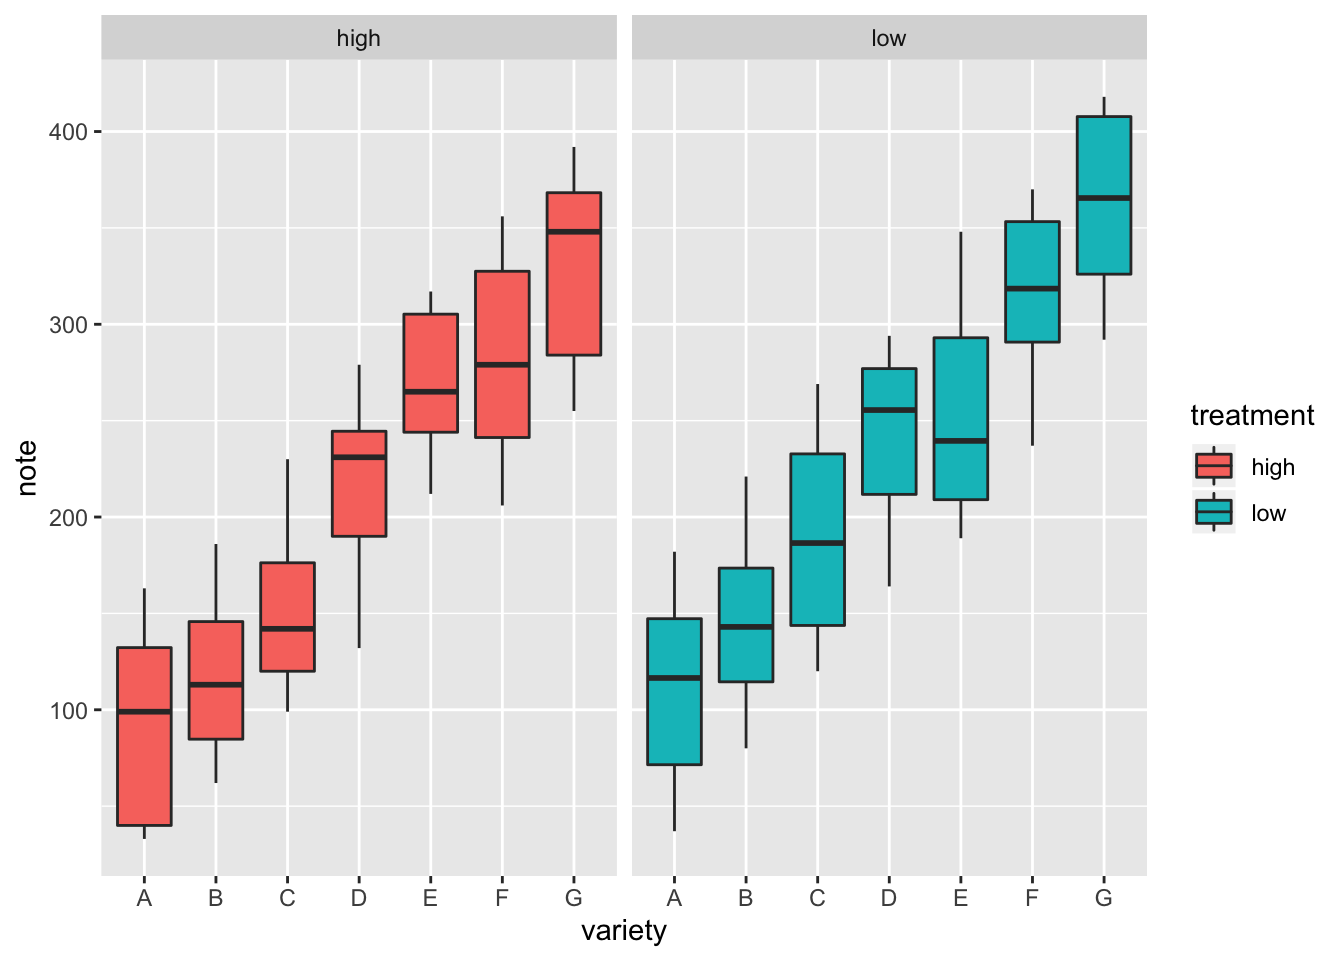
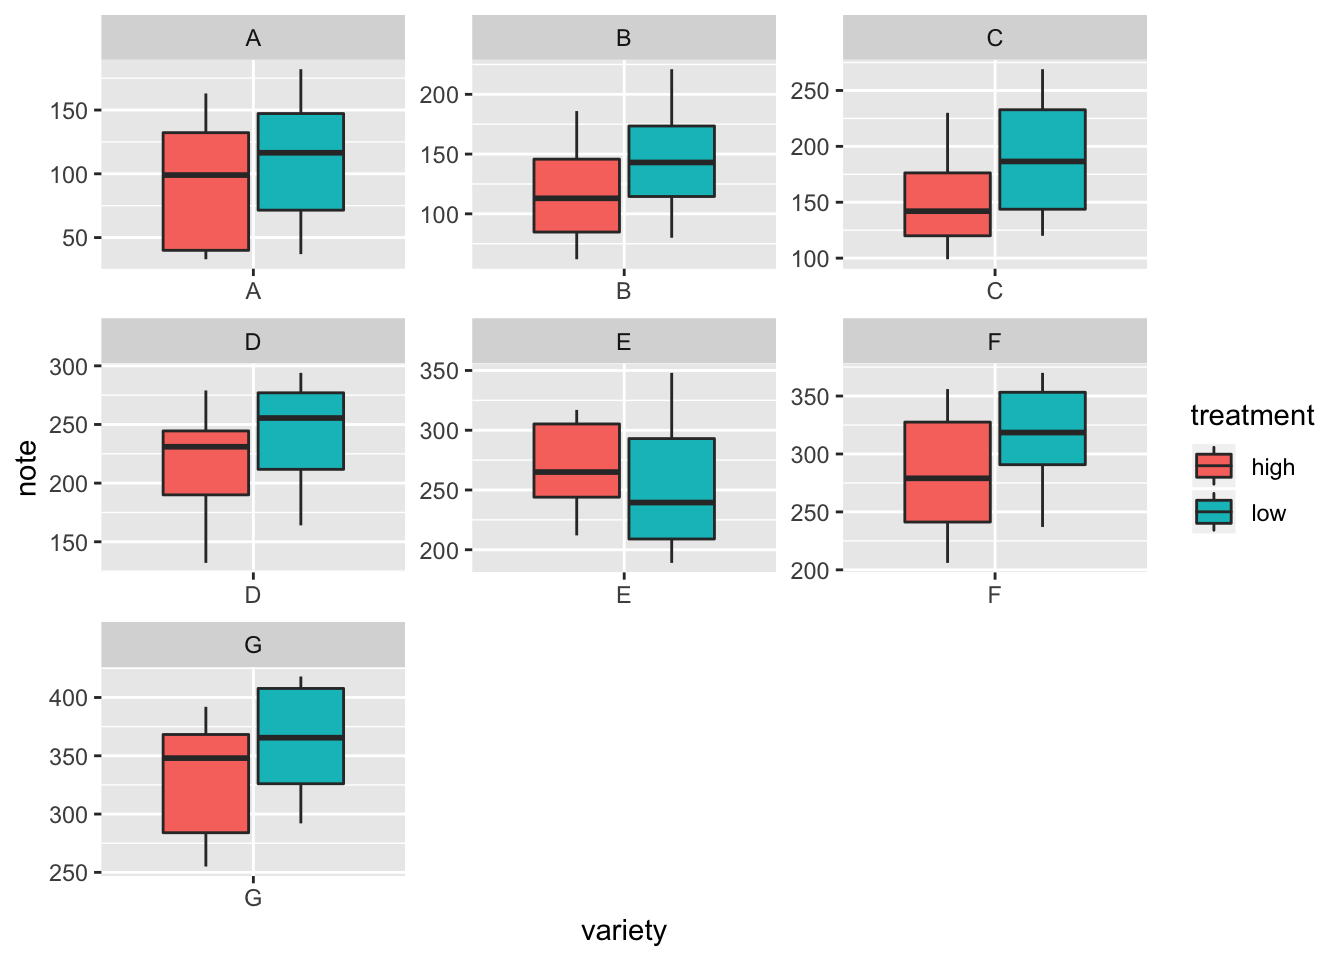
geom_boxplot()Using small multiple
Note that an alternative to grouped boxplot is to use faceting: each subgroup (left) or each group (right) is represented in a distinct panel.