Default ggplot2 title
It is possible to add a title to a ggplot2 chart using the
ggtitle() function. It works as follow:
# library & data
library(ggplot2)
data <- data.frame(x=rnorm(100))
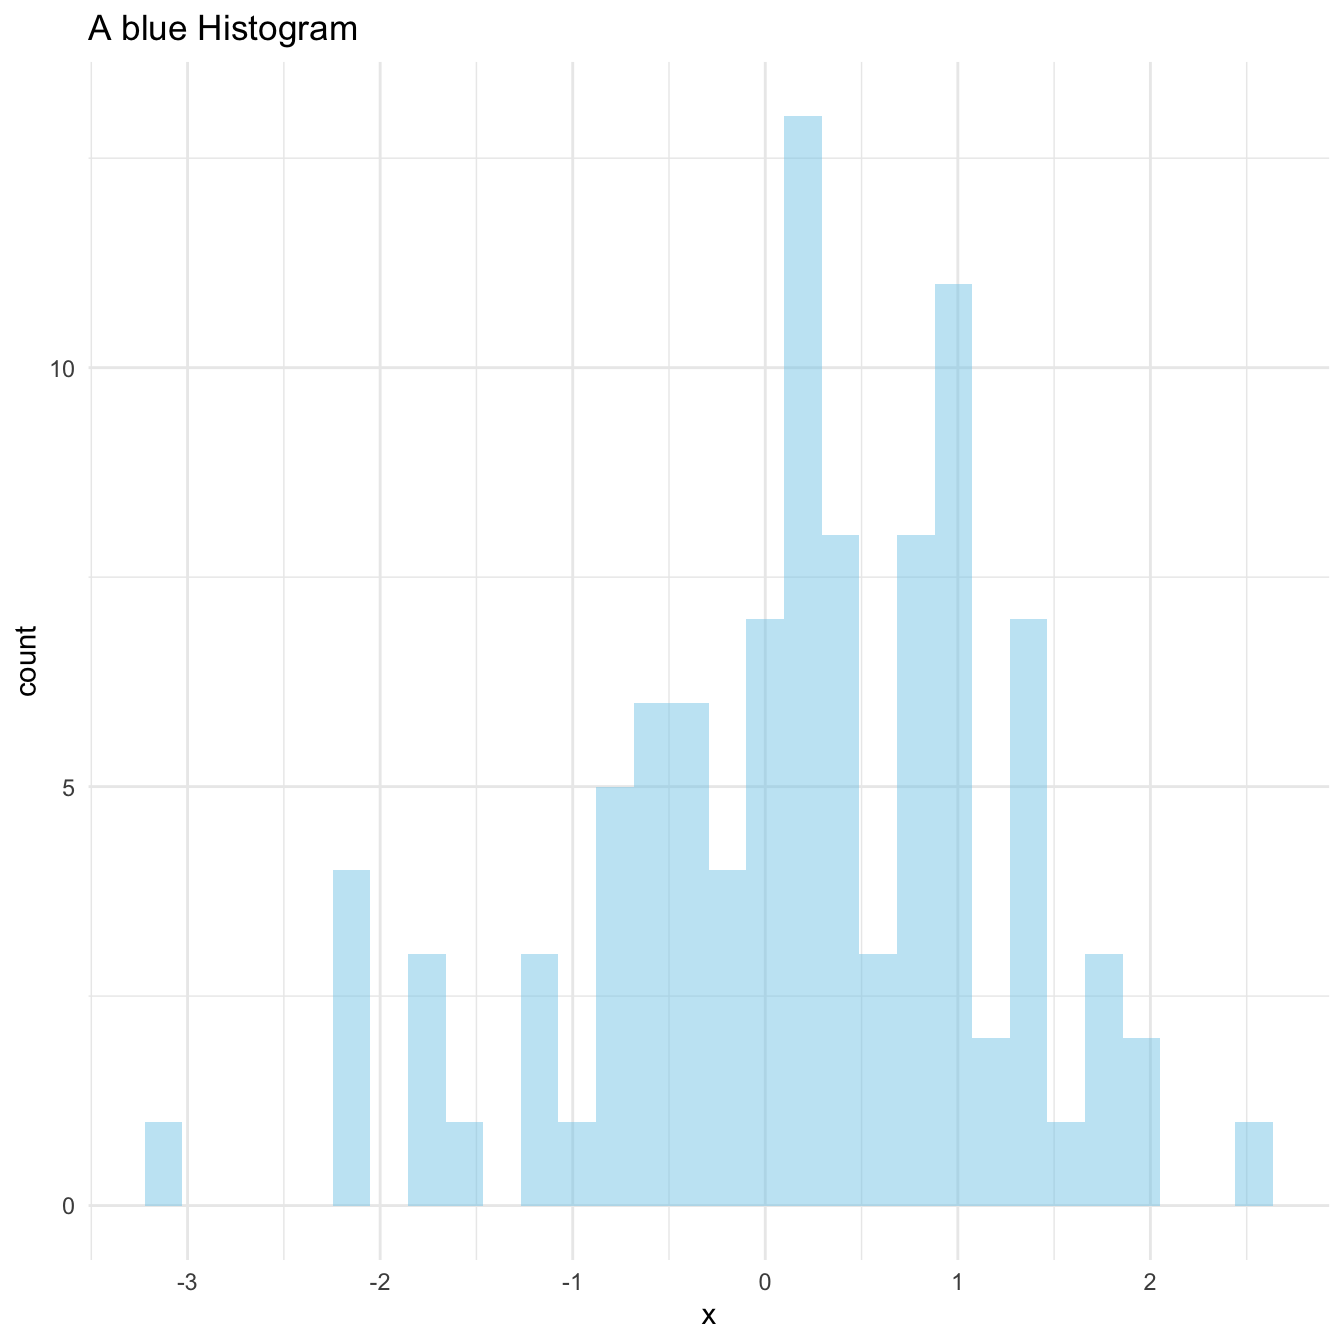
# Basic plot with title
ggplot( data=data, aes(x=x)) +
geom_histogram(fill="skyblue", alpha=0.5) +
ggtitle("A blue Histogram") +
theme_minimal()Title on several lines
It is a common need to set the title on several lines. To add a
break and skip to a second line, just add a \n in the
text.
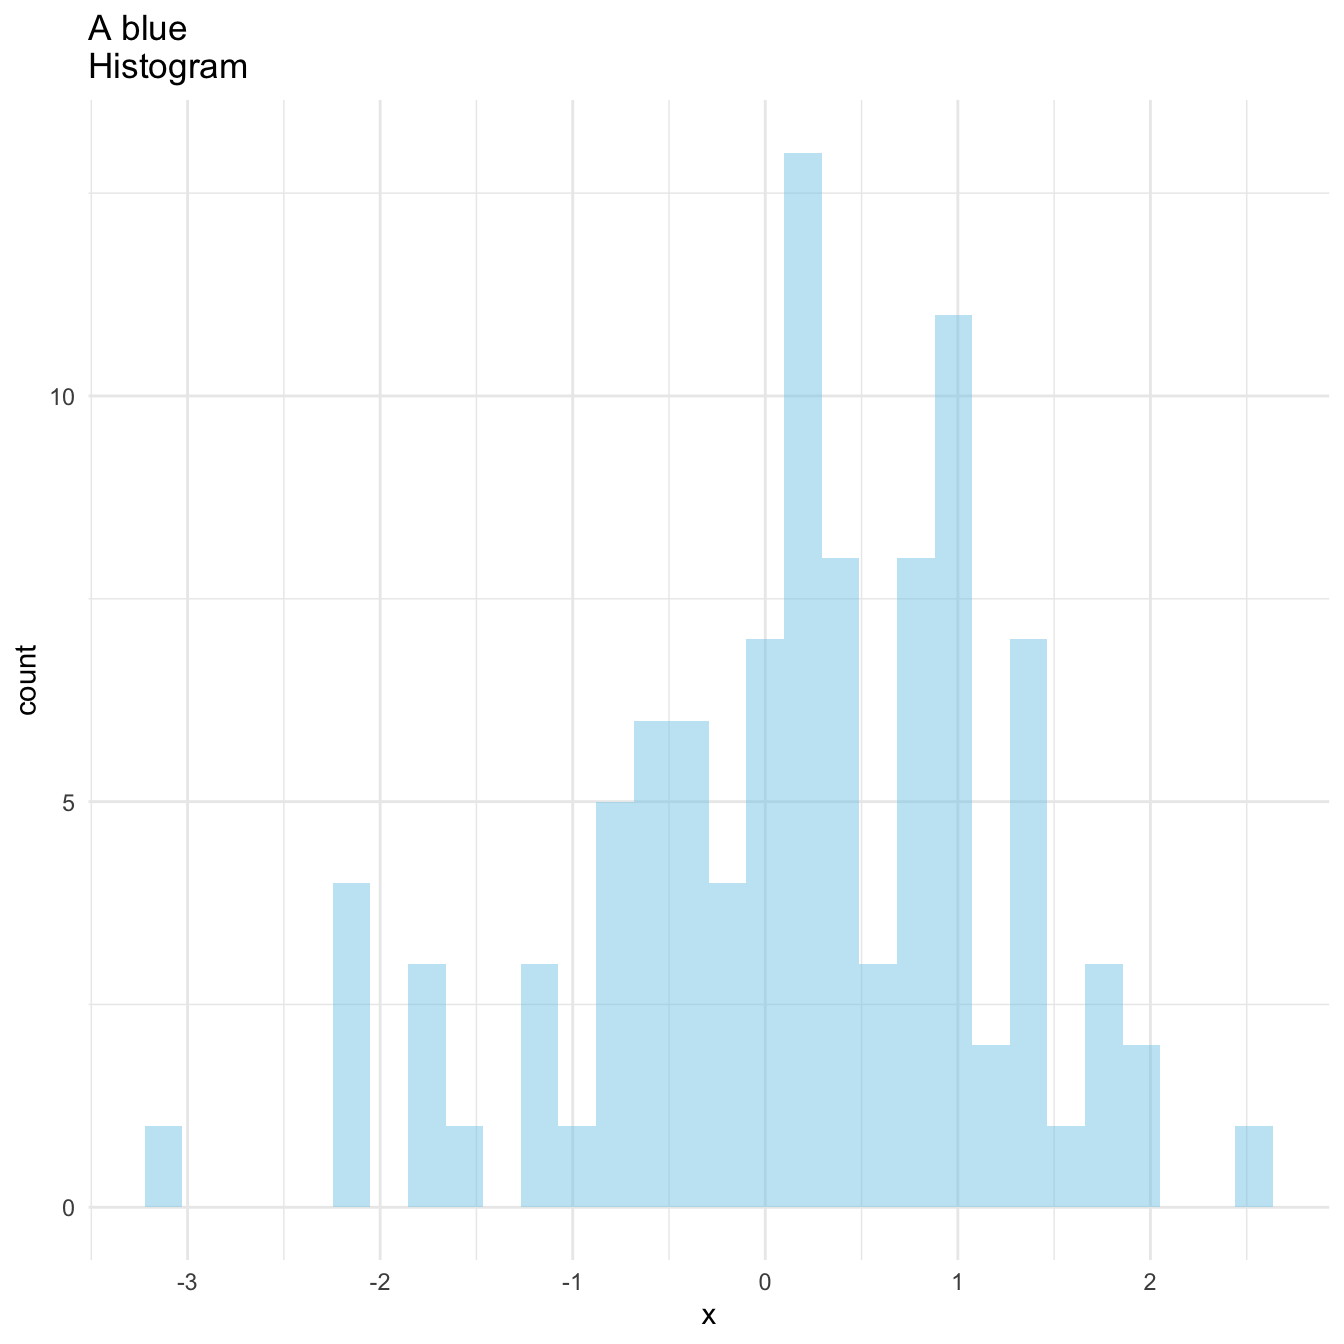
# title on several lines
ggplot( data=data, aes(x=x)) +
  geom_histogram(fill="skyblue", alpha=0.5) +
  ggtitle("A blue \nHistogram") +
  theme_minimal()
Title appearance and position
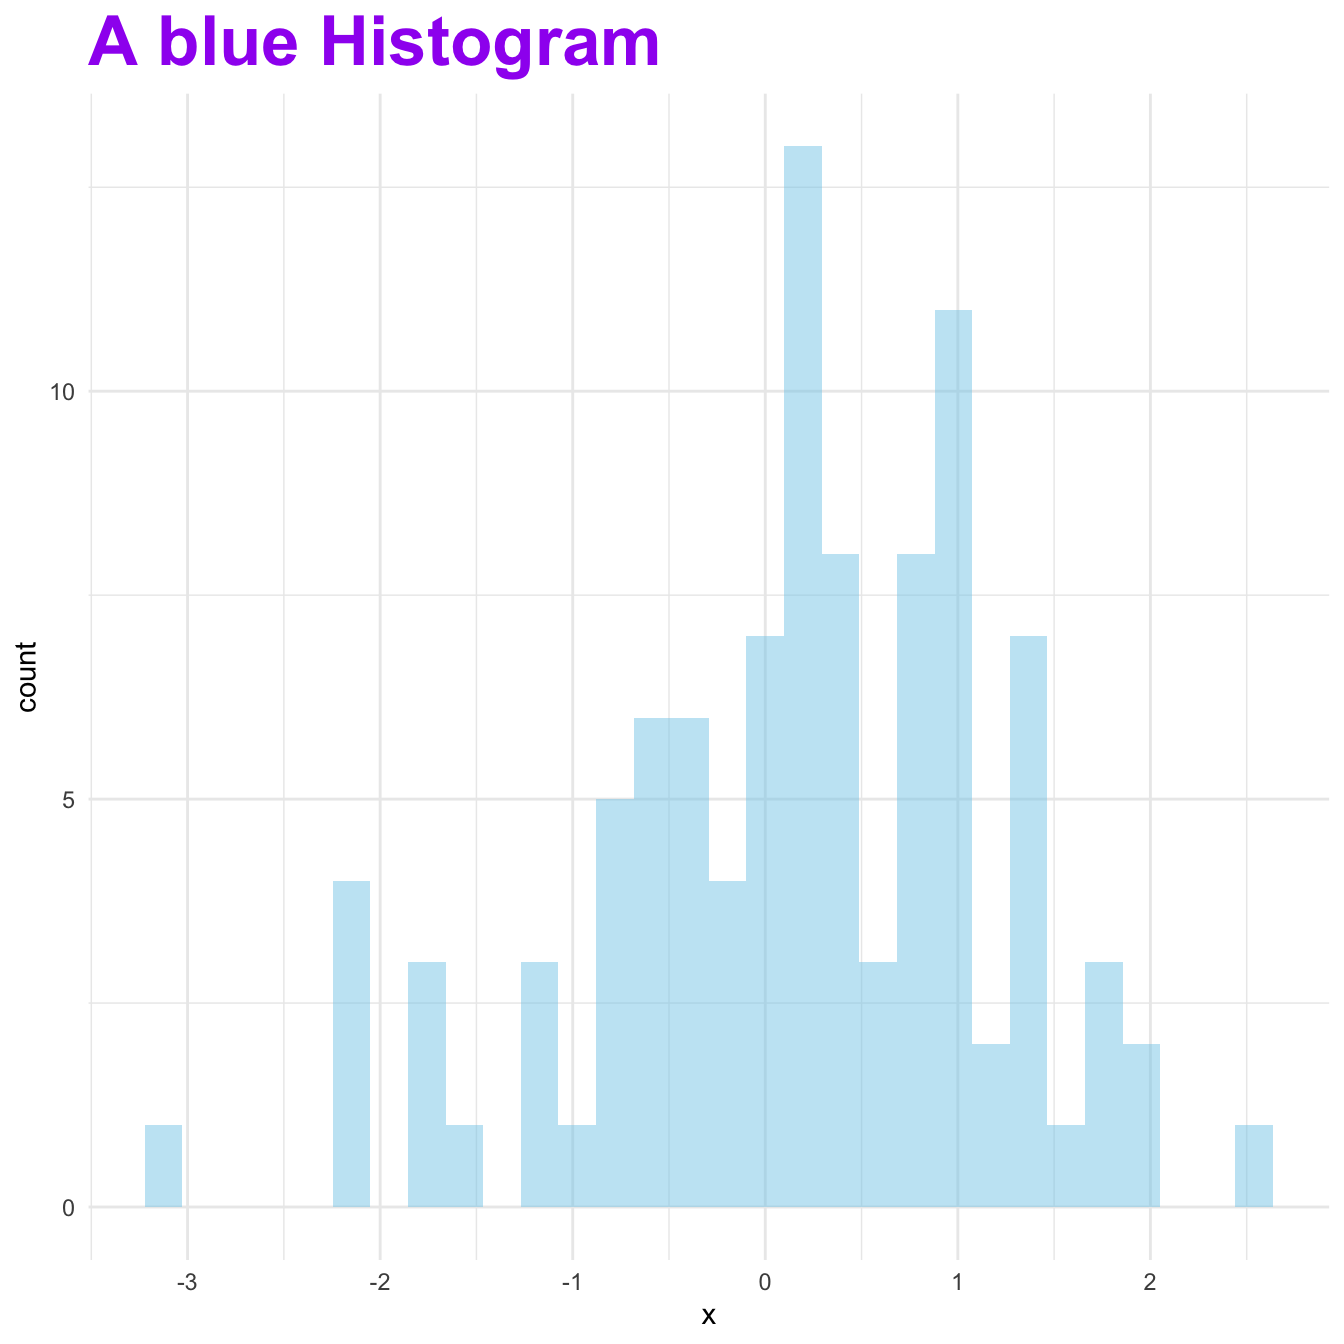
Here are 2 tricks to control text appearance and its position. Both
features are controled thanks to the plot.title argument of
the theme() function. Appearance can be controlled with
option such as family, size or
color, when position is controlled with
hjust and vjust.
# Custom title appearance
ggplot( data=data, aes(x=x)) +
geom_histogram(fill="skyblue", alpha=0.5) +
ggtitle("A blue Histogram") +
theme_minimal() +
theme(
plot.title=element_text(family='', face='bold', colour='purple', size=26)
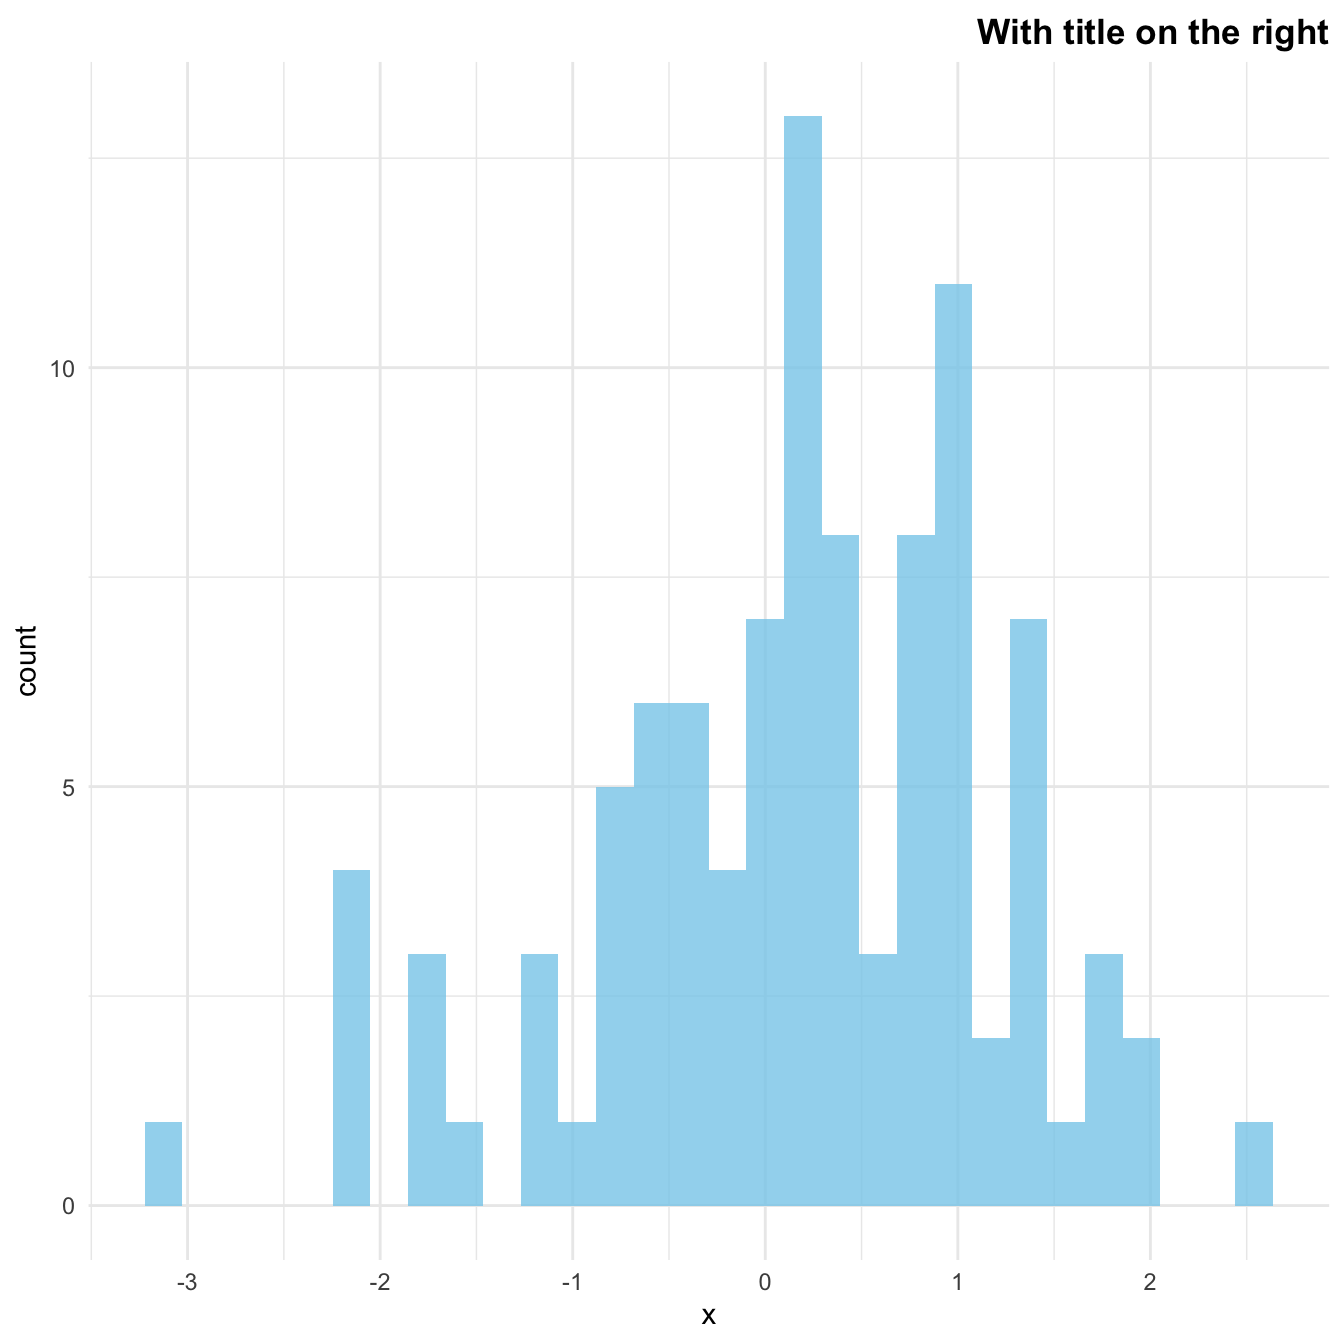
)# Adjust the position of title
ggplot( data=data, aes(x=x)) +
geom_histogram(fill="skyblue", alpha=0.8) +
ggtitle("With title on the right") +
theme_minimal() +
theme(
plot.title=element_text( hjust=1, vjust=0.5, face='bold')
)Customize a specific word only
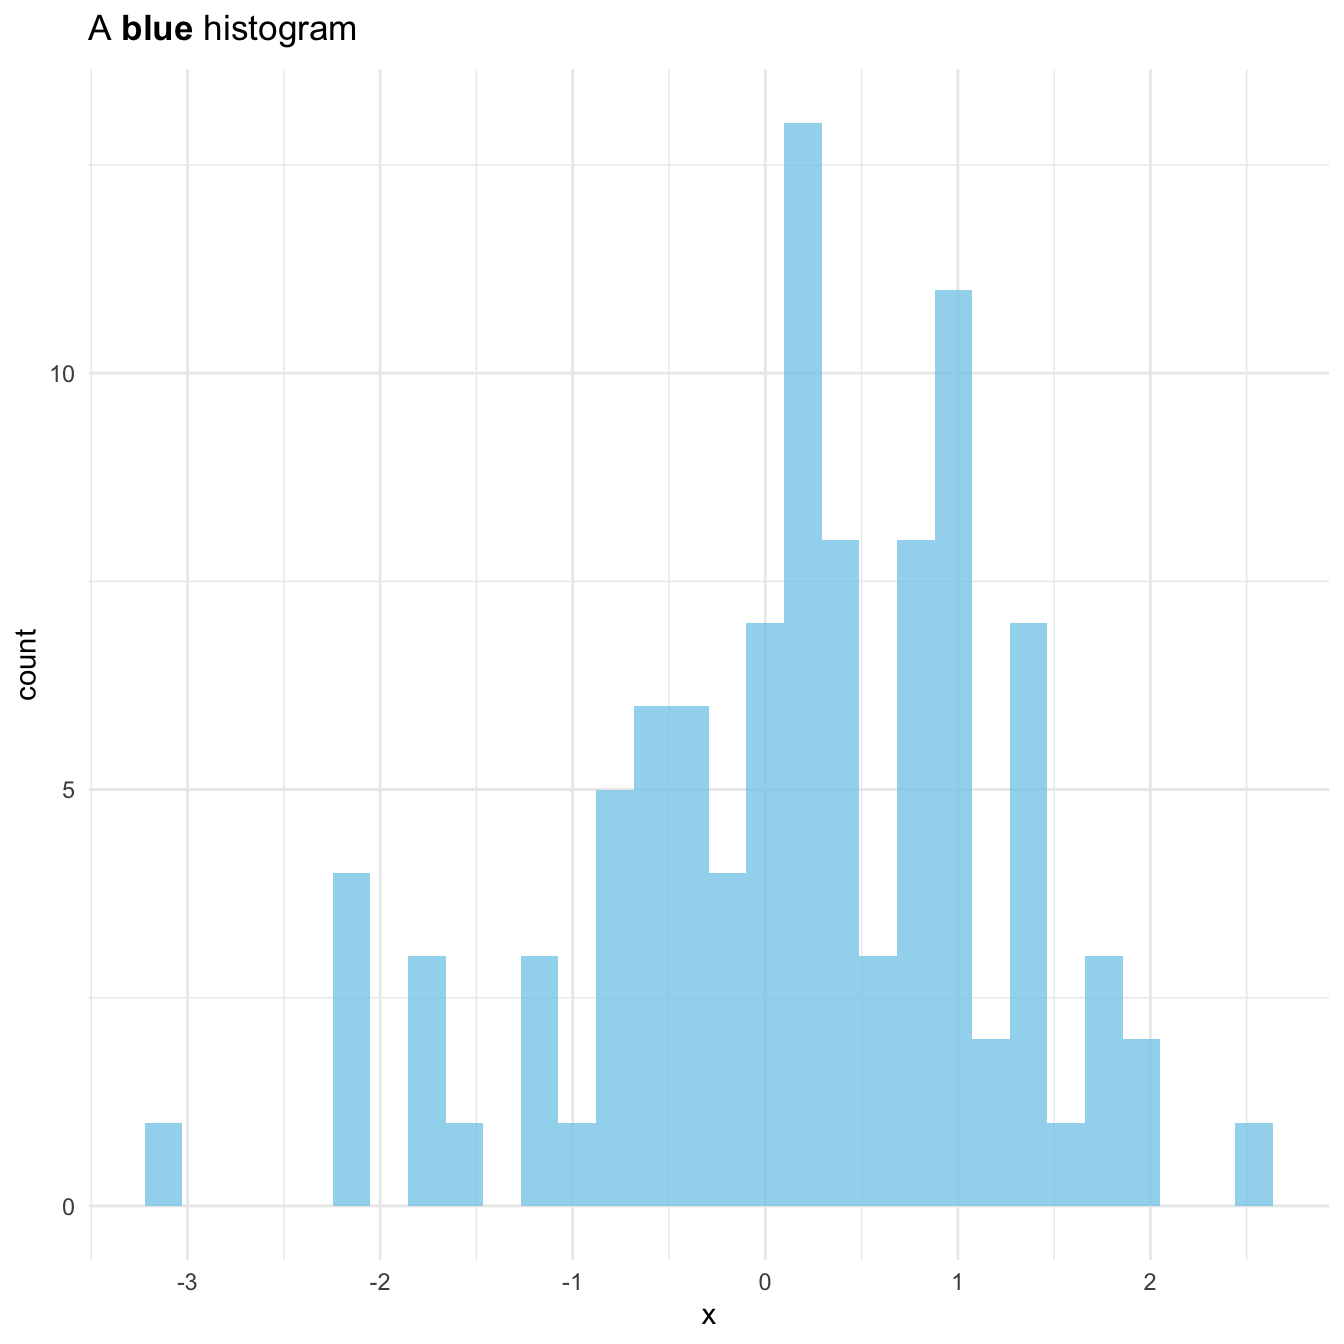
If you want to highlight a specific set of words in the title, it is
doable thanks to the expression() function.