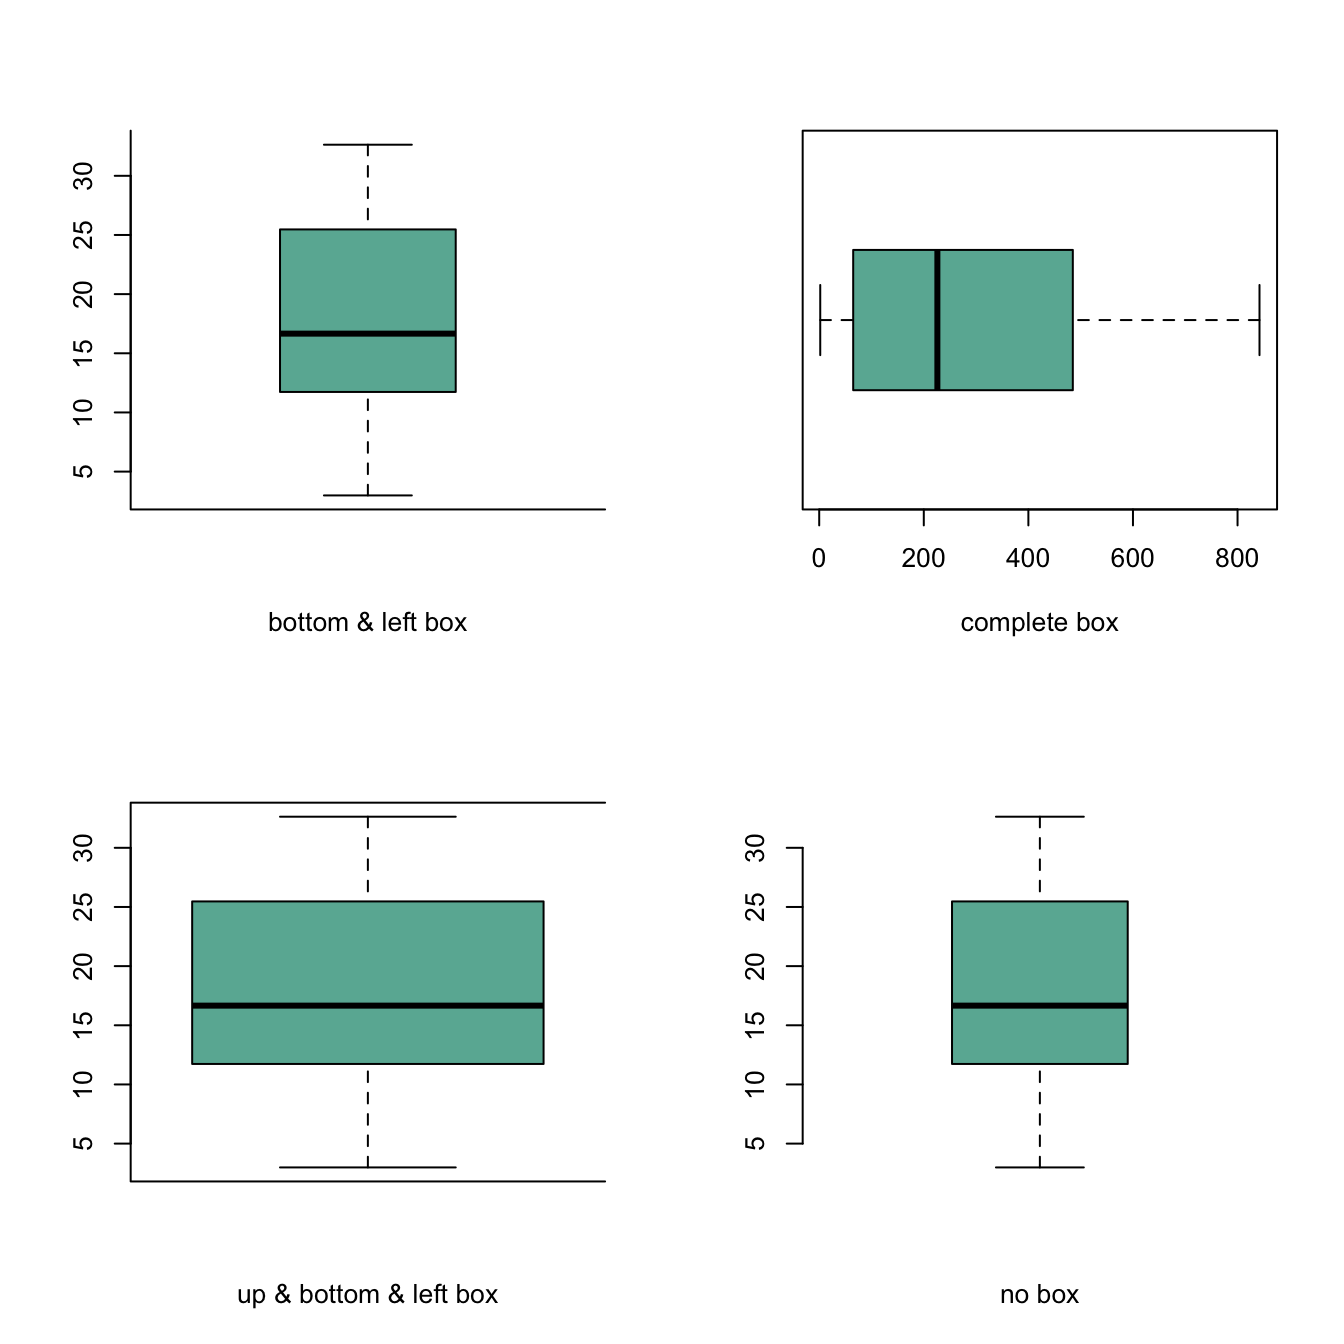
The bty option of the par() function
allows to custom the box around the plot.
Several letters are possible. Shape of the letter represents the boundaries:
o: complete box (default parameter),n: no box7: top + rightL: bottom + leftC: top + left + bottomU: left + bottom + right
# Cut the screen in 4 parts
par(mfrow=c(2,2))

#Create data
a=seq(1,29)+4*runif(29,0.4)
b=seq(1,29)^2+runif(29,0.98)

# First graph
par(bty="l")
boxplot(a , col="#69b3a2" , xlab="bottom & left box")
# Second
par(bty="o")
boxplot(b , col="#69b3a2" , xlab="complete box", horizontal=TRUE)
# Third
par(bty="c")
boxplot(a , col="#69b3a2" , xlab="up & bottom & left box", width=0.5)
# Fourth
par(bty="n")
boxplot(a , col="#69b3a2" , xlab="no box")