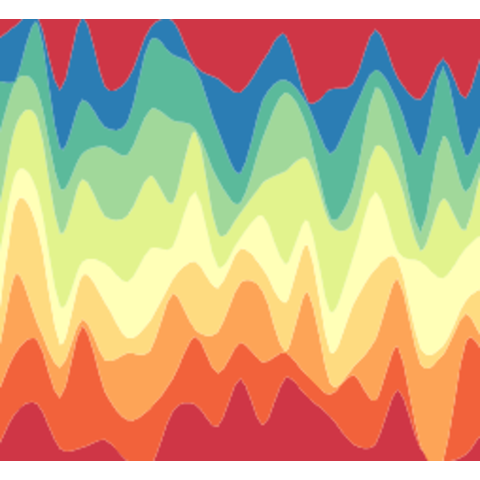
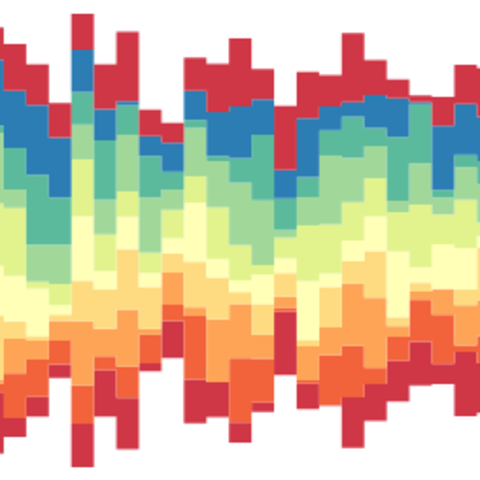
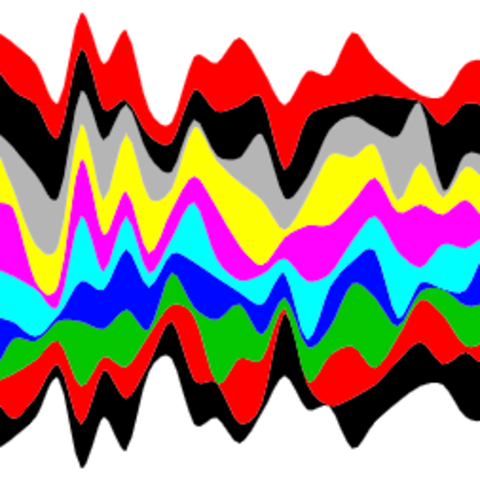
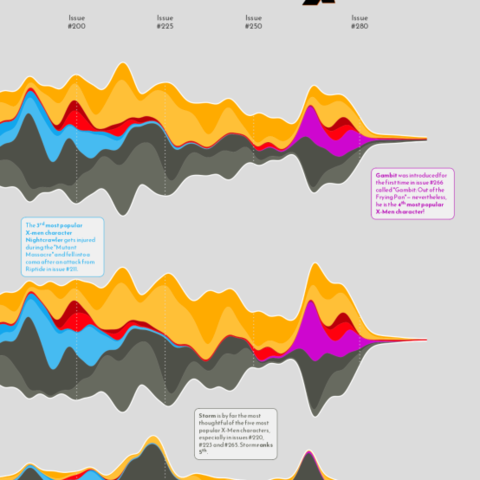
<!doctype html> <html lang="en"> <head> <!-- Google Analytics + AdThrive --> <!-- AdThrive Head Tag Manual --> <script data-no-optimize="1" data-cfasync="false"> (function (w, d) { w.adthrive = w.adthrive || {}; w.adthrive.cmd = w.adthrive.cmd || []; w.adthrive.plugin = "adthrive-ads-manual"; w.adthrive.host = "ads.adthrive.com"; var s = d.createElement("script"); s.async = true; s.referrerpolicy = "no-referrer-when-downgrade"; s.src = "https://" + w.adthrive.host + "/sites/6434363fc11d8059e61106b4/ads.min.js?referrer=" + w.encodeURIComponent(w.location.href) + "&cb=" + (Math.floor(Math.random() * 100) + 1); var n = d.getElementsByTagName("script")[0]; n.parentNode.insertBefore(s, n); })(window, document); </script> <!-- End of AdThrive Head Tag --> <script async src="https://www.googletagmanager.com/gtag/js?id=UA-79254642-1" ></script> <script> window.dataLayer = window.dataLayer || []; function gtag() { dataLayer.push(arguments); } gtag("js", new Date()); gtag("config", "UA-79254642-1"); </script> <!-- Google Analytics + OutboundLink + Google Adsense --> <meta charset="utf-8" /> <title>Streamgraph | the R Graph Gallery</title> <meta name="viewport" content="width=device-width, initial-scale=1, shrink-to-fit=no" /> <meta name="description" content="How to build streamgraphs with R: from the most basic example to highly customized examples." /> <meta name="keywords" content="Data,Dataviz,Datavisualization,Javascript,R,tidyverse,ggplot2,streamchart,streamgraph" /> <meta name="author" content="Yan Holtz" /> <link rel="icon" href="img/logo/R_single_small.png" /> <meta property="og:title" content="Streamgraph | the R Graph Gallery" /> <meta property="og:image" content="https://www.r-graph-gallery.com/img/overview_RGG.png" /> <meta property="og:description" content="How to build streamgraphs with R: from the most basic example to highly customized examples." /> <!-- Bootstrap core CSS --> <link href="vendor/bootstrap/css/bootstrap.min.css" rel="stylesheet" /> <!-- Custom fonts for this template --> <link href="vendor/font-awesome/css/font-awesome.min.css" rel="stylesheet" type="text/css" /> <!-- Custom styles for this template --> <link href="css/agency.css" rel="stylesheet" /> <!-- JQUERY --> <script src="vendor/jquery/jquery.min.js"></script> </head> <body id="page-top"> <!-- THIS ALLOWS TO INSERT THE MENU THAT IS STORED IN A MENU.HTML FILE--> <nav class="navbar navbar-expand-lg fixed-top" id="mainNav"></nav> <script> $(function () { $("#mainNav").load("html_chunk/menu.html"); }); </script> <!-- THIS ALLOWS TO INSERT THE MODAL OF THE MENU THAT IS STORED IN A MENU_MODAL.HTML FILE--> <div id="modal_menu_insertion"></div> <script> $(function () { $("#modal_menu_insertion").load("html_chunk/menu_modal.html"); }); </script> <div id="modal_subscribe_insertion"></div> <script> $(function () { $("#modal_subscribe_insertion").load("html_chunk/subscribe_modal.html"); }); </script> <!-- Header --> <header class="masthead" style="padding-top: 150px; padding-bottom: 80px"> <div class="textlanding"> <h1>Streamgraph</h1> <hr class="short_hr" /> <p></p> <br /> <ul class="list-inline social-buttons"> <li class="list-inline-item"> <a href="https://twitter.com/R_Graph_Gallery"> <i class="fa fa-twitter"></i> </a> </li> <li class="list-inline-item social-buttons"> <a href="https://github.com/holtzy"> <i class="fa fa-github" style="color: white"></i> </a> </li> <li class="list-inline-item social-buttons"> <a href="https://www.linkedin.com/in/yan-holtz-2477534a/"> <i class="fa fa-linkedin"></i> </a> </li> <li class="list-inline-item social-buttons"> <a href="https://www.yan-holtz.com"> <i class="fa fa-home"></i> </a> </li> </ul> <br /><br /> <p style="max-width: 700px; margin: auto"> A <a href="https://www.data-to-viz.com/graph/streamgraph.html" >streamgraph</a > is a type of <a href="stacked-area-graph.html">stacked area chart</a>. It represents the evolution of a numeric variable for several groups. Areas are usually displayed around a central axis, and edges are rounded to give a flowing shape. </p> </div> </header> <!-- THIS ALLOWS TO INSERT THE ADVERTISEMENT BANNER THAT IS STORED IN A BANNER.HTML FILE--> <div id="position_for_images"></div> <script> $(function () { $("#position_for_images").load("html_chunk/images.html"); }); </script> <!-- ======================== PORTFOLIO SECTION ============================ --> <!-- Images must be 480 x 480, resize them with ./script_reformat_img.sh output_name.png --> <section class="bg" id="portfolio" style="padding-top: 10px"> <div class="container"> <div class="mySeryTitle"> Step by step: the <code>streamgraph</code> package. </div> <hr /> <p> It is relatively straightforward to build a streamgraph in R thanks to the <code>streamgraph</code> package. </p> <br /><br /> <div id="portfolio-items" class="row"> <div class="col-md-4 col-sm-6 portfolio-item"> <a class="portfolio-link" href="154-basic-interactive-streamgraph-2.html" > <div class="portfolio-hover"> <div class="portfolio-hover-content"> <p>Most basic streamchart</p> <hr /> <p class="explanation_portfolio"> The most basic streamchart you can build with R and the streamgraph package. </p> </div> </div> <img class="img-fluid imgOfPortfolio" src="img/graph/154-basic-interactive-streamgraph-2.png" alt="" /> </a> </div> <div class="col-md-4 col-sm-6 portfolio-item"> <a class="portfolio-link" href="155-interactive-streamgraph-change-offset.html" > <div class="portfolio-hover"> <div class="portfolio-hover-content"> <p>Change offset</p> <hr /> <p class="explanation_portfolio"> By default a streamchart is displayed all around a horizontal line. You can change that thanks to the offset option </p> </div> </div> <img class="img-fluid imgOfPortfolio" src="img/graph/155-interactive-streamgraph-change-offset.png" alt="" /> </a> </div> <div class="col-md-4 col-sm-6 portfolio-item"> <a class="portfolio-link" href="157-interactive-streamchart-change-shape.html" > <div class="portfolio-hover"> <div class="portfolio-hover-content"> <p>Change shape</p> <hr /> <p class="explanation_portfolio"> Leave the smooth and rounded option to get something similar to a stacked area chart or to a stacked barplot. </p> </div> </div> <img class="img-fluid imgOfPortfolio" src="img/graph/157-interactive-streamchart-change-shape.png" alt="" /> </a> </div> <div class="col-md-4 col-sm-6 portfolio-item"> <a class="portfolio-link" href="158-change-color-in-interactive-streamgraph.html" > <div class="portfolio-hover"> <div class="portfolio-hover-content"> <p>Change color</p> <hr /> <p class="explanation_portfolio"> Several ways to change the color palette used on the chart. </p> </div> </div> <img class="img-fluid imgOfPortfolio" src="img/graph/158-change-color-in-interactive-streamgraph.png" alt="" /> </a> </div> </div> <br /><br /><br /><br /> <div class="mySeryTitle">Interactivity</div> <hr /> <p> The <code>streamgraph</code> package is a html widget. It means that your output will automatically be interactive. Hover a group to highlight it, get its name and its exact value. If for some reason you need to export it to <code>png</code> or <code>pdf</code>, it is possible thanks to the <a href="159-save-interactive-streamgraph-to-static-image-png.html" >webshot</a > package. </p> <a class="btn btn-secondary btn-md text-uppercase" href="159-save-interactive-streamgraph-to-static-image-png.html" >How to export to .png</a > <a class="btn btn-secondary btn-md text-uppercase" href="156-interactive-streamgraph-with-legend.html" >Chart code</a > <center> <iframe src="HtmlWidget/streamgraphDropdown.html" height="400" width="80%" style="border: none" ></iframe> </center> </div> </section> <!-- ======================================================================= --> <!-- ======================== FROM THE WEB SECTION ============================ --> <section class="bg" id="portfolio" style="padding-top: 10px"> <div class="container"> <div class="mySeryTitle">🌐 From the web</div> <hr /> <p> The web is full of astonishing R charts made by awesome bloggers. The <a href="https://www.r-graph-gallery.com">R graph gallery</a> tries to display some of the best creations and explain how their source code works. If you want to display your work here, please drop me a word or even better, submit a <a href="https://github.com/holtzy/R-graph-gallery">Pull Request</a>! </p> <div id="portfolio-items" class="row"> <div class="col-md-4 col-sm-6 portfolio-item"> <a class="portfolio-link" href="web-streamchart-with-ggstream.html"> <div class="portfolio-hover"> <div class="portfolio-hover-content"> <p>ggStream</p> <hr /> <p class="explanation_portfolio"> <code>ggStream</code> is a ggplot2 extension allowing to make stream graph with the tidyverse. Here is an example by Cédric Scherer showcasing how to use this package. </p> </div> </div> <img class="img-fluid imgOfPortfolio" src="img/fromTheWeb/web-streamchart-with-ggstream-square.png" alt="A streamgraph built with R and the ggStream package" /> </a> </div> <div class="col-md-4 col-sm-6 portfolio-item"> <a class="portfolio-link" href="web-stacked-area-chart-inline-labels.html" > <div class="portfolio-hover"> <div class="portfolio-hover-content"> <p>Stacked area chart with clean labels</p> <hr /> <p class="explanation_portfolio"> A stacked area chart with a stunning color palette, some well positioned inline labels, some handy vertical annotations and some clean caption text. </p> </div> </div> <img class="img-fluid imgOfPortfolio" src="img/fromTheWeb/web-stacked-area-chart-inline-labels.png" alt="" /> </a> </div> </div> </div> </section> <!-- ======================================================================= --> <!-- ============================ RELATED SECTION ============================ --> <section class="bg-light" id="portfolio_landing" style="padding-top: 30px; padding-bottom: 30px; margin-top: 100px" > <div class="container"> <p class="mySeryTitle">Related chart types</p> <hr /> <div class="row"> <div class="col-md-2 col-sm-4 portfolio-item"> <a class="portfolio-link" href="line-plot.html"> <div class="portfolio-hover"> <div class="portfolio-hover-content"> <i class="fa fa-plus fa-3x"></i> </div> </div> <img class="img-fluid" src="img/section/Line150.png" alt="" /> </a> <div class="captionPortfolio">Line plot</div> </div> <div class="col-md-2 col-sm-4 portfolio-item"> <a class="portfolio-link" href="area-chart.html"> <div class="portfolio-hover"> <div class="portfolio-hover-content"> <i class="fa fa-plus fa-3x"></i> </div> </div> <img class="img-fluid" src="img/section/Area150.png" alt="" /> </a> <div class="captionPortfolio">Area</div> </div> <div class="col-md-2 col-sm-4 portfolio-item"> <a class="portfolio-link" href="stacked-area-graph.html"> <div class="portfolio-hover"> <div class="portfolio-hover-content"> <i class="fa fa-plus fa-3x"></i> </div> </div> <img class="img-fluid" src="img/section/StackedArea150.png" alt="" /> </a> <div class="captionPortfolio">Stacked area</div> </div> <div class="col-md-2 col-sm-4 portfolio-item"> <a class="portfolio-link" href="streamgraph.html"> <div class="portfolio-hover"> <div class="portfolio-hover-content"> <i class="fa fa-plus fa-3x"></i> </div> </div> <img class="img-fluid" src="img/section/Stream150.png" alt="" /> </a> <div class="captionPortfolio">Streamchart</div> </div> <div class="col-md-2 col-sm-4 portfolio-item"> <a class="portfolio-link" href="time-series.html"> <div class="portfolio-hover"> <div class="portfolio-hover-content"> <i class="fa fa-plus fa-3x"></i> </div> </div> <img class="img-fluid" src="img/section/Time150.gif" alt="" /> </a> <div class="captionPortfolio">Time Series</div> </div> </div> </div> </section> <!-- ============================ CONTACT SECTION ============================ --> <!-- ANCHOR --> <a name="contactanchor"></a> <section id="contact" class="bg" style="background-color: white"></section> <!-- THIS ALLOWS TO INSERT THE CONTACT CHUNK THAT IS STORED IN A CONTACT.HTML FILE--> <script> $(function () { $("#contact").load("html_chunk/contact.html"); }); </script> <!-- ============================ FOOTER SECTION ============================ --> <!-- AdThrive Footer Code Start--> <script type="text/javascript" async src="https://btloader.com/tag?o=5698917485248512&upapi=true&domain=r-graph-gallery.com" ></script> <script> !(function () { "use strict"; var e; (e = document), (function () { var t, n; function r() { var t = e.createElement("script"); (t.src = "https://cafemedia-com.videoplayerhub.com/galleryplayer.js"), e.head.appendChild(t); } function a() { var t = e.cookie.match("(^|[^;]+)\s*__adblocker\s*=\s*([^;]+)"); return t && t.pop(); } function c() { clearInterval(n); } return { init: function () { var e; "true" === (t = a()) ? r() : ((e = 0), (n = setInterval(function () { (100 !== e && "false" !== t) || c(), "true" === t && (r(), c()), (t = a()), e++; }, 50))); }, }; })().init(); })(); </script> <!-- AdThrive Footer Code End --> <footer class="bg-light" id="myFooter"></footer> <!-- THIS ALLOWS TO INSERT THE FOOTER THAT IS STORED IN A FOOTER.HTML FILE--> <script> $(function () { $("#myFooter").load("html_chunk/footer.html"); }); </script> <!-- ============================ --> <!-- =============== JAVASCRIPT SECTION =============== --> <!-- Bootstrap core JavaScript --> <script src="vendor/bootstrap/js/bootstrap.bundle.min.js"></script> <!-- Plugin JavaScript --> <script src="vendor/jquery-easing/jquery.easing.min.js"></script> <!-- Custom scripts for this template --> <script src="js/agency.min.js"></script> <!--============================== --> </body> </html>