Database Query Statistics Guide
Introduction
Openfire uses a database for much of its persistent storage, as well as to store some state changes. Out of the box, Openfire's database schema and usage is optimized for maximum performance. However, due environment specific issues may limit the performance of individual instances. Furthermore, custom plugins are a frequent source of inefficient database interaction.
When Openfire is suffering from database performance issues, user-perceived performance is often affected. In extreme cases, errors cause data inconsistency, leading to a wide range of errors.
Openfire's Admin Console provides a basic analysis tool that can help identify problematic database queries. This tool, the subject of this guide, can be used to supplement the diagnostic tooling made available by the vendor of the database that is in use.
This document describes:
Enabling Database Query Statistics
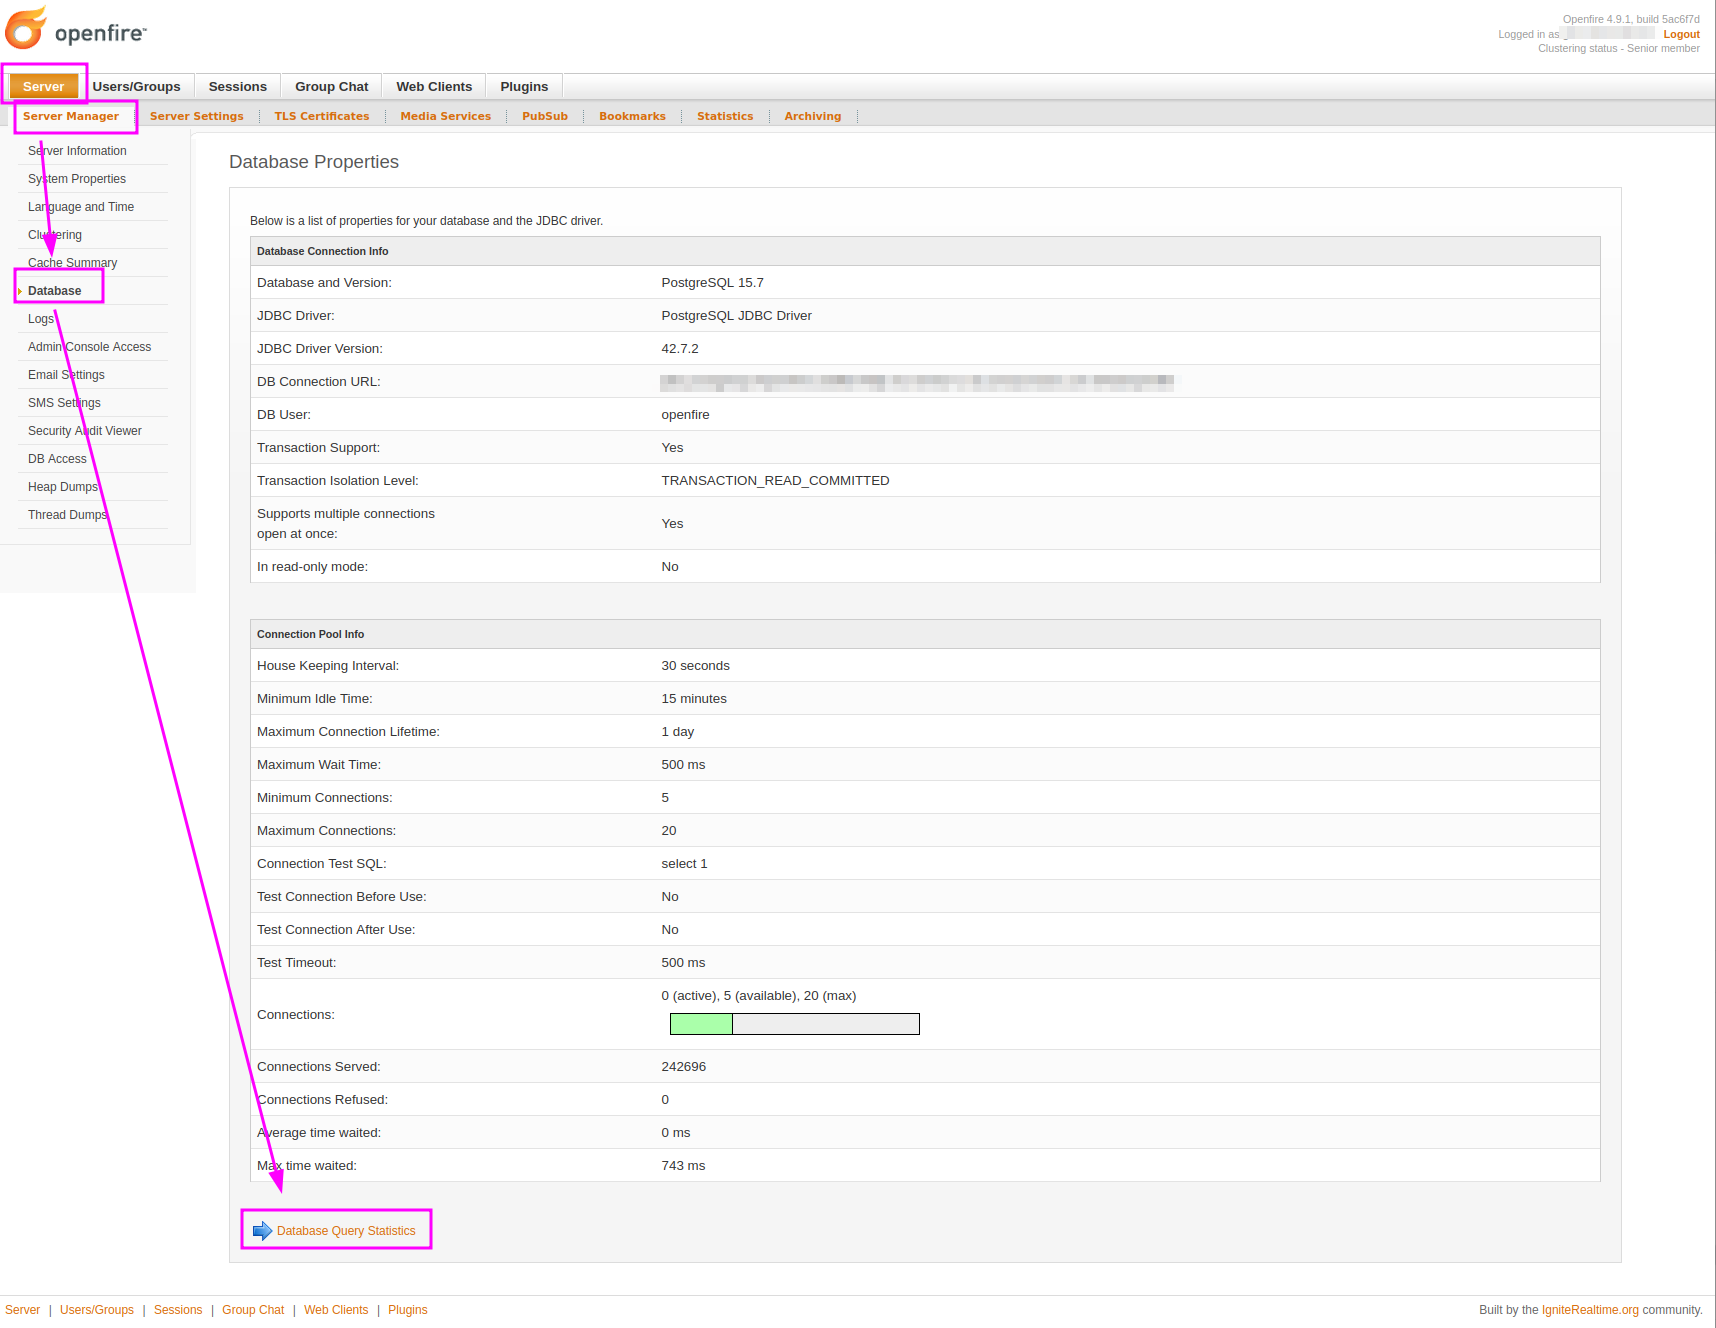
The Database Query Statistics are controlled in the Openfire Admin Console. You can find the functionality under "Server", then "Server Manager", then "Database". On the bottom of that page, a link to the Database Query Statistics is provided.
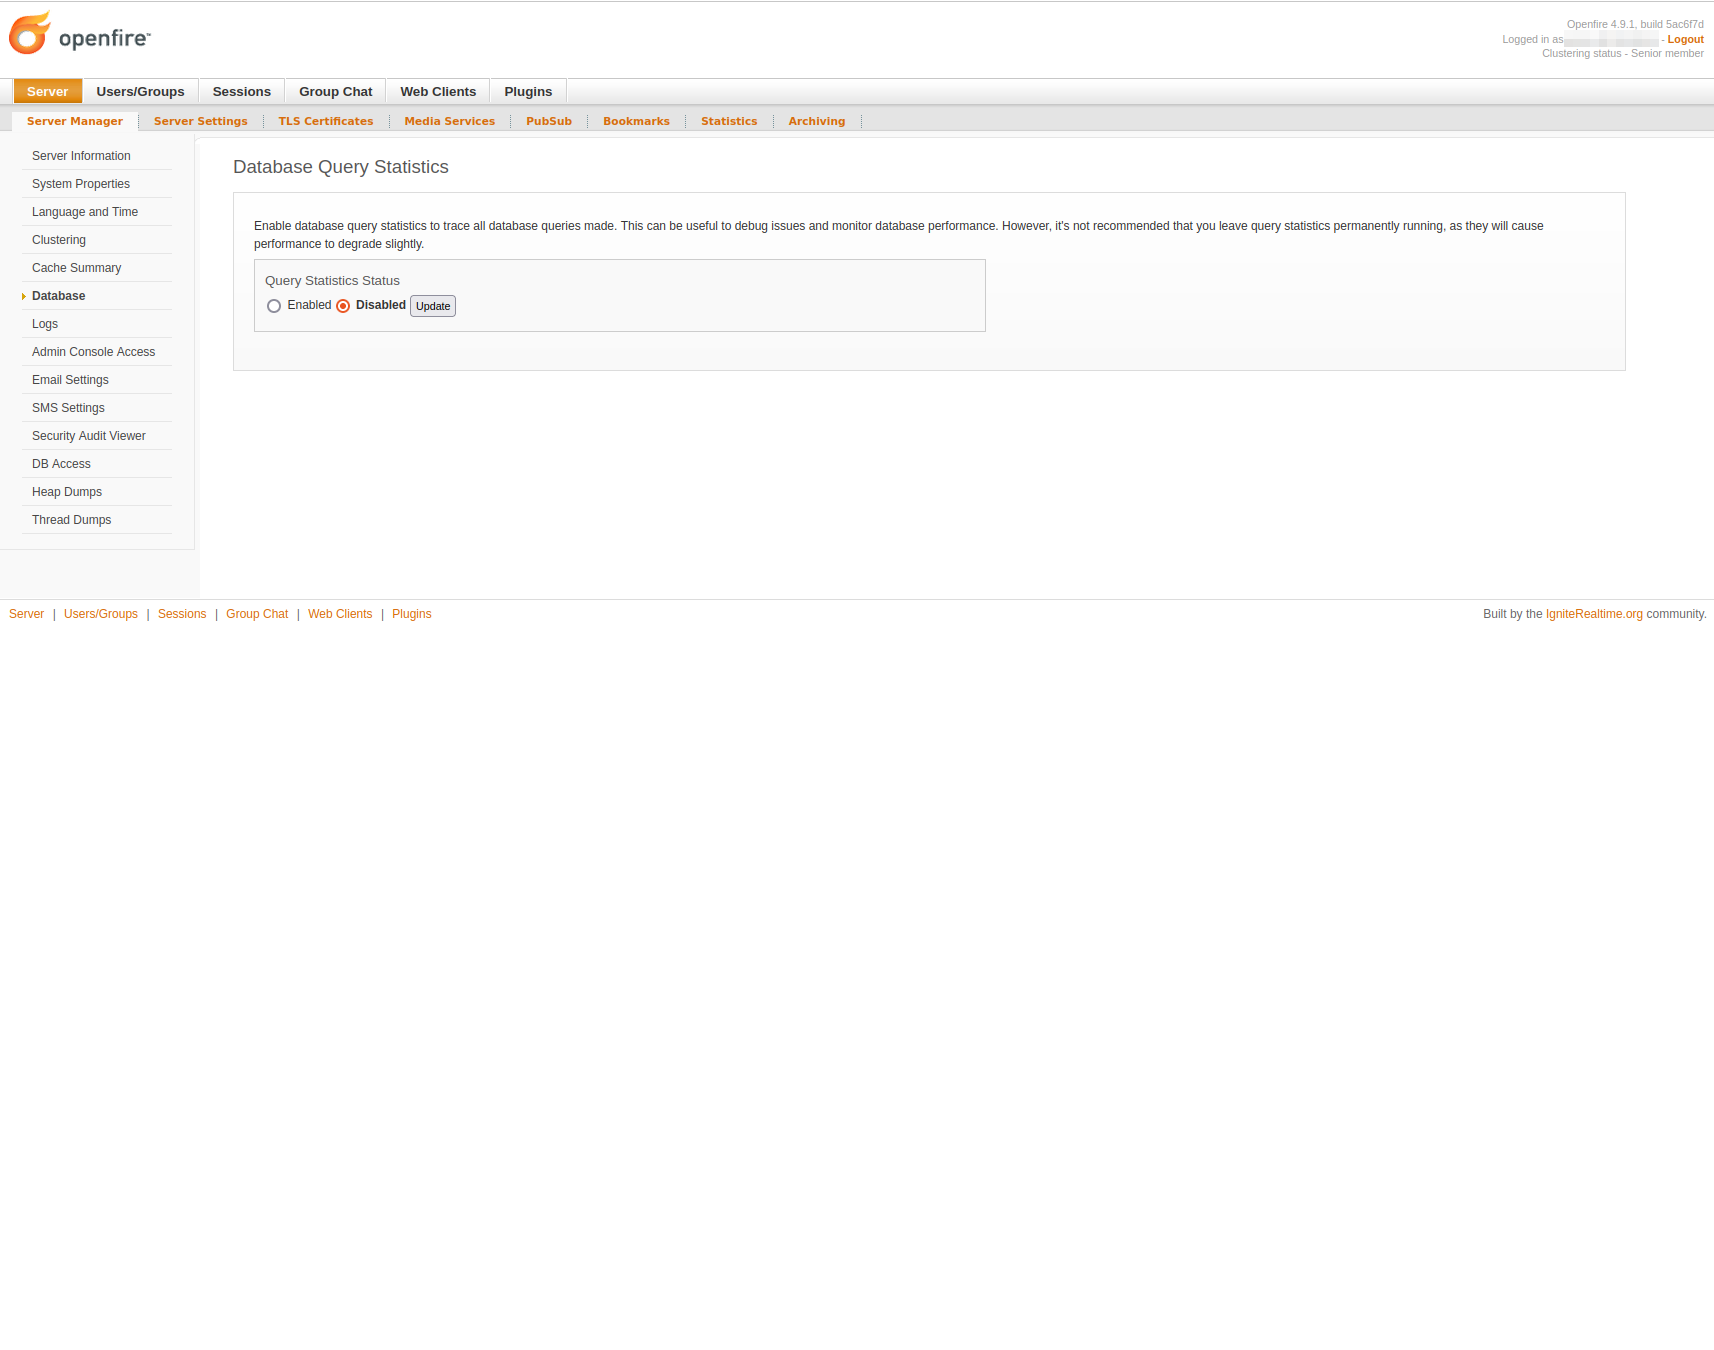
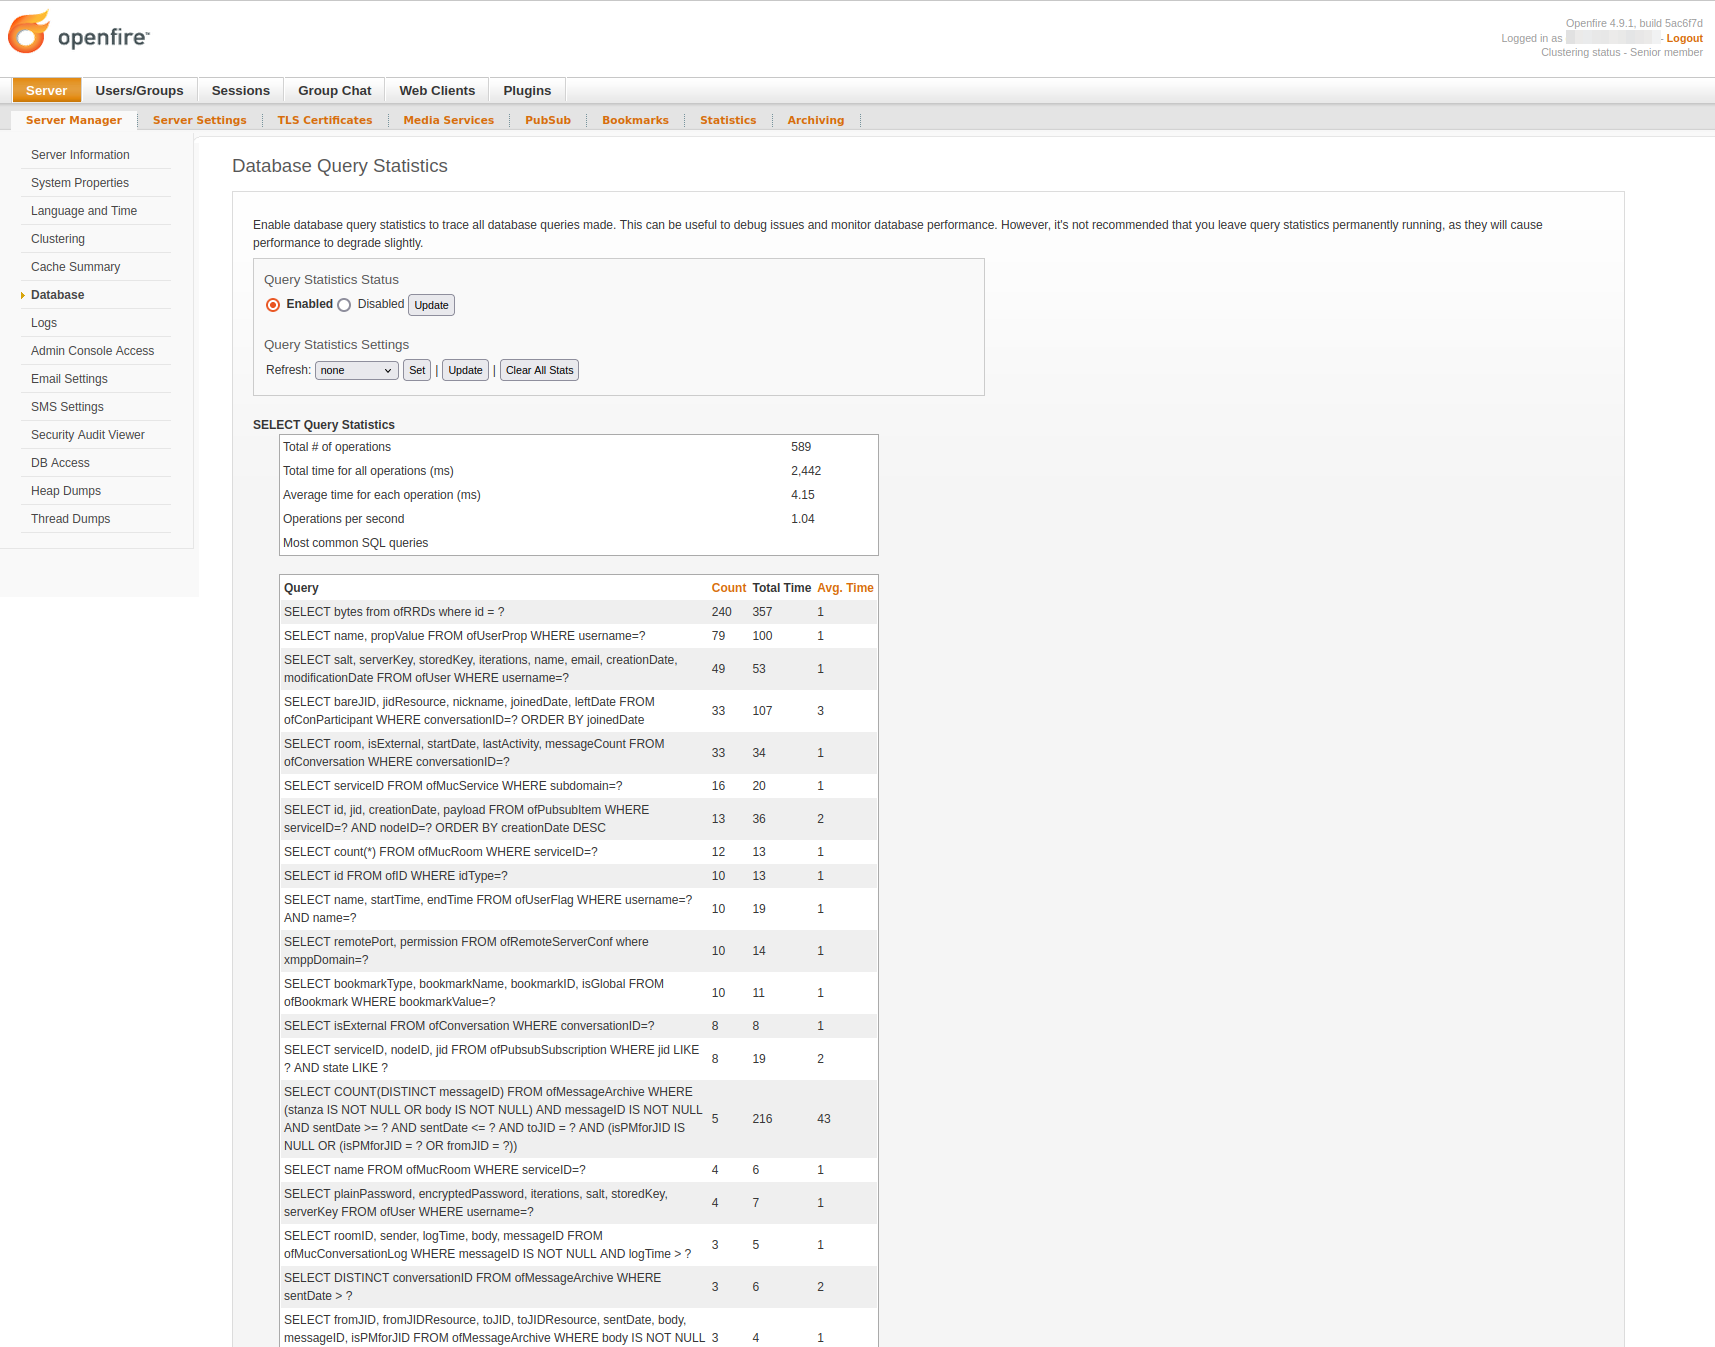
To enable collection of statistics, check "Enabled", then click the "Update" button be pressed. After that, statistics collection commences immediately until the feature is disabled again. Note that the page does not automatically refresh to show changes in the statistics, unless the 'refresh' option is used.


Please be aware that the collection of query statistics adds some overhead. Although this is mostly negligible, it is not recommended leaving the statistics collections running for extended periods of time.
How to read the collected statistics?
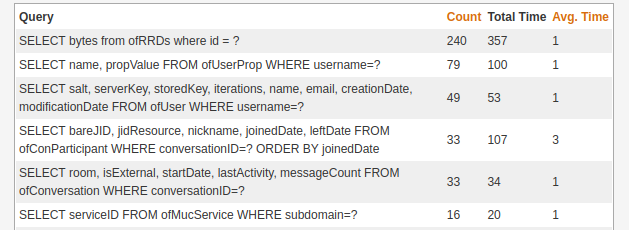
Once enabled, the Database Query Statistics will group the database queries that are executed by Openfire. For each query, the following data is collected:
- Count
- The number of times the query has been invoked
- Total Time
- The execution time of all invocations of the query combined (in milliseconds)
- Average Time
- The average execution time of the query, in milliseconds (i.e. the Total Time divided by the Count)
The information describes the query statistics since the last time query statistics collection was enabled.


Interpretation of the results can require some knowledge of the inner workings of Openfire and the database, although some generic observations hold true for most queries:
- As a rule of thumb, the Average Time for queries should be less than 10.
- Queries that have a higher Average Time are typically more problematic than queries with a higher Count.
- A combination of a high Average Time and a high Count is particularly worrying.
Based on these guidelines, optimizations can be applied to your database. When badly-performing queries are defined by Openfire itself (as opposed to Openfire customizations, such as plugins), then an increase in the resources available to your database server may be in order. The Ignite Realtime community typically ensures that the proper database indices are in place. If you do find that an addition database index is alleviating issues, we would love to hear from you!
When queries with poor statistics originate from your proprietary code, consider the following:
- Can the number of invocations be reduced, for example by introducing a form of caching to your code?
- Can the SQL of your queries be optimized?
- Can database indexes be added that speed up the execution time?
It is not always straightforward to apply improvements to custom code. If you need professional support or services, please see our directory of professional partners.