{
"cells": [
{
"cell_type": "markdown",
"metadata": {},
"source": [
"# Tutorial on advanced features"
]
},
{
"cell_type": "code",
"execution_count": null,
"metadata": {
"jupyter": {
"outputs_hidden": false
},
"pycharm": {
"name": "#%%\n"
}
},
"outputs": [],
"source": [
"from IPython.core.display import HTML, display\n",
"\n",
"display(HTML(\"\"))\n",
"display(HTML(\"\"))"
]
},
{
"cell_type": "code",
"execution_count": null,
"metadata": {},
"outputs": [],
"source": [
"# install popmon (if not installed yet)\n",
"import sys\n",
"\n",
"!\"{sys.executable}\" -m pip install -q popmon"
]
},
{
"cell_type": "code",
"execution_count": null,
"metadata": {},
"outputs": [],
"source": [
"import pandas as pd\n",
"\n",
"import popmon\n",
"from popmon import resources\n",
"from popmon.config import Report, Settings"
]
},
{
"cell_type": "markdown",
"metadata": {},
"source": [
"# Data generation\n",
"Let's first load some data!"
]
},
{
"cell_type": "code",
"execution_count": null,
"metadata": {},
"outputs": [],
"source": [
"df = pd.read_csv(\n",
" resources.data(\"flight_delays.csv.gz\"), index_col=0, parse_dates=[\"DATE\"]\n",
")"
]
},
{
"cell_type": "markdown",
"metadata": {},
"source": [
"# Simple report\n",
"Now we can go ahead and generate our first report!"
]
},
{
"cell_type": "code",
"execution_count": null,
"metadata": {
"scrolled": true
},
"outputs": [],
"source": [
"df.pm_stability_report(time_axis=\"DATE\")"
]
},
{
"cell_type": "markdown",
"metadata": {},
"source": [
"If you inspect the report in the above example, you can see that for example for the maximum `departure_delay` on 2015-08-22 was more extreme than expected.\n",
"\n",
"The time axis is a bit weird now (split into 40 bins of 9 days each), but fortunately we can specify that ourselves using the `time_width` parameter! \n",
"We'll also set the `time_offset`, which we set equal to the first data in the document (otherwise we may end up with the first bin containing only half a week of data). \n",
"Finally, for the remaining examples, we'll use `extended_report=False` in order to keep the size of the notebook somewhat limited."
]
},
{
"cell_type": "code",
"execution_count": null,
"metadata": {},
"outputs": [],
"source": [
"settings = Settings(time_axis=\"DATE\")\n",
"settings.report.extended_report = False\n",
"\n",
"df.pm_stability_report(time_width=\"1w\", time_offset=\"2015-07-02\", settings=settings)"
]
},
{
"cell_type": "markdown",
"metadata": {},
"source": [
"Finally, we could make the thresholds used in the traffic lights more stringent. \n",
"For example, we could show the yellow traffic light for deviations bigger than 7 standard deviations, and the red traffic light for deviations bigger than 10 standard deviations."
]
},
{
"cell_type": "code",
"execution_count": null,
"metadata": {},
"outputs": [],
"source": [
"settings = Settings(time_axis=\"DATE\")\n",
"settings.report.extended_report = False\n",
"settings.monitoring.pull_rules = {\"*_pull\": [10, 7, -7, -10]}\n",
"\n",
"df.pm_stability_report(\n",
" time_width=\"1w\",\n",
" time_offset=\"2015-07-02\",\n",
" settings=settings,\n",
")"
]
},
{
"cell_type": "markdown",
"metadata": {},
"source": [
"There are quite a few more parameters in `pm_stability_report()`, for example to select which features to use (e.g. `features=['x']`), or how to bin the different features (`bin_specs={'x': {'bin_width': 1, 'bin_offset': 0}}`). \n",
"We suggest that you check them out on your own!\n",
"Have a look at the documentation for `popmon.pipeline.report.df_stability_report()` (which corresponds to `df.pm_stability_report()`).\n",
"\n",
"# What about Spark DataFrames?\n",
"No problem! We can easily perform the same steps on a Spark DataFrame. One important thing to note there is that we need to include two jar files (used to create the histograms using Histogrammar) when we create our Spark session. \n",
"These will be automatically downloaded the first time you run this command."
]
},
{
"cell_type": "code",
"execution_count": null,
"metadata": {},
"outputs": [],
"source": [
"# download histogrammar jar files if not already installed, used for histogramming of spark dataframe\n",
"try:\n",
" from pyspark import __version__ as pyspark_version\n",
" from pyspark.sql import SparkSession\n",
"\n",
" pyspark_installed = True\n",
"except ImportError:\n",
" print(\"pyspark needs to be installed for this example\")\n",
" pyspark_installed = False"
]
},
{
"cell_type": "code",
"execution_count": null,
"metadata": {},
"outputs": [],
"source": [
"if pyspark_installed:\n",
" scala = \"2.12\" if int(pyspark_version[0]) >= 3 else \"2.11\"\n",
" hist_jar = f\"io.github.histogrammar:histogrammar_{scala}:1.0.20\"\n",
" hist_spark_jar = f\"io.github.histogrammar:histogrammar-sparksql_{scala}:1.0.20\"\n",
"\n",
" spark = SparkSession.builder.config(\n",
" \"spark.jars.packages\", f\"{hist_spark_jar},{hist_jar}\"\n",
" ).getOrCreate()\n",
"\n",
" sdf = spark.createDataFrame(df)\n",
"\n",
" settings = Settings(time_axis=\"DATE\")\n",
" settings.report.extended_report = False\n",
"\n",
" sdf.pm_stability_report(\n",
" time_width=\"1w\",\n",
" time_offset=\"2015-07-02\",\n",
" settings=settings,\n",
" )"
]
},
{
"cell_type": "markdown",
"metadata": {},
"source": [
"# Using other reference types\n",
"## Using an external reference\n",
"Let's go back to Pandas again! (While all of this functionality also works on Spark DataFrames, it's just faster to illustrate it with Pandas.) \n",
"What if we want to compare our DataFrame to another DataFrame? \n",
"For example, because we trained a machine learning model on another DataFrame (which we'll call the reference data) and we want to monitor whether the new data (the current DataFrame) comes from a similar distribution? \n",
"We can do that by specifying an external reference DataFrame."
]
},
{
"cell_type": "code",
"execution_count": null,
"metadata": {},
"outputs": [],
"source": [
"settings = Settings(time_axis=\"DATE\", reference_type=\"external\")\n",
"settings.report.extended_report = False\n",
"\n",
"df_ref = pd.read_csv(\n",
" resources.data(\"flight_delays_reference.csv.gz\"), index_col=0, parse_dates=[\"DATE\"]\n",
")\n",
"df.pm_stability_report(\n",
" time_width=\"1w\",\n",
" time_offset=\"2015-07-02\",\n",
" reference=df_ref,\n",
" settings=settings,\n",
")"
]
},
{
"cell_type": "markdown",
"metadata": {},
"source": [
"## Using an expanding reference\n",
"We can also use an expanding reference, which for each time slot uses all preceding time slots as a reference."
]
},
{
"cell_type": "code",
"execution_count": null,
"metadata": {},
"outputs": [],
"source": [
"settings = Settings(time_axis=\"DATE\")\n",
"settings.report.extended_report = False\n",
"settings.reference_type = \"expanding\"\n",
"\n",
"df.pm_stability_report(\n",
" time_width=\"1w\",\n",
" time_offset=\"2015-07-02\",\n",
" settings=settings,\n",
")"
]
},
{
"cell_type": "markdown",
"metadata": {},
"source": [
"## Using a rolling window reference\n",
"And finally, we can use a rolling window reference. Here we can play with some additional parameters: shift and window. \n",
"We'll set the window parameter to 5."
]
},
{
"cell_type": "code",
"execution_count": null,
"metadata": {},
"outputs": [],
"source": [
"settings = Settings(time_axis=\"DATE\", reference_type=\"rolling\")\n",
"settings.report.extended_report = False\n",
"settings.comparison.window = 5\n",
"\n",
"df.pm_stability_report(\n",
" time_width=\"1w\",\n",
" time_offset=\"2015-07-02\",\n",
" settings=settings,\n",
")"
]
},
{
"cell_type": "markdown",
"metadata": {},
"source": [
"# Accessing the datastore\n",
"When you need programmtic access to popmon's results, then you can access the datastore directly.\n",
"For instanfce, you would like the exact maximum value of a histogram."
]
},
{
"cell_type": "markdown",
"metadata": {},
"source": [
"## Plotting the individual histograms\n",
"Sometimes, when you're diving into alerts from the report, you may want to plot some individual histograms. \n",
"Fortunately, you can! Let's first have a look at how these histograms are stored."
]
},
{
"cell_type": "code",
"execution_count": null,
"metadata": {},
"outputs": [],
"source": [
"report = df.pm_stability_report(\n",
" time_axis=\"DATE\", time_width=\"1w\", time_offset=\"2015-07-02\"\n",
")"
]
},
{
"cell_type": "code",
"execution_count": null,
"metadata": {},
"outputs": [],
"source": [
"list(report.datastore.keys())"
]
},
{
"cell_type": "code",
"execution_count": null,
"metadata": {},
"outputs": [],
"source": [
"split_hists = report.datastore[\"split_hists\"][\"DEPARTURE_DELAY\"]\n",
"split_hists"
]
},
{
"cell_type": "markdown",
"metadata": {},
"source": [
"Here we see the histograms for each time slot. Let us focus on the first time slot and plot the corresponding histogram."
]
},
{
"cell_type": "code",
"execution_count": null,
"metadata": {},
"outputs": [],
"source": [
"split_hist = split_hists.query(\"date == '2015-07-05 12:00:00'\")\n",
"split_hist.histogram[0].plot.matplotlib();"
]
},
{
"cell_type": "markdown",
"metadata": {},
"source": [
"And let's also plot the corresponding reference histogram."
]
},
{
"cell_type": "code",
"execution_count": null,
"metadata": {},
"outputs": [],
"source": [
"split_hist.histogram_ref[0].plot.matplotlib();"
]
},
{
"cell_type": "markdown",
"metadata": {},
"source": [
"## Integrations"
]
},
{
"cell_type": "markdown",
"metadata": {},
"source": [
"Access to the datastore means that its possible to integrate popmon in almost any workflow. To give an example, one could store the histogram data in a [PostgreSQL](https://www.psycopg.org/docs/) database and load that from [Grafana](https://github.com/grafana/grafana) and benefit from their visualisation and alert handling features (e.g. send an email or slack message upon alert) [[#158]](https://github.com/ing-bank/popmon/issues/158). Similar flows are possible when popmon is integrated in a workflow scheduler framework, such as [Airflow](https://airflow.apache.org/). \n",
"\n",
"If you have set up such a workflow, please consider contributing this as a feature. In order to do so, [open an issue](https://github.com/ing-bank/popmon) in the repository."
]
},
{
"cell_type": "markdown",
"metadata": {},
"source": [
"# Saving the report and the histograms to disk\n",
"If you run popmon regularly on the same dataset, you may want to store the report and the histograms to disk, so you can keep track of the alerts and easily inspect the histograms if anything goes wrong."
]
},
{
"cell_type": "code",
"execution_count": null,
"metadata": {},
"outputs": [],
"source": [
"# As HTML report\n",
"report.to_file(\"report.html\")\n",
"\n",
"# Alternatively, as serialized Python object\n",
"# import pickle\n",
"\n",
"# with open(\"report.pkl\", \"wb\") as f:\n",
"# pickle.dump(report, f)"
]
},
{
"cell_type": "markdown",
"metadata": {},
"source": [
"# Tuning parameters after generating the report\n",
"If you want to tune parameters after you've created the report, you can do so easily using `report.regenerate()`"
]
},
{
"cell_type": "code",
"execution_count": null,
"metadata": {},
"outputs": [],
"source": [
"report_settings = Settings()\n",
"report_settings.report.last_n = 0\n",
"report_settings.report.skip_first_n = 0\n",
"report_settings.report.skip_last_n = 0\n",
"report_settings.report.section.histograms.plot_hist_n = 0\n",
"report_settings.report.report_filepath = None\n",
"\n",
"report.regenerate(\n",
" store_key=\"html_report\",\n",
" sections_key=\"report_sections\",\n",
" settings=report_settings,\n",
")"
]
},
{
"cell_type": "markdown",
"metadata": {},
"source": [
"# Building your own pipelines\n",
"The `stability_report()` interface covers many use cases, but if you need more flexibility, you can define your own custom pipeline. We provide an example here!"
]
},
{
"cell_type": "code",
"execution_count": null,
"metadata": {},
"outputs": [],
"source": [
"from popmon.analysis.profiling import HistProfiler\n",
"from popmon.base import Pipeline\n",
"from popmon.hist.hist_splitter import HistSplitter\n",
"from popmon.pipeline.report import StabilityReport\n",
"from popmon.visualization import ReportGenerator, SectionGenerator\n",
"\n",
"datastore = {\n",
" \"hists\": df.pm_make_histograms(\n",
" time_axis=\"DATE\", time_width=\"1w\", time_offset=\"2015-07-02\"\n",
" )\n",
"}\n",
"\n",
"\n",
"class CustomPipeline(Pipeline):\n",
" def __init__(self):\n",
" modules = [\n",
" HistSplitter(\n",
" read_key=\"hists\", store_key=\"split_hists\", feature_begins_with=\"DATE\"\n",
" ),\n",
" HistProfiler(read_key=\"split_hists\", store_key=\"profiles\"),\n",
" SectionGenerator(\n",
" section_name=\"Profiles\",\n",
" read_key=\"profiles\",\n",
" store_key=\"report_sections\",\n",
" settings=report_settings.report,\n",
" ),\n",
" ReportGenerator(\n",
" read_key=\"report_sections\",\n",
" store_key=\"html_report\",\n",
" settings=report_settings.report,\n",
" ),\n",
" ]\n",
" super().__init__(modules)\n",
"\n",
"\n",
"pipeline = CustomPipeline()\n",
"datastore = pipeline.transform(datastore)\n",
"\n",
"stability_report = StabilityReport(datastore)\n",
"stability_report"
]
},
{
"cell_type": "markdown",
"metadata": {},
"source": [
"The above makes a very simple report, containing only the profiles (and no comparisons, traffic lights or alerts). The next examples shows how you can add the comparisons!"
]
},
{
"cell_type": "code",
"execution_count": null,
"metadata": {},
"outputs": [],
"source": [
"from popmon.analysis.comparison.hist_comparer import ReferenceHistComparer\n",
"\n",
"datastore = {\n",
" \"hists\": df.pm_make_histograms(\n",
" time_axis=\"DATE\", time_width=\"1w\", time_offset=\"2015-07-02\"\n",
" )\n",
"}\n",
"\n",
"\n",
"class CustomComparisonsPipeline(Pipeline):\n",
" def __init__(self):\n",
" modules = [\n",
" HistSplitter(\n",
" read_key=\"hists\", store_key=\"split_hists\", feature_begins_with=\"DATE\"\n",
" ),\n",
" HistProfiler(read_key=\"split_hists\", store_key=\"profiles\"),\n",
" ReferenceHistComparer(\n",
" reference_key=\"split_hists\",\n",
" assign_to_key=\"split_hists\",\n",
" store_key=\"comparisons\",\n",
" ),\n",
" SectionGenerator(\n",
" section_name=\"Profiles\",\n",
" read_key=\"profiles\",\n",
" store_key=\"report_sections\",\n",
" settings=report_settings.report,\n",
" ),\n",
" SectionGenerator(\n",
" section_name=\"Comparisons\",\n",
" read_key=\"comparisons\",\n",
" store_key=\"report_sections\",\n",
" settings=report_settings.report,\n",
" ),\n",
" ReportGenerator(\n",
" read_key=\"report_sections\",\n",
" store_key=\"html_report\",\n",
" settings=report_settings.report,\n",
" ),\n",
" ]\n",
" super().__init__(modules)\n",
"\n",
"\n",
"pipeline = CustomComparisonsPipeline()\n",
"datastore = pipeline.transform(datastore)\n",
"\n",
"stability_report = StabilityReport(datastore)\n",
"stability_report"
]
},
{
"cell_type": "markdown",
"metadata": {},
"source": [
"If you're interested in more complex examples, check the code in `popmon.pipeline.report_pipelines`.\n",
"\n",
"Using the custom pipelines it becomes relatively easy to include new profiles and new comparisons. \n",
"If you do, be sure to let us know! You may be able to make a pull request and add it to the package."
]
},
{
"cell_type": "markdown",
"metadata": {},
"source": [
"## Pipeline Visualization\n",
"\n",
"[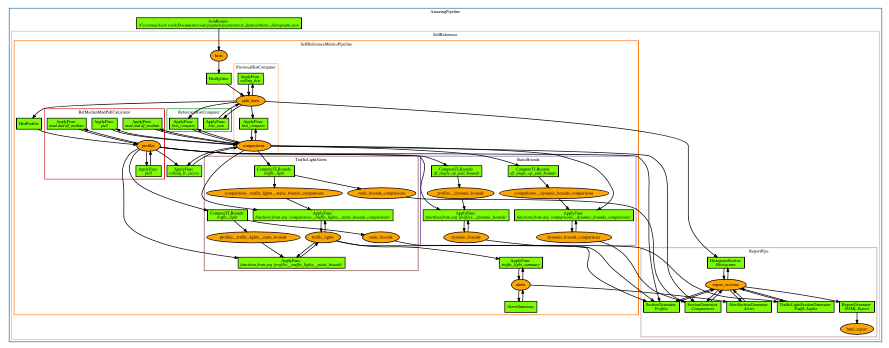](https://github.com/ing-bank/popmon/files/7417124/pipeline_amazingpipeline_subgraphs_unversioned.pdf)\n",
"(Click to enlarge)\n",
"\n",
"Visualization of the pipeline can be useful when debugging, or for didactic purposes.\n",
"There is a [script](https://github.com/ing-bank/popmon/tree/master/tools/) included with the package that you can use.\n",
"The plotting is configurable, and depending on the options you will obtain a result that can be used for understanding the data flow, the high-level components and the (re)use of datasets.\n",
"The parameters are: subgraph (yes/no), version datasets (yes/no) and display edge labels (yes/no)."
]
}
],
"metadata": {
"kernel_info": {
"name": "python3"
},
"kernelspec": {
"display_name": "Python 3 (ipykernel)",
"language": "python",
"name": "python3"
},
"language_info": {
"codemirror_mode": {
"name": "ipython",
"version": 3
},
"file_extension": ".py",
"mimetype": "text/x-python",
"name": "python",
"nbconvert_exporter": "python",
"pygments_lexer": "ipython3",
"version": "3.8.8"
},
"nteract": {
"version": "0.15.0"
},
"pycharm": {
"stem_cell": {
"cell_type": "raw",
"metadata": {
"collapsed": false
},
"source": []
}
}
},
"nbformat": 4,
"nbformat_minor": 4
}