{
"cells": [
{
"cell_type": "markdown",
"metadata": {},
"source": [
"# Intermine-Python: Tutorial 14 - Visualisation in Intermine"
]
},
{
"cell_type": "markdown",
"metadata": {},
"source": [
"With the great need for data visualisation in the present world, we have introduced a few visual features to Intermine as well. We have tried to cover the most common needs of visualisation and have explained their use in this tutorial.
\n",
"NOTE: This feature of Python Client is supported only on Python Versions>= 3.6 because of the dependencies."
]
},
{
"cell_type": "code",
"execution_count": null,
"metadata": {},
"outputs": [],
"source": [
"from intermine import bar_chart as b\n",
"b.save_mine_and_token(\"humanmine\",\"\")"
]
},
{
"cell_type": "markdown",
"metadata": {},
"source": [
"'saves the given mine and token'"
]
},
{
"cell_type": "markdown",
"metadata": {},
"source": [
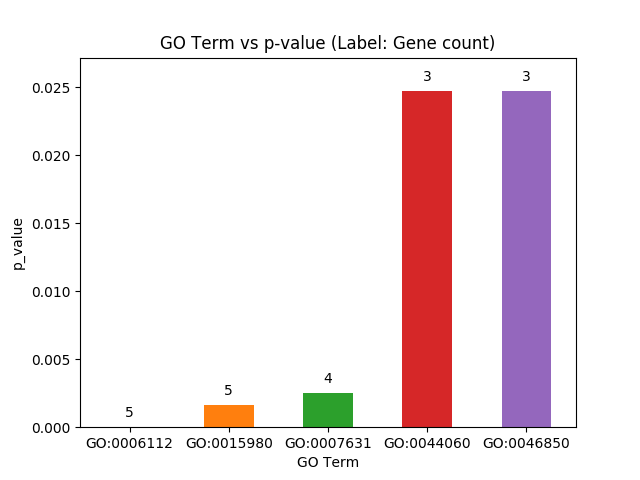
"`plot_go_vs_p(list name)` can be used to print GO Terms vs p-value, as the name suggests. Also each bar in the bar-chart is labelled by the gene count corresponding to the particular GO Term."
]
},
{
"cell_type": "code",
"execution_count": null,
"metadata": {},
"outputs": [],
"source": [
"b.plot_go_vs_p(\"PL_obesityMonogen_ORahilly09\")"
]
},
{
"cell_type": "markdown",
"metadata": {},
"source": [
""
]
},
{
"cell_type": "markdown",
"metadata": {},
"source": [
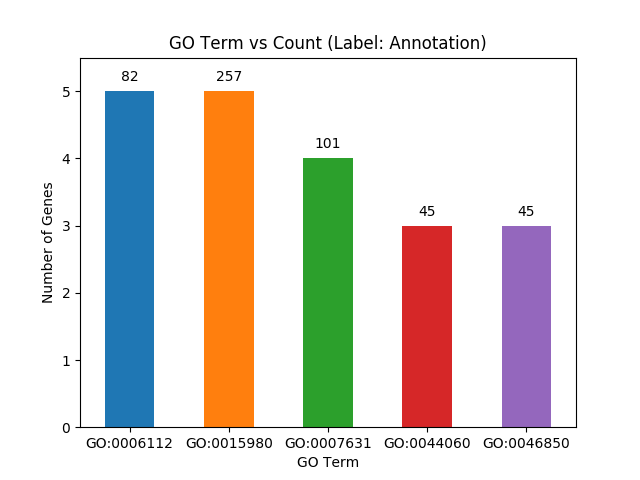
"Similarly, `plot_go_vs_count(list name)` can be used to print GO Terms vs gene count. Again, each bar in the bar-chart is labelled by the annotation corresponding to the particular GO Term."
]
},
{
"cell_type": "code",
"execution_count": null,
"metadata": {},
"outputs": [],
"source": [
"b.plot_go_vs_count(\"PL_obesityMonogen_ORahilly09\")"
]
},
{
"cell_type": "markdown",
"metadata": {},
"source": [
""
]
},
{
"cell_type": "markdown",
"metadata": {},
"source": [
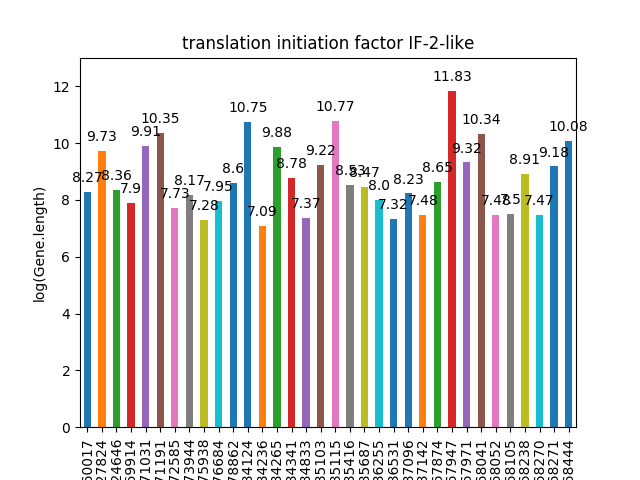
"`query_to_barchart_log(xml)` is used to plot the query given as an argument in xml format.
\n",
"Its important to note that the query should be in a format such that the first row contains the gene, the second row has content for x-axis and the third row consists if y-axis values.
\n",
"Also, only if the second argument is 'true', the y axis values are converted to their corresponding loge values. Its really useful if the values have a diverse range. If not needed, the second argument can be any string but 't"
]
},
{
"cell_type": "code",
"execution_count": null,
"metadata": {},
"outputs": [],
"source": [
"b.query_to_barchart_log('','true')"
]
},
{
"cell_type": "markdown",
"metadata": {},
"source": [
""
]
},
{
"cell_type": "markdown",
"metadata": {},
"source": [
"We will soon be coming out with more plots. If you have any ideas feel free to open an issue in the Python Client repository."
]
}
],
"metadata": {
"kernelspec": {
"display_name": "Python 3",
"language": "python",
"name": "python3"
},
"language_info": {
"codemirror_mode": {
"name": "ipython",
"version": 3
},
"file_extension": ".py",
"mimetype": "text/x-python",
"name": "python",
"nbconvert_exporter": "python",
"pygments_lexer": "ipython3",
"version": "3.6.4"
}
},
"nbformat": 4,
"nbformat_minor": 2
}