---
title: "Introduction to Data Science"
subtitle: "Session 1: What is data science?"
author: "Simon Munzert"
institute: "Hertie School"
output:
xaringan::moon_reader:
css: [default,'simons-touch.css', metropolis, metropolis-fonts]
lib_dir: libs
nature:
highlightStyle: github
highlightLines: true
countIncrementalSlides: false
ratio: '16:9'
hash: true
---
class: inverse, center, middle
name: welcome
```{css, echo=FALSE}
@media print { # print out incremental slides; see https://stackoverflow.com/questions/56373198/get-xaringan-incremental-animations-to-print-to-pdf/56374619#56374619
.has-continuation {
display: block !important;
}
}
```
```{r setup, include=FALSE}
# figures formatting setup
options(htmltools.dir.version = FALSE)
library(knitr)
opts_chunk$set(
prompt = T,
fig.align="center", #fig.width=6, fig.height=4.5,
# out.width="748px", #out.length="520.75px",
dpi=300, #fig.path='Figs/',
cache=T, #echo=F, warning=F, message=F
engine.opts = list(bash = "-l")
)
## Next hook based on this SO answer: https://stackoverflow.com/a/39025054
knit_hooks$set(
prompt = function(before, options, envir) {
options(
prompt = if (options$engine %in% c('sh','bash')) '$ ' else 'R> ',
continue = if (options$engine %in% c('sh','bash')) '$ ' else '+ '
)
})
library(tidyverse)
library(hrbrthemes)
library(fontawesome)
```
# Welcome!
---
# Introductions
### Course
`r fa('globe')` https://github.com/intro-to-data-science-22
Much of this course lives on GitHub. You will find lecture materials, code, assignments, and other people's presentations there. We also have Moodle, which is is for everything else.
--
### Me
`r fa('address-book')` I'm [Simon Munzert](https://simonmunzert.github.io/) [si’mən munsɜrt], or just Simon [saɪmən].
`r fa('envelope')` [munzert@hertie-school.org](mailto:munzert@hertie-school.org)
`r fa('graduation-cap')` Professor of data science and public policy
--
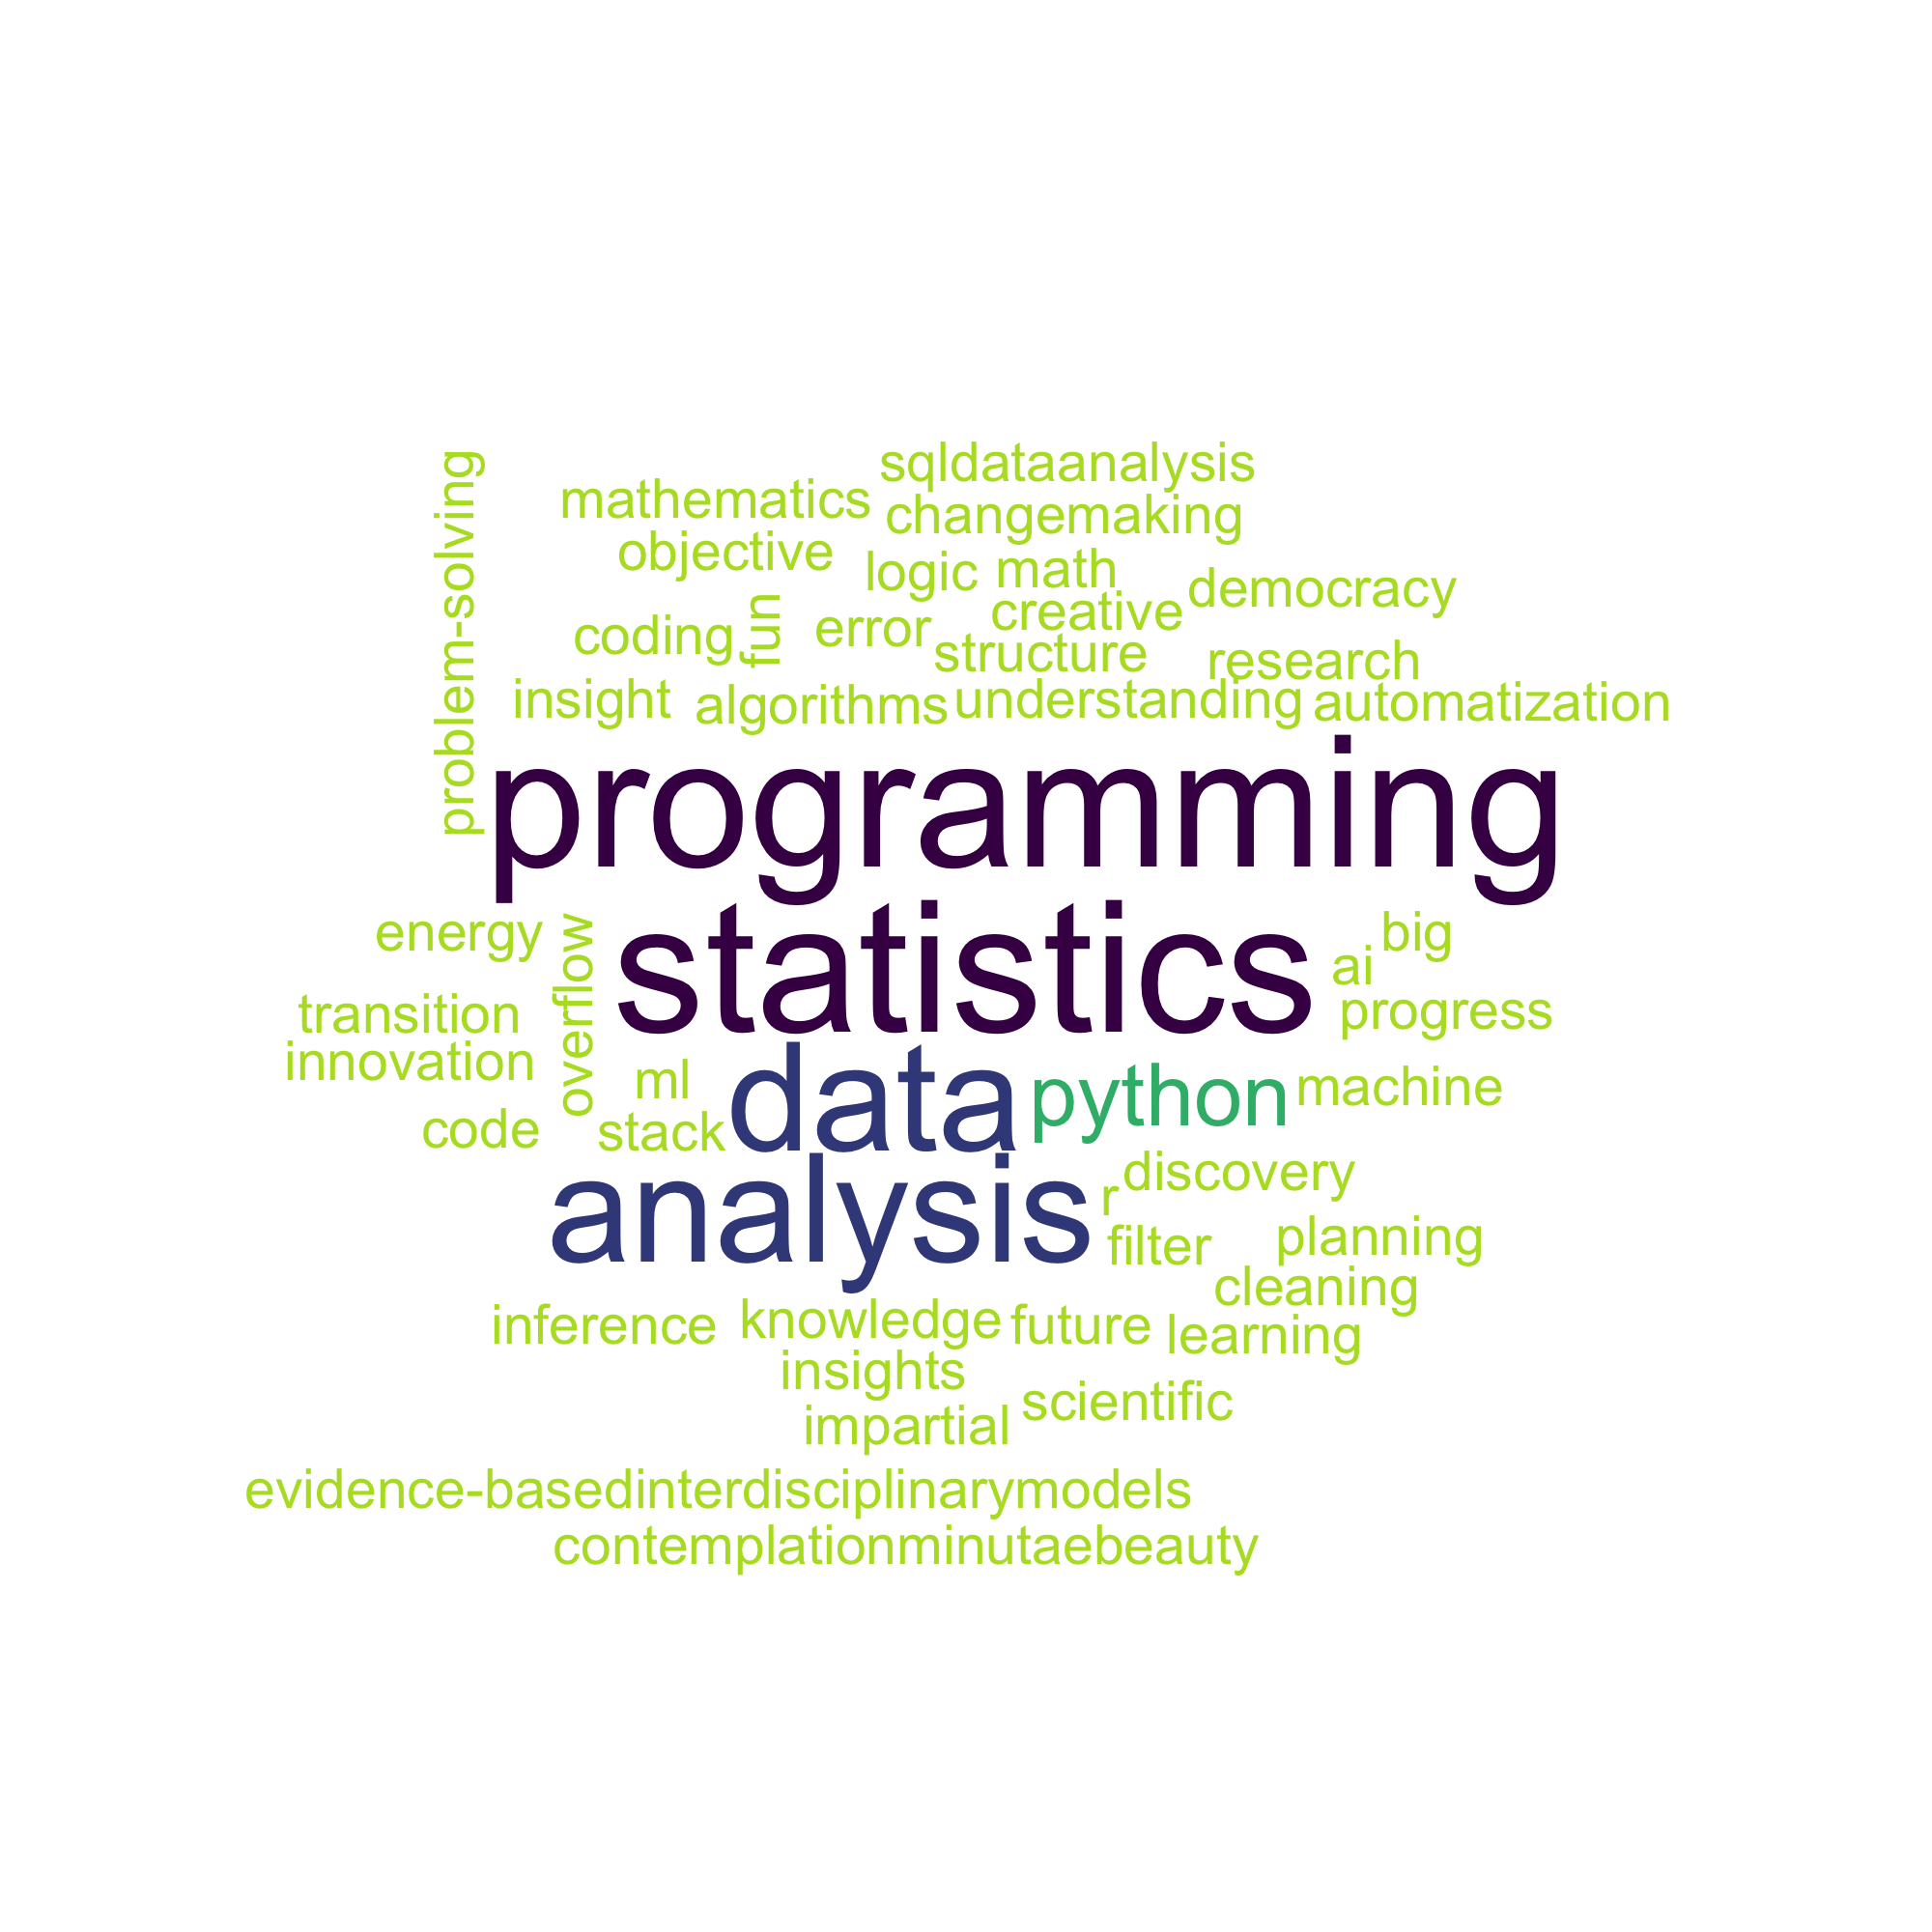
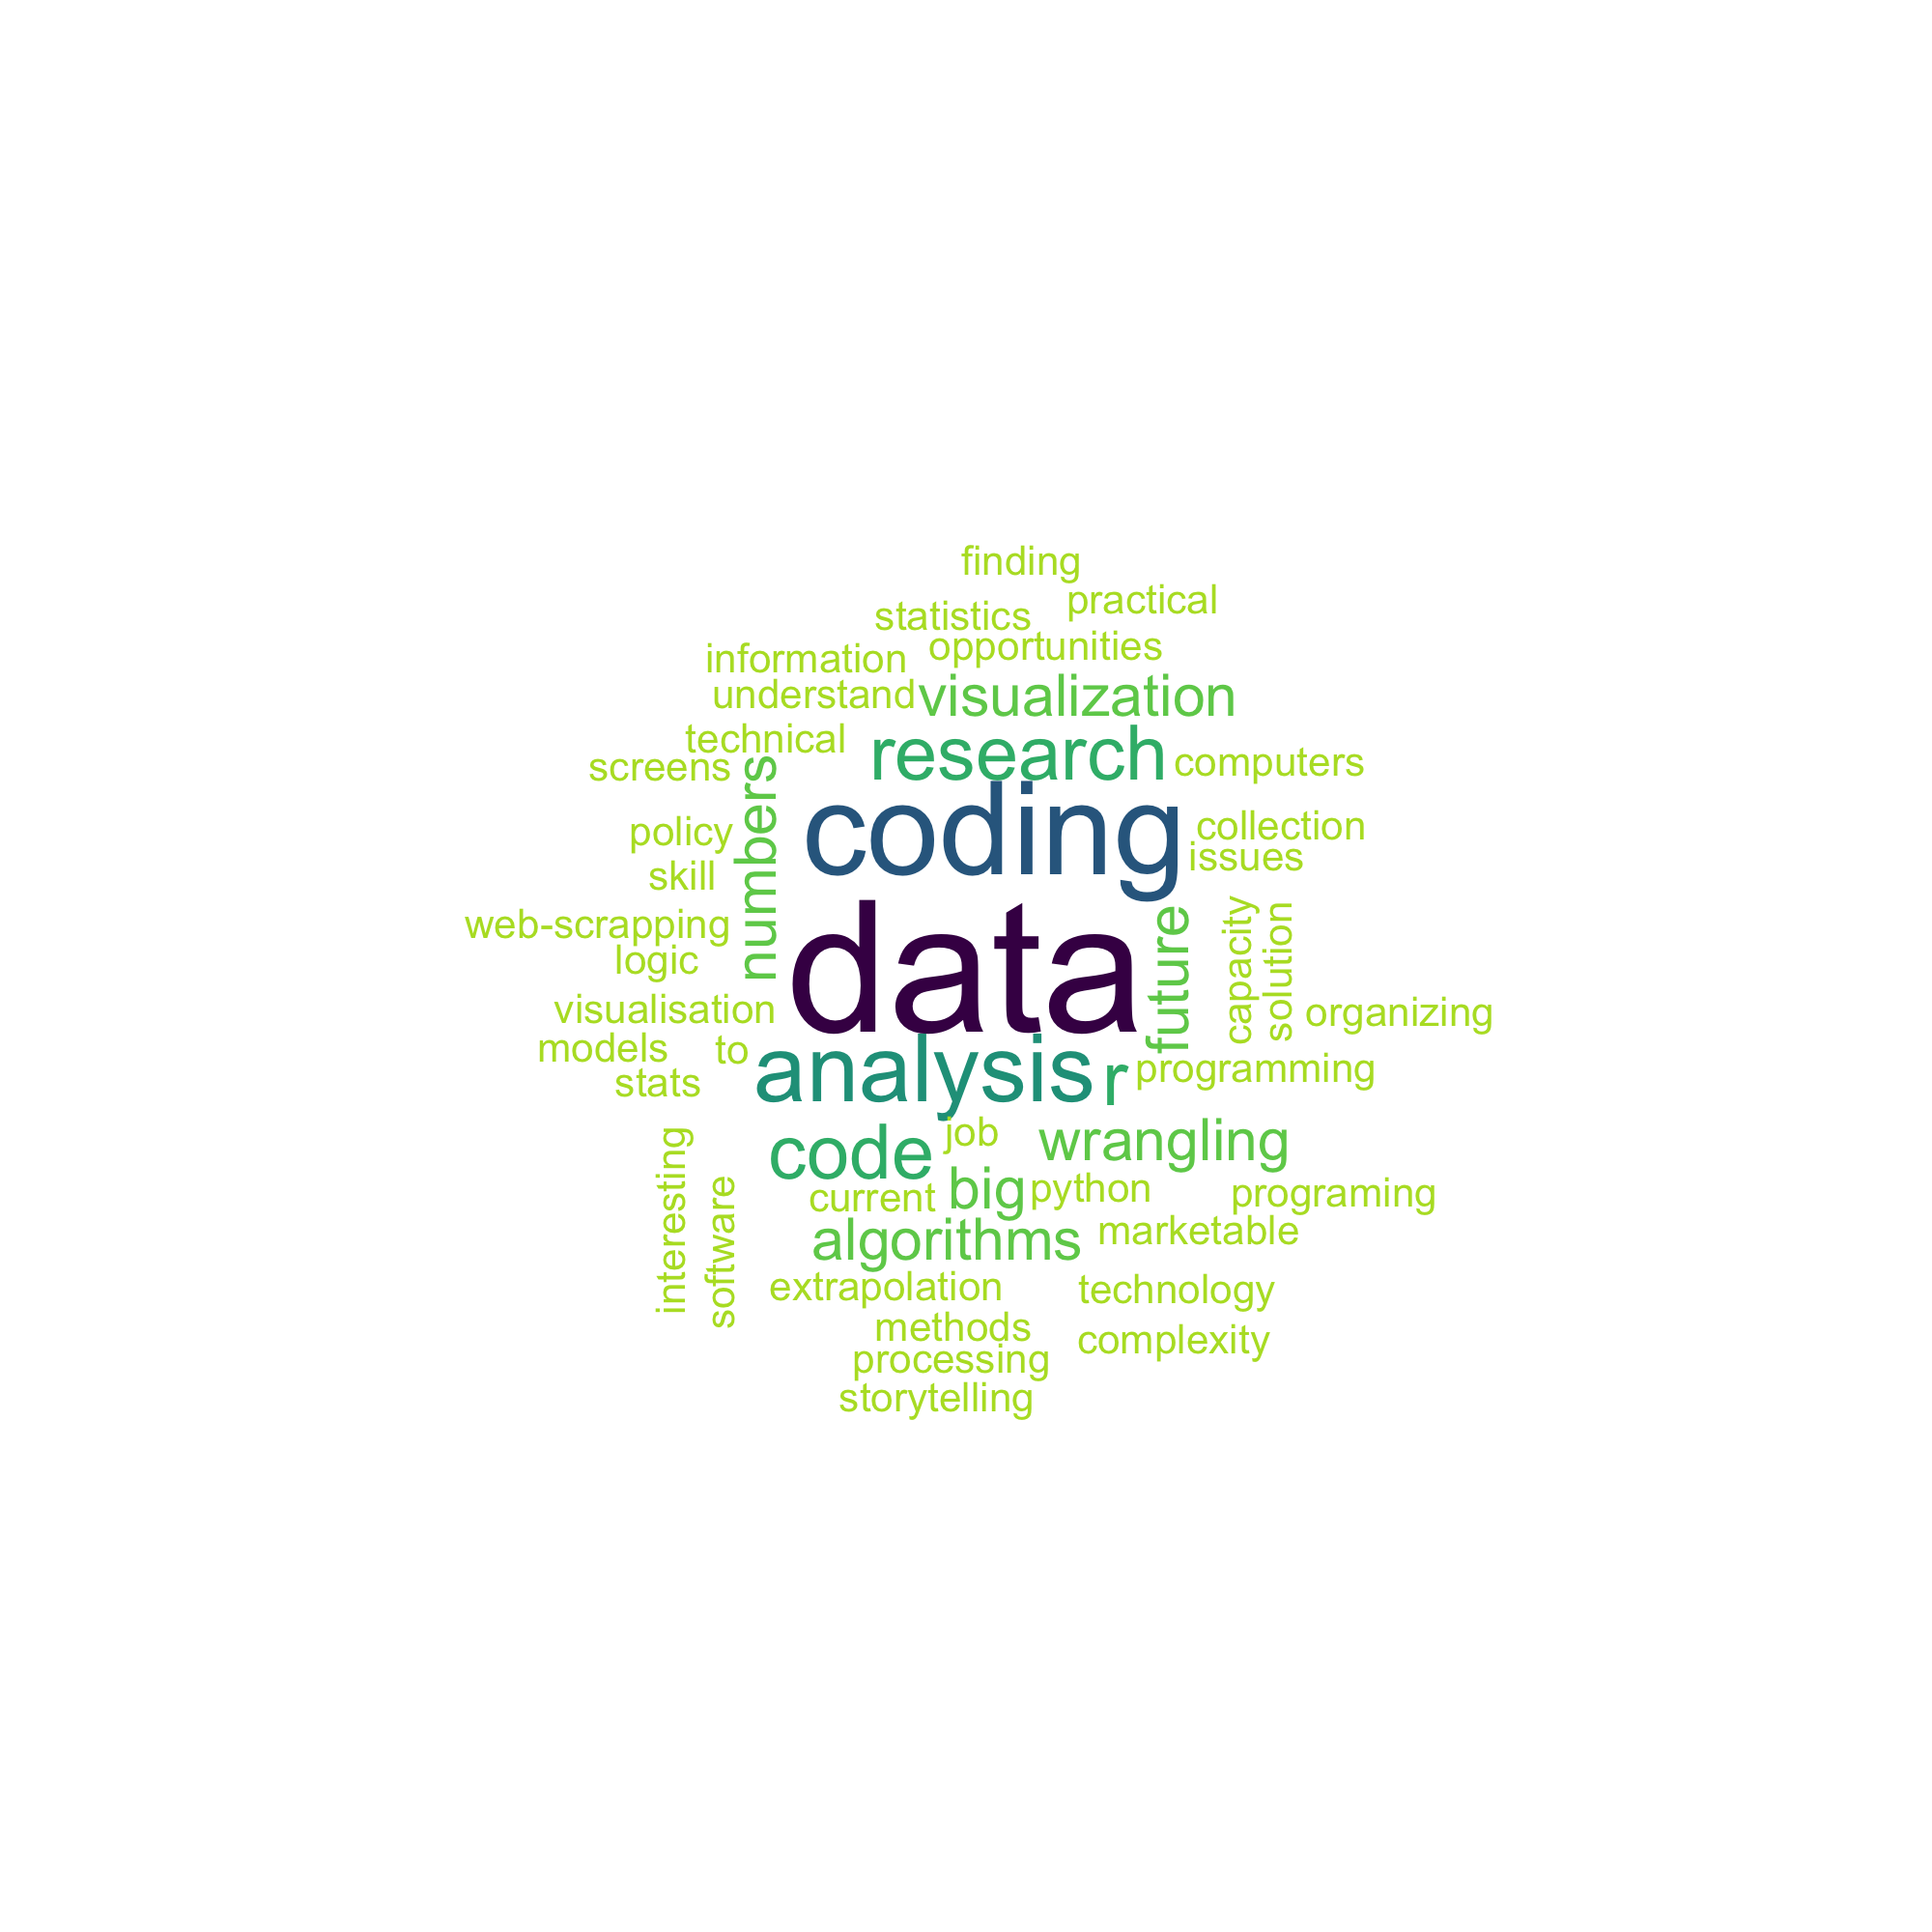
### You
What's your name? What's your favorite number? And would you share a fun fact about yourself?
---
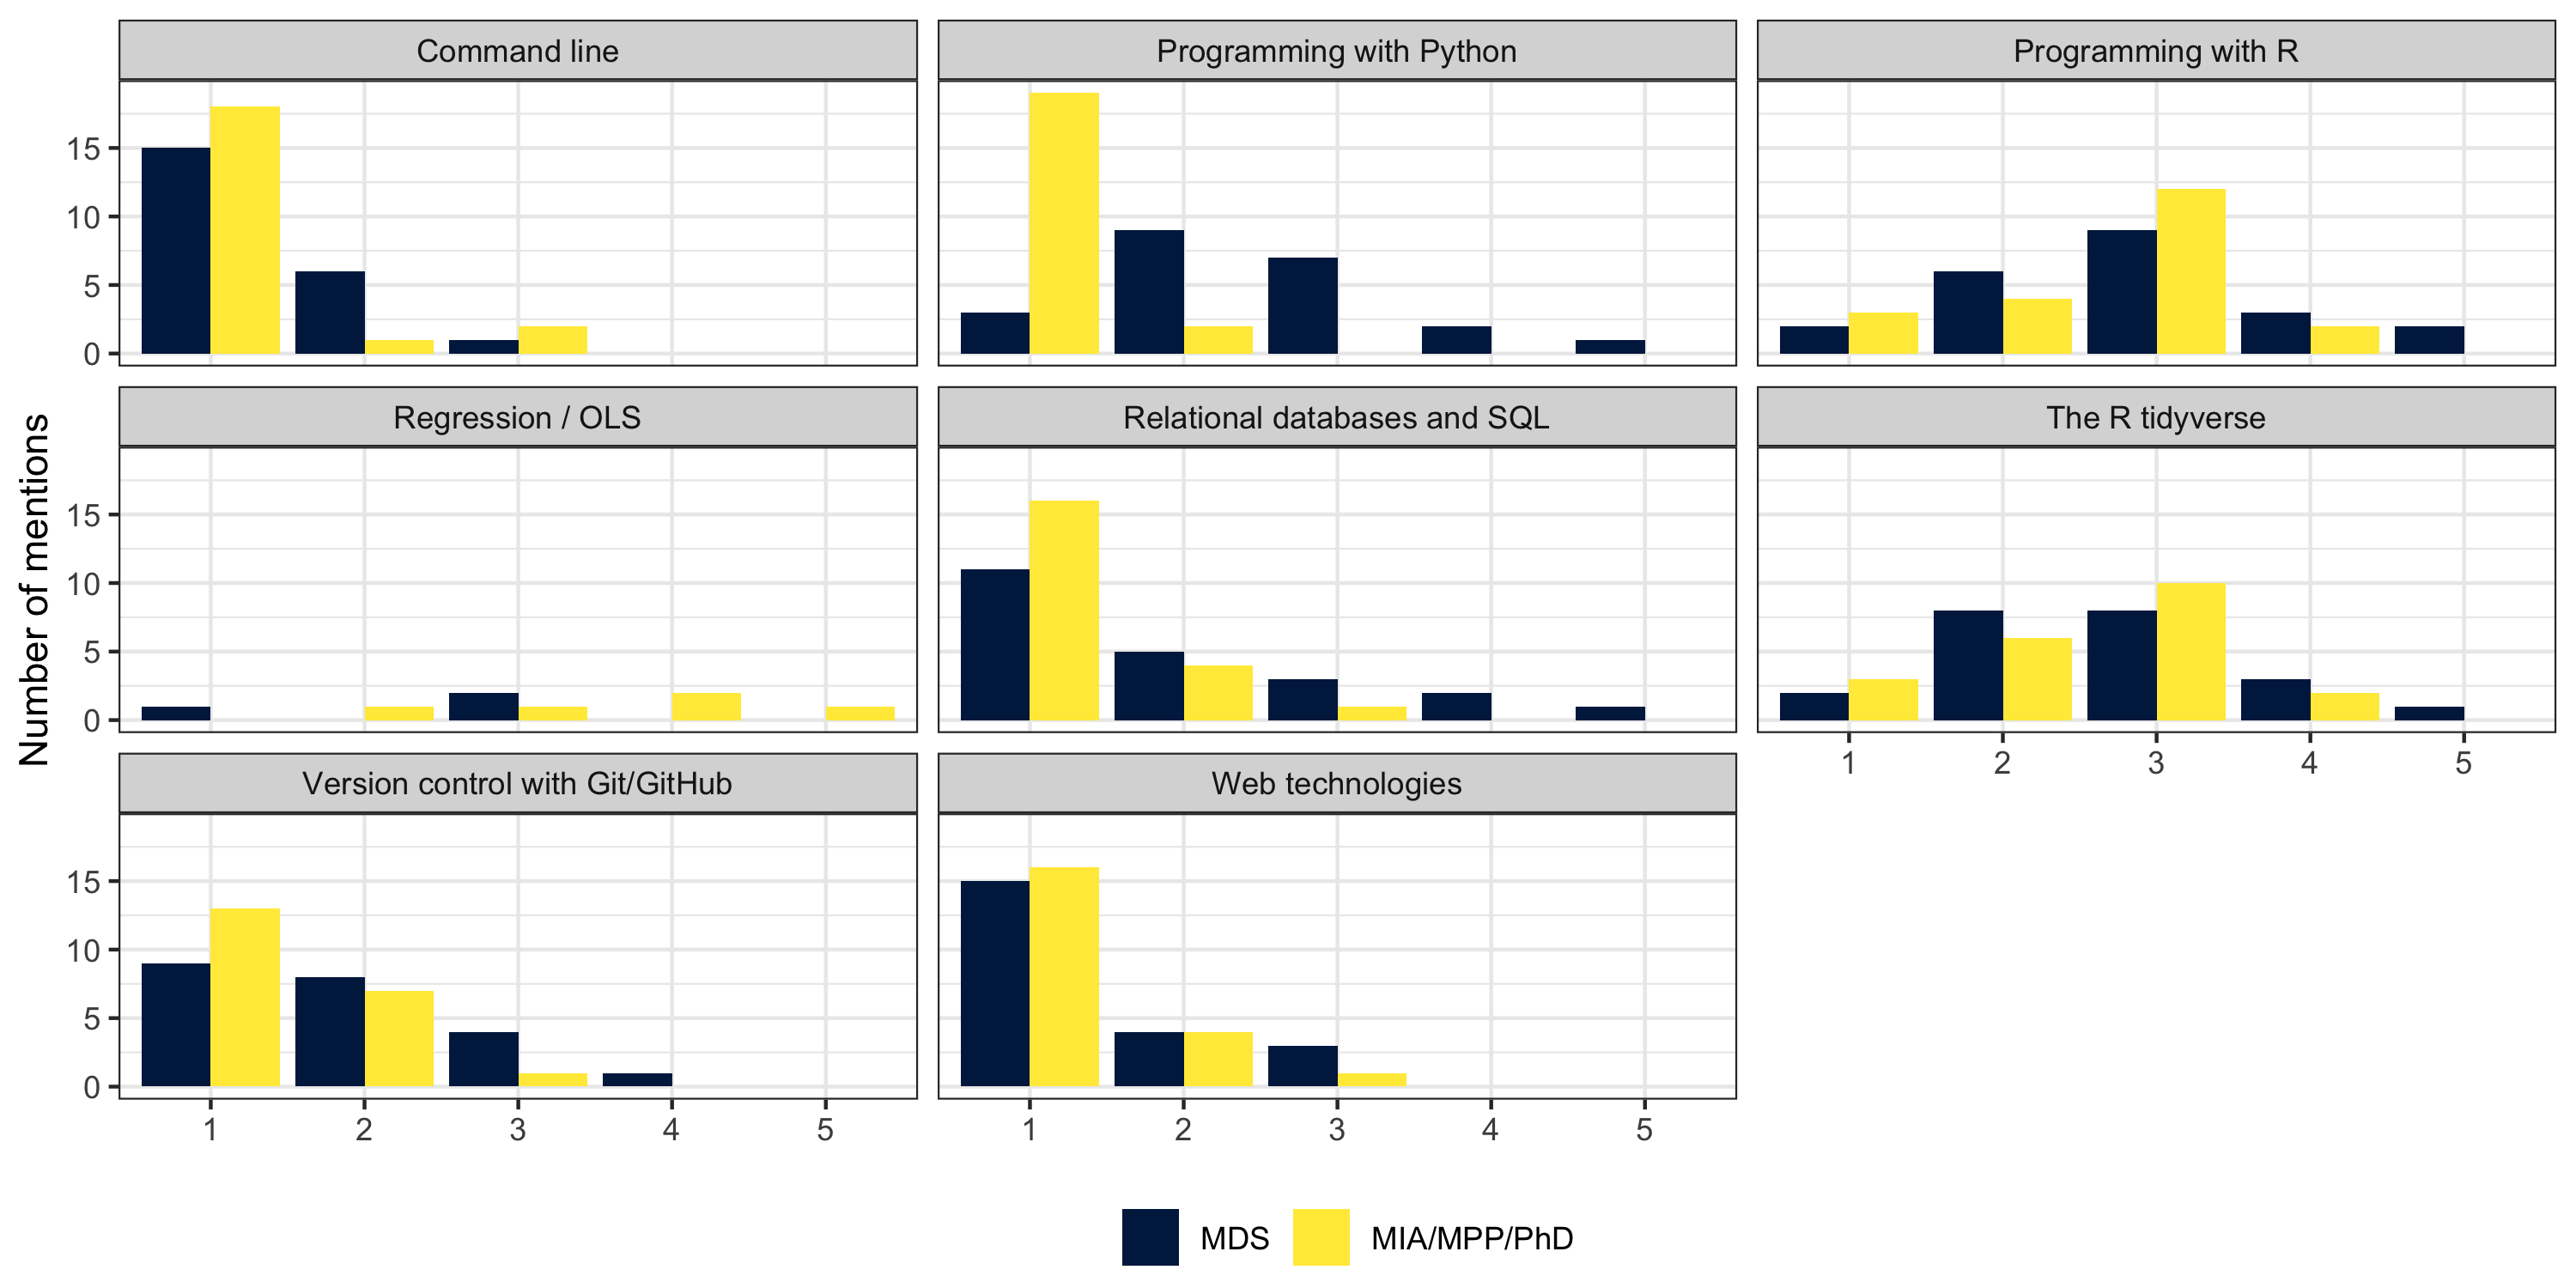
# More about you
---
# More about you
.pull-left[
MPP/MIA/PhD
]
.pull-right[
MDS
]
---
# More about you
.pull-left[
MPP/MIA/PhD
]
.pull-right[
MDS
]
---
# The labs
.pull-left-wide[
## Who & how
- This course is accompanied by labs administered by **Lisa Oswald** and **Tom Arend**.
- The labs are mandatory (MDS) / optional (the rest). Please attend them in any case.
- As with the regular classes, please stick to the lab you are assigned to.
## What for
- What these sessions are meant for:
- Applying tools in practice
- Discussion of issues related to the assignments
- Boosting your R skills
- What these sessions are **not** meant for:
- Solving the assignments for you
- Taking care of developing your coding skills
]
.pull-right-small-center[

]
---
# Class etiquette
.pull-left-wide[
- Learning how to code can be challenging and might lead you out of your comfort zone. If you have problems with the pace of the course, let me and the TAs know. I expect your commitment to the class, but **I do not want anyone to fail.**
- You are all genuinely interested in data science. But there is also considerable variation in your backgrounds. This is how we like it! Some sessions will be more informative for you than others. If you feel bored, **look out for and help others**, or explore other corners of R you don't know yet.
- The pandemic is still around, and other crises have emerged. We are affected by them in different ways. **Let's support each other.**
- **Be respectful** to each other, all the time. This includes the TAs and me.
- **Ask questions** whenever you feel the need to do so!
]
.pull-right-small-center[

]
---
# Table of contents
1. [Welcome!](#welcome)
2. [What is data science?](#whatisdatascience)
3. [Sneak preview](#preview)
4. [Class logistics](#logistics)
---
class: inverse, center, middle
name: whatisdatascience
# What is data science?
---
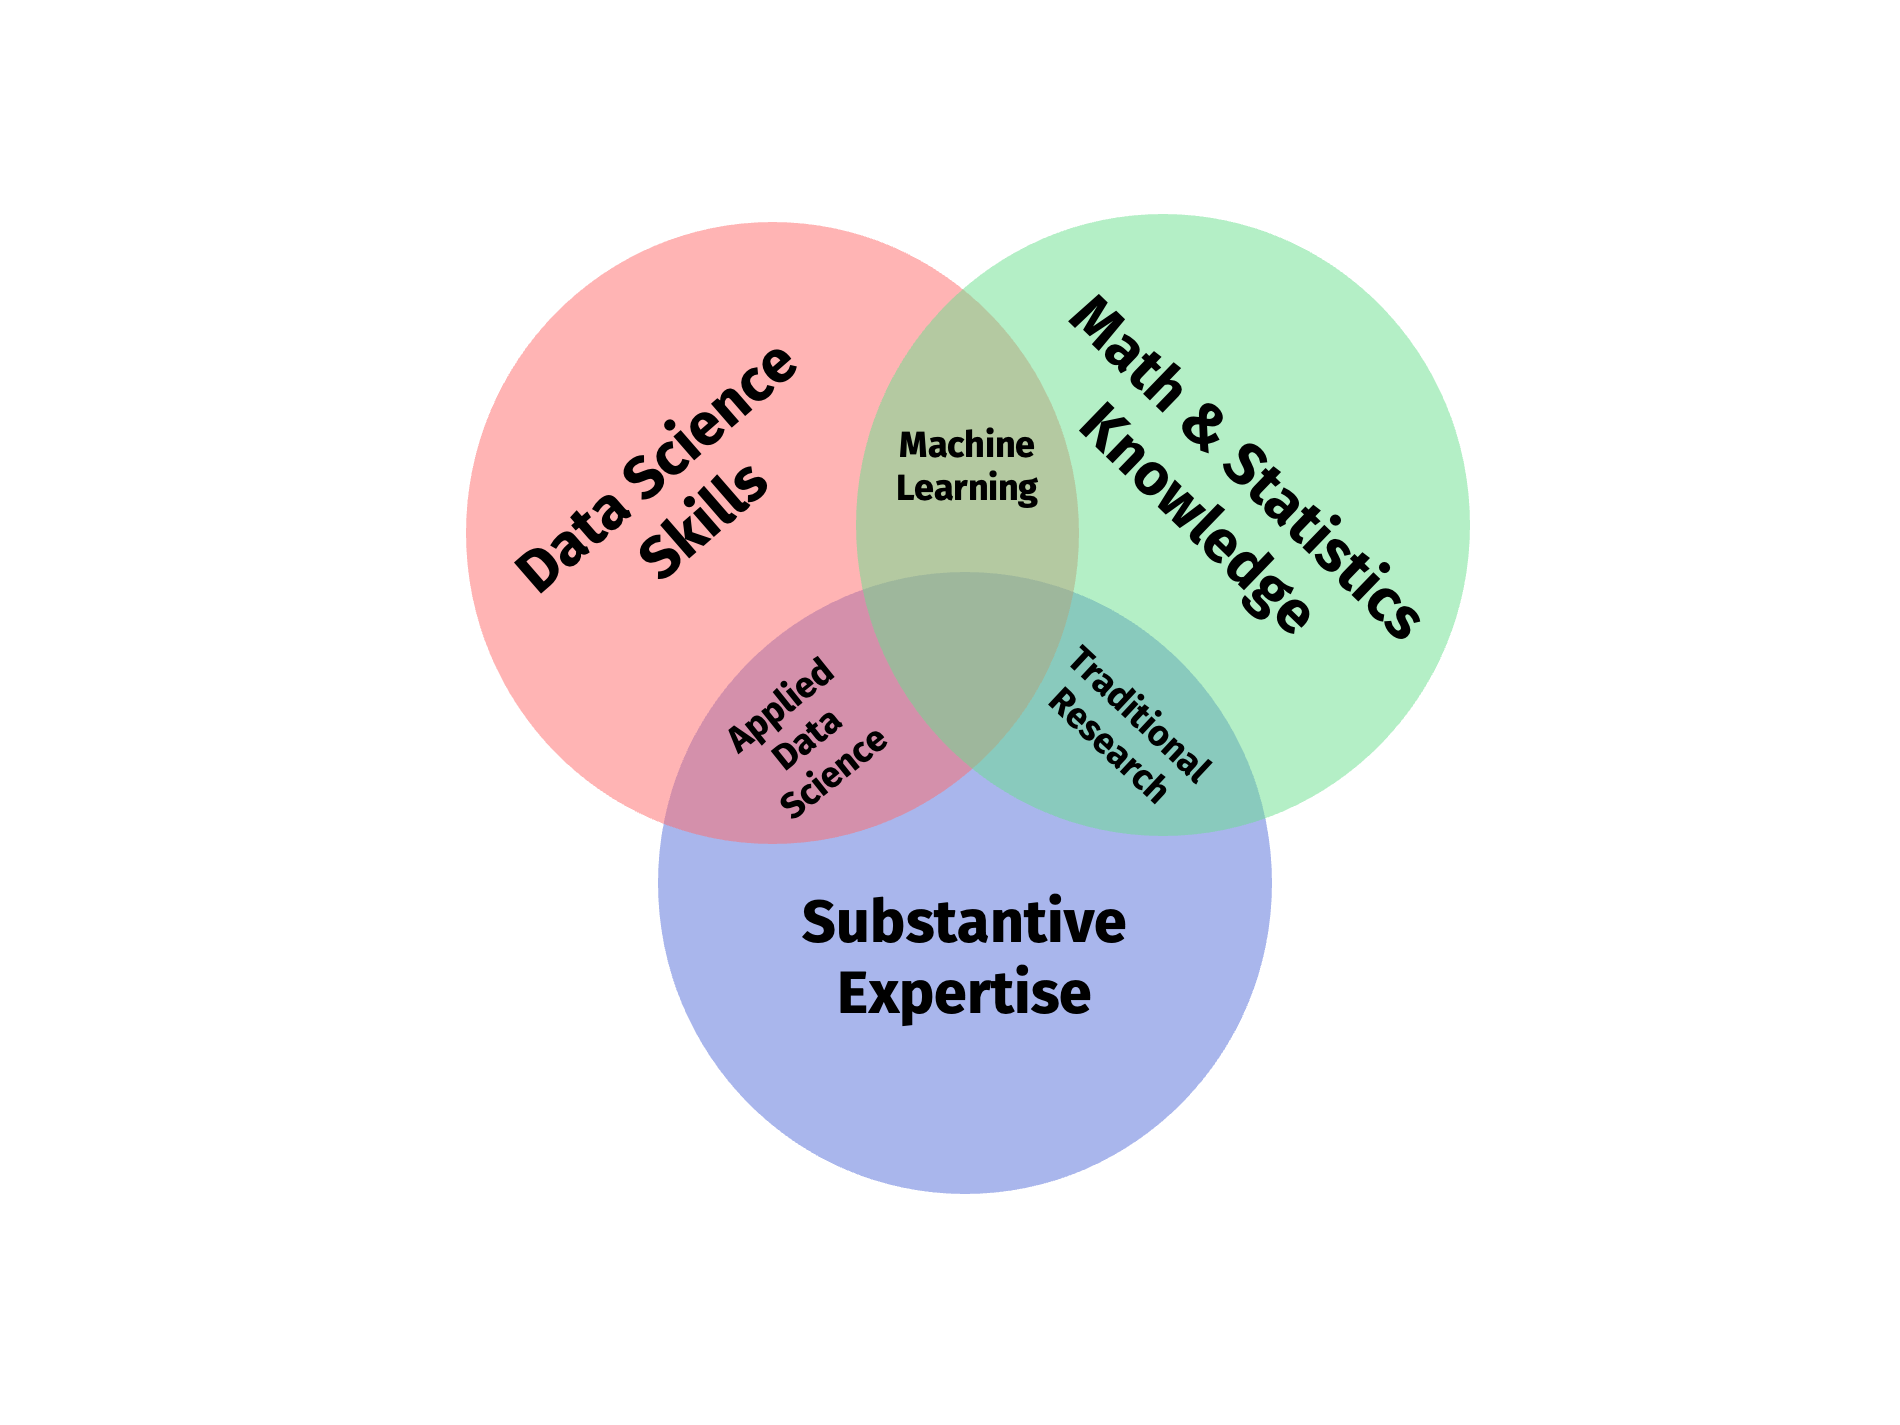
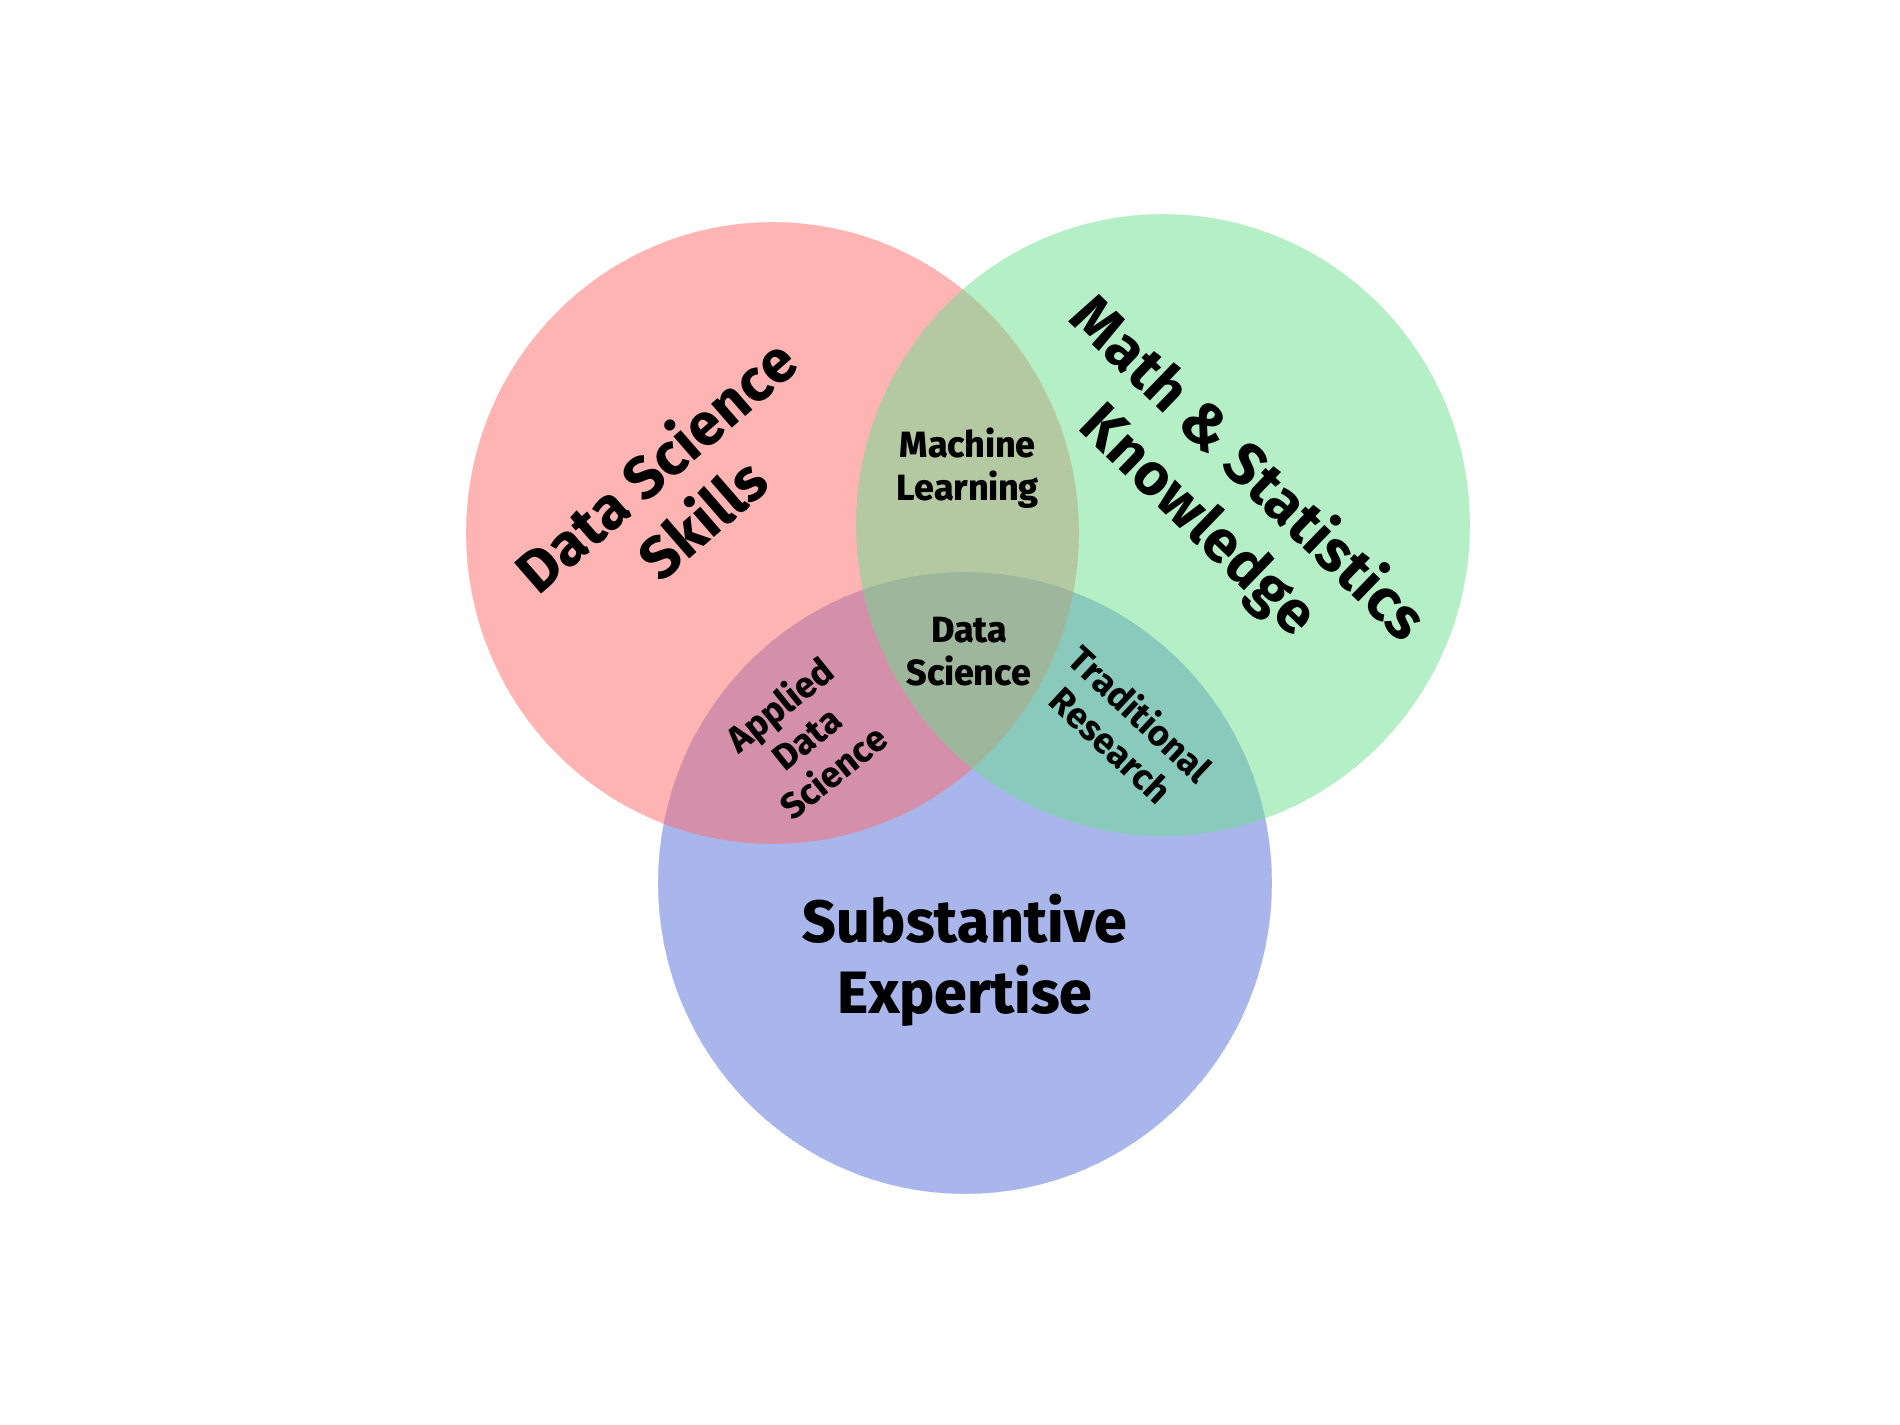
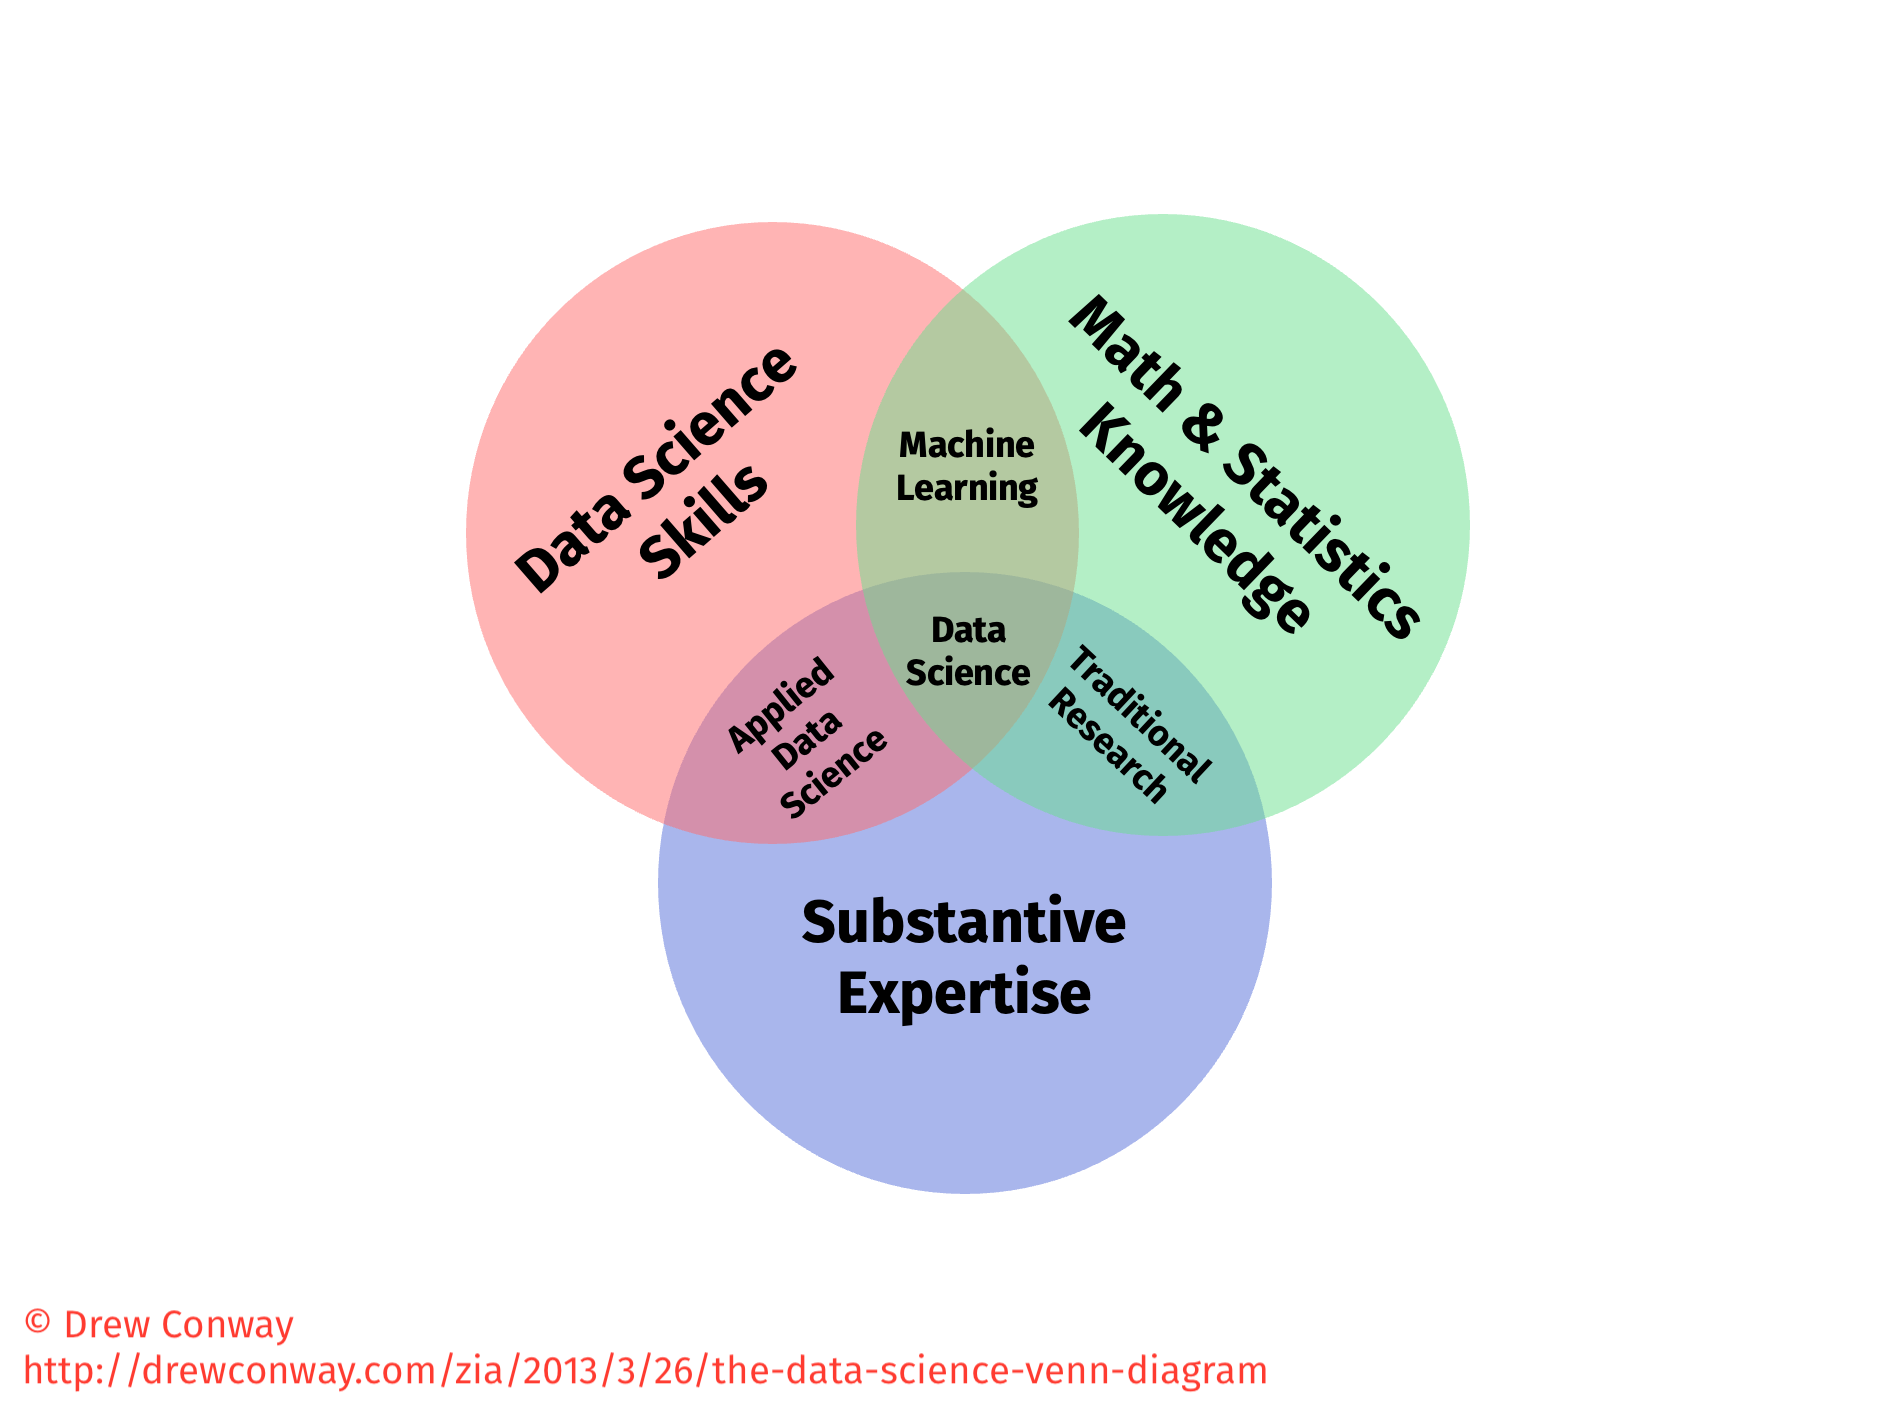
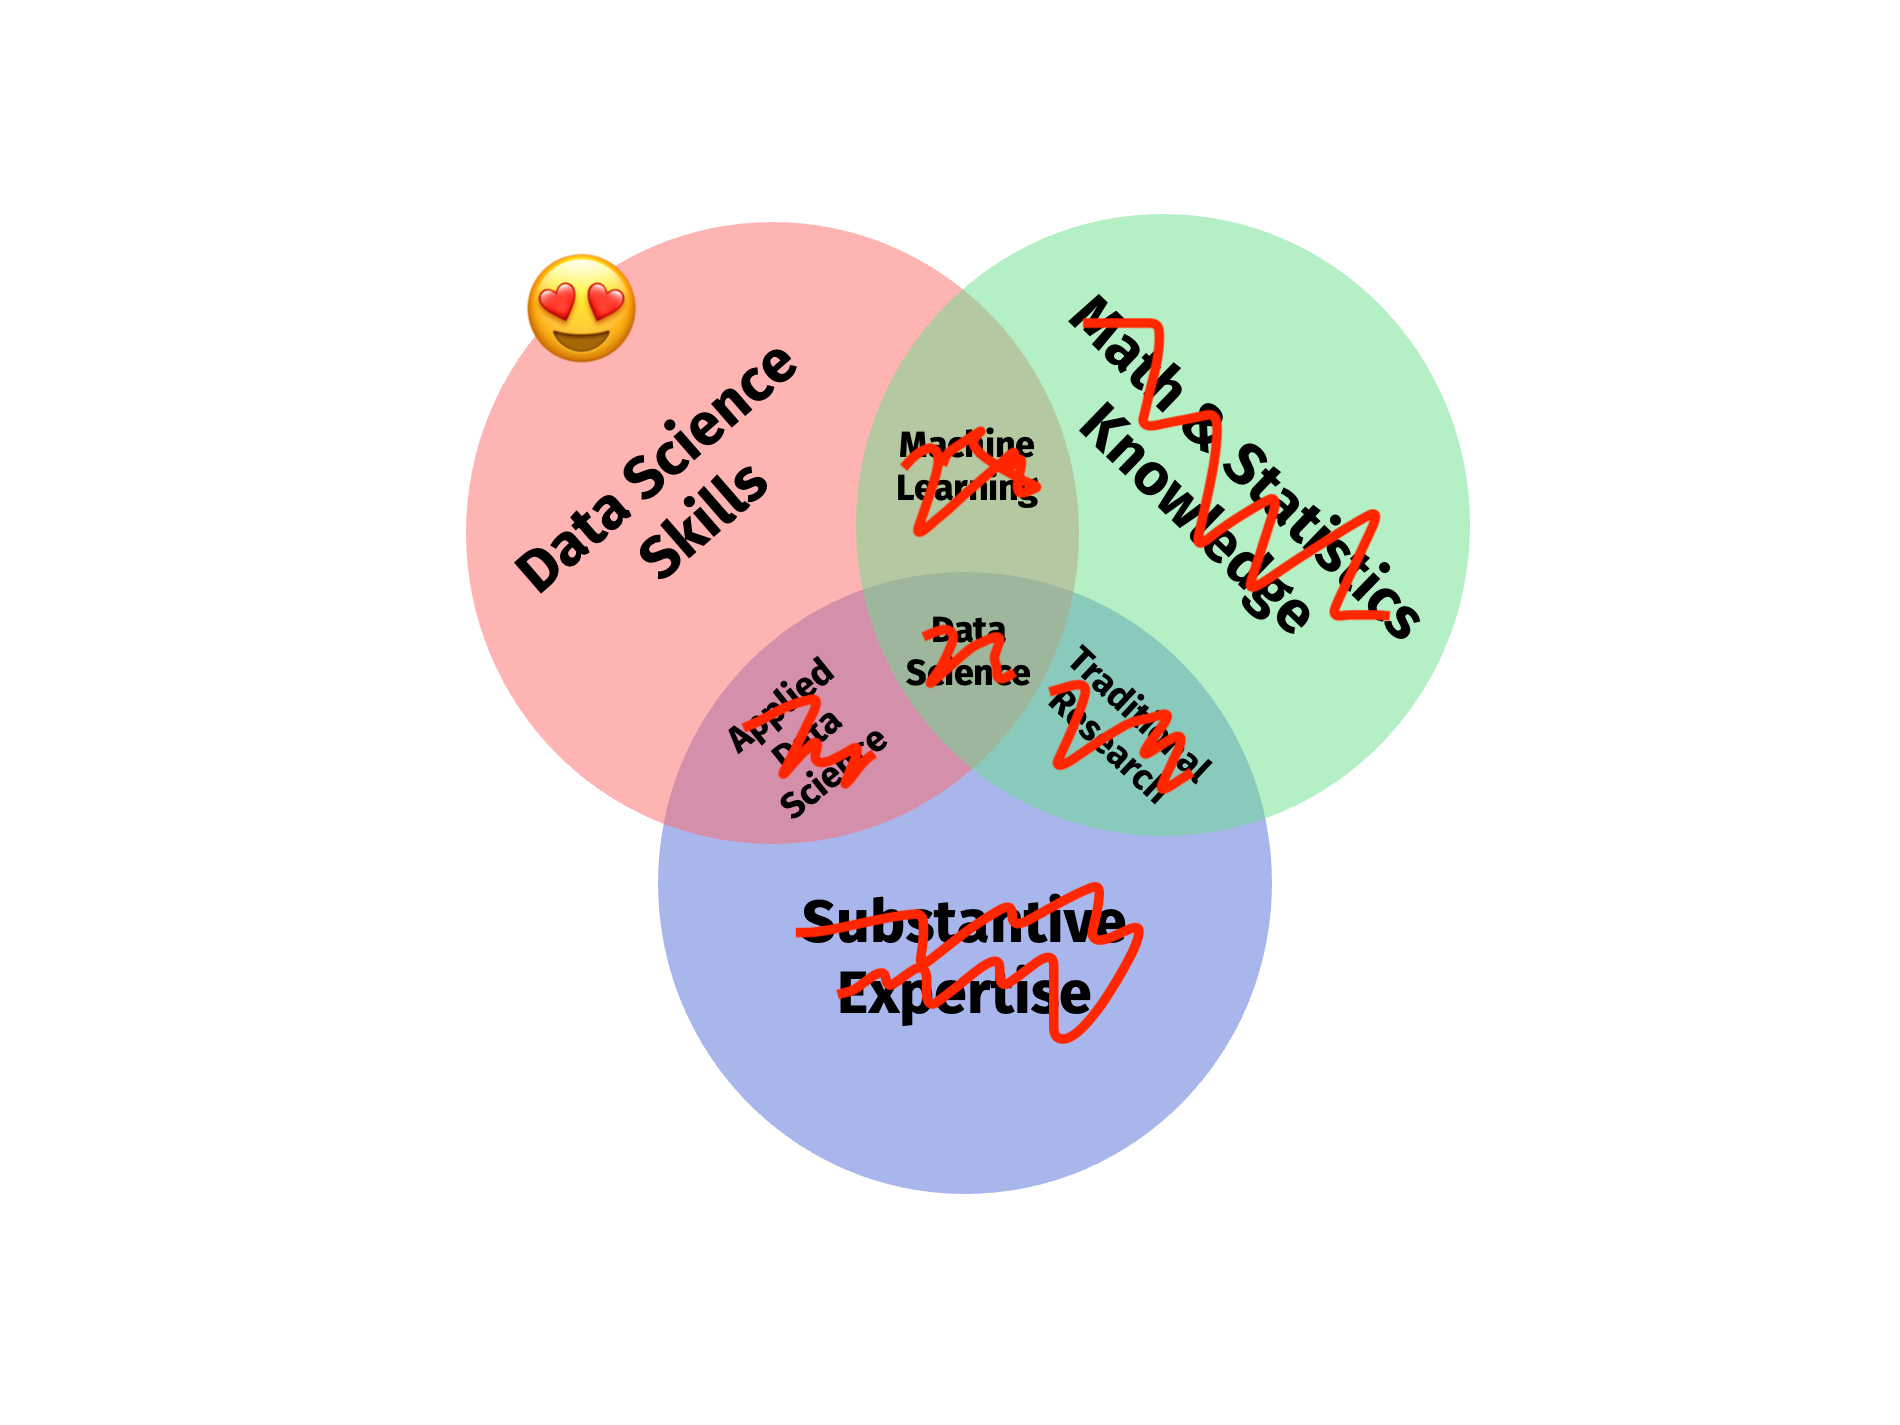
# An old classic
---
# An old classic
---
# An old classic
---
# An old classic
---
# An old classic
---
# An old classic
---
background-image: url("pics/vintage-pipeline.jpeg")
background-size: contain
background-color: #000000
# The data science pipeline
---
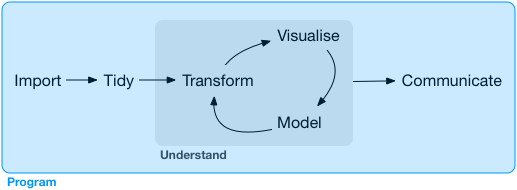
# The data science pipeline
.pull-left[
**Preparatory work**
- **Problem definition** predict, infer, describe
- **Design** conceptualize, build data collection device
- **Data collection** recruit, collect, monitor
]
---
# The data science pipeline
.pull-left[
**Preparatory work**
- **Problem definition** predict, infer, describe
- **Design** conceptualize, build data collection device
- **Data collection** recruit, collect, monitor
**Data operation**
]
.pull-right-center[
]
---
# The data science pipeline
.pull-left[
**Preparatory work**
- **Problem definition** predict, infer, describe
- **Design** conceptualize, build data collection device
- **Data collection** recruit, collect, monitor
**Data operation**
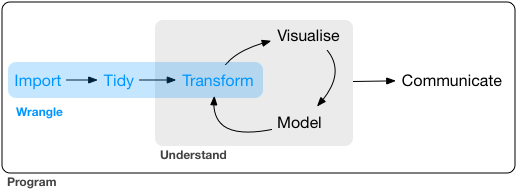
- **Wrangle**: import, tidy, manipulate
]
.pull-right-center[
]
---
# The data science pipeline
.pull-left[
**Preparatory work**
- **Problem definition** predict, infer, describe
- **Design** conceptualize, build data collection device
- **Data collection** recruit, collect, monitor
**Data operation**
- **Wrangle**: import, tidy, manipulate
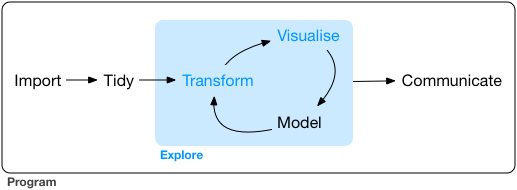
- **Explore**: visualize, describe, discover
]
.pull-right-center[
]
---
# The data science pipeline
.pull-left[
**Preparatory work**
- **Problem definition** predict, infer, describe
- **Design** conceptualize, build data collection device
- **Data collection** recruit, collect, monitor
**Data operation**
- **Wrangle**: import, tidy, manipulate
- **Explore**: visualize, describe, discover
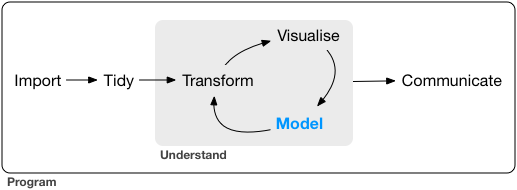
- **Model**: build, test, infer, predict
]
.pull-right-center[
]
---
# The data science pipeline
.pull-left[
**Preparatory work**
- **Problem definition** predict, infer, describe
- **Design** conceptualize, build data collection device
- **Data collection** recruit, collect, monitor
**Data operation**
- **Wrangle**: import, tidy, manipulate
- **Explore**: visualize, describe, discover
- **Model**: build, test, infer, predict
**Dissemination**
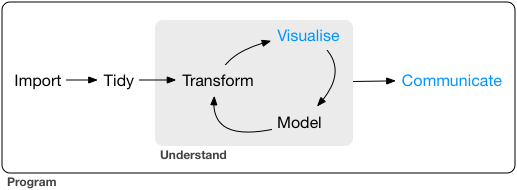
- **Communicate**: to the public, media, policymakers
- **Publish**: journals/proceedings, blogs, software
- **Productize**: make usable, robust, scalable
]
.pull-right-center[
]
---
# The data science pipeline
.pull-left[
**Preparatory work**
- **Problem definition** predict, infer, describe
- **Design** conceptualize, build data collection device
- **Data collection** recruit, collect, monitor
**Data operation**
- **Wrangle**: import, tidy, manipulate
- **Explore**: visualize, describe, discover
- **Model**: build, test, infer, predict
**Dissemination**
- **Communicate**: to the public, media, policymakers
- **Publish**: journals/proceedings, blogs, software
- **Productize**: make usable, robust, scalable
**Meta skill: programming**
]
.pull-right-center[
]
---
# The data science pipeline
.pull-left[
**Preparatory work**
- **Problem definition** predict, infer, describe
- **Design** conceptualize, build data collection device
- **Data collection** recruit, collect, monitor
**Data operation**
- **Wrangle**: import, tidy, manipulate
- **Explore**: visualize, describe, discover
- **Model**: build, test, infer, predict
**Dissemination**
- **Communicate**: to the public, media, policymakers
- **Publish**: journals/proceedings, blogs, software
- **Productize**: make usable, robust, scalable
**Meta skill: programming with R**
]
.pull-right-center[
]
---
class: inverse, center, middle
name: preview
# Sneak preview
---
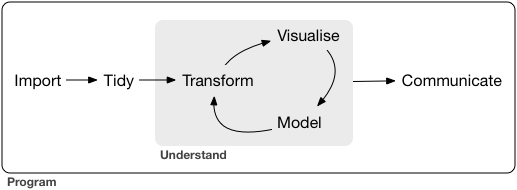
# Introduction to Data Science in a nutshell
---
class: inverse, center, middle
# Sneak preview
Learning to love a programming environment
---
class: center
background-color: #fff
# The tidyverse

---
class: inverse, center, middle
# Sneak preview
Collecting web data at scale
---
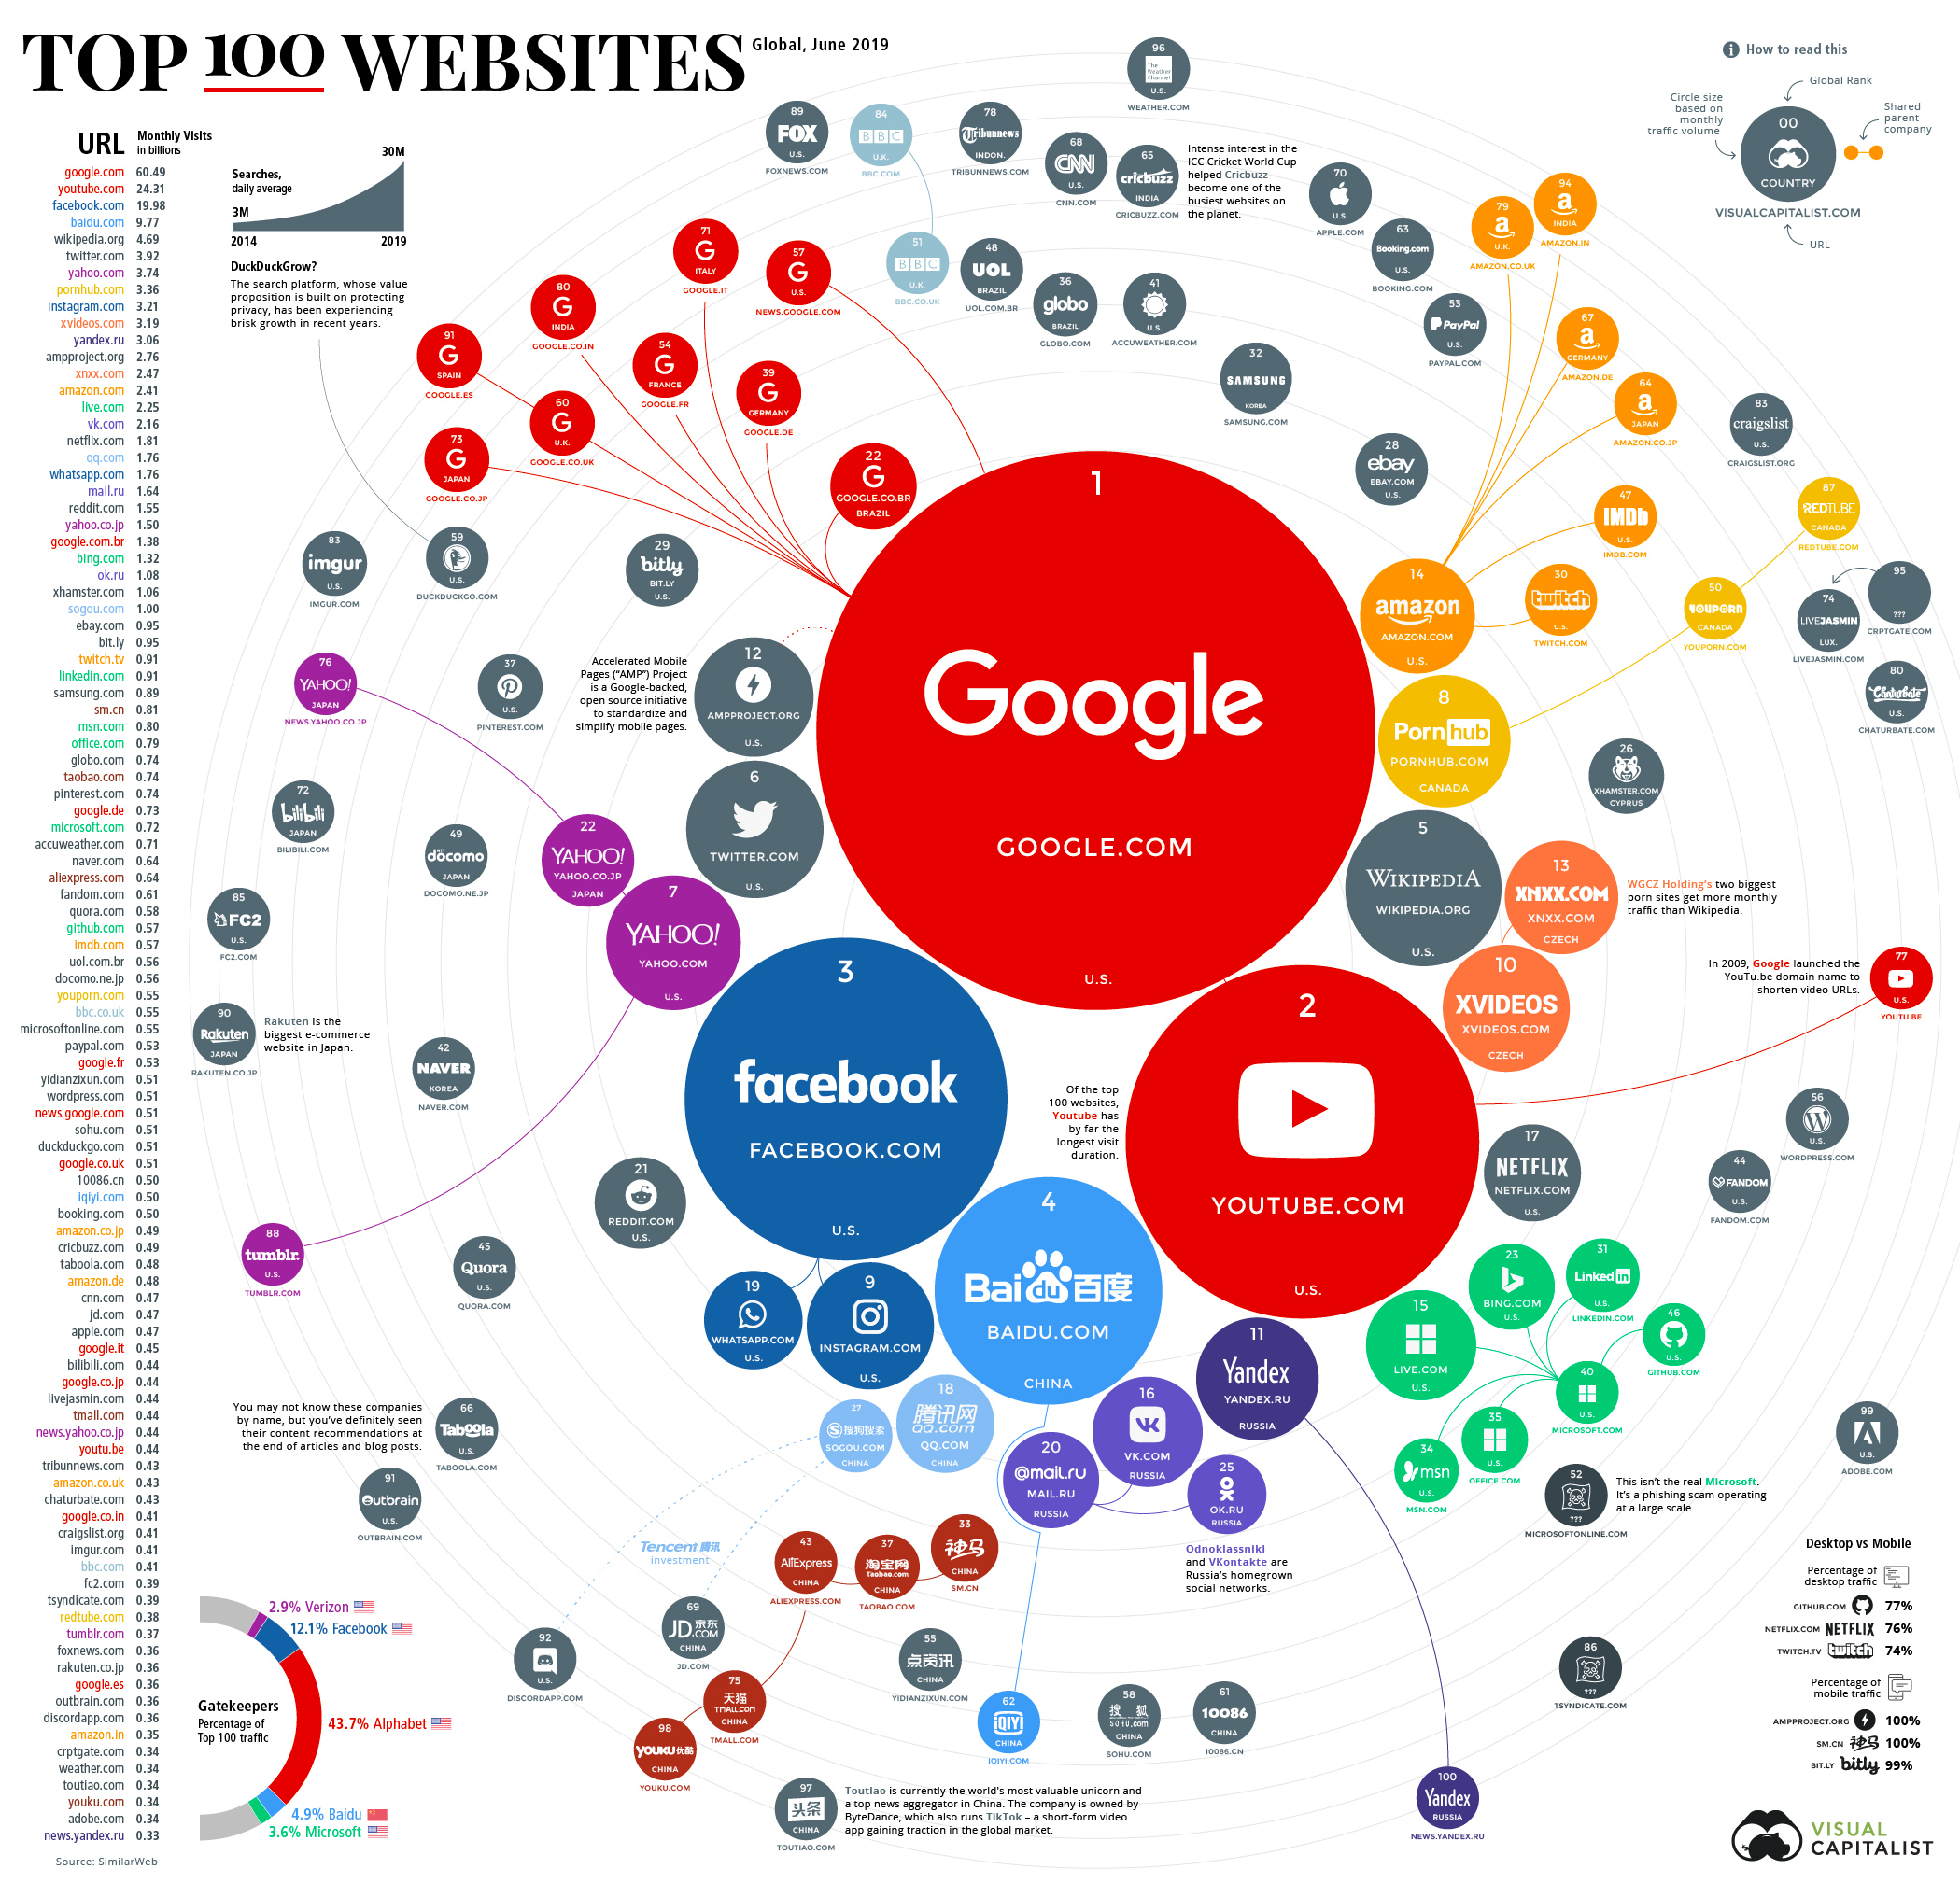
class: center
background-color: #fff
# Most popular websites 2019
---
# Scraping the web for social research
.pull-left-center[
]
.pull-right-center[
]
---
class: inverse, center, middle
# Sneak preview
Applying data science to tackle social problems
---
class: center
background-color: #fff
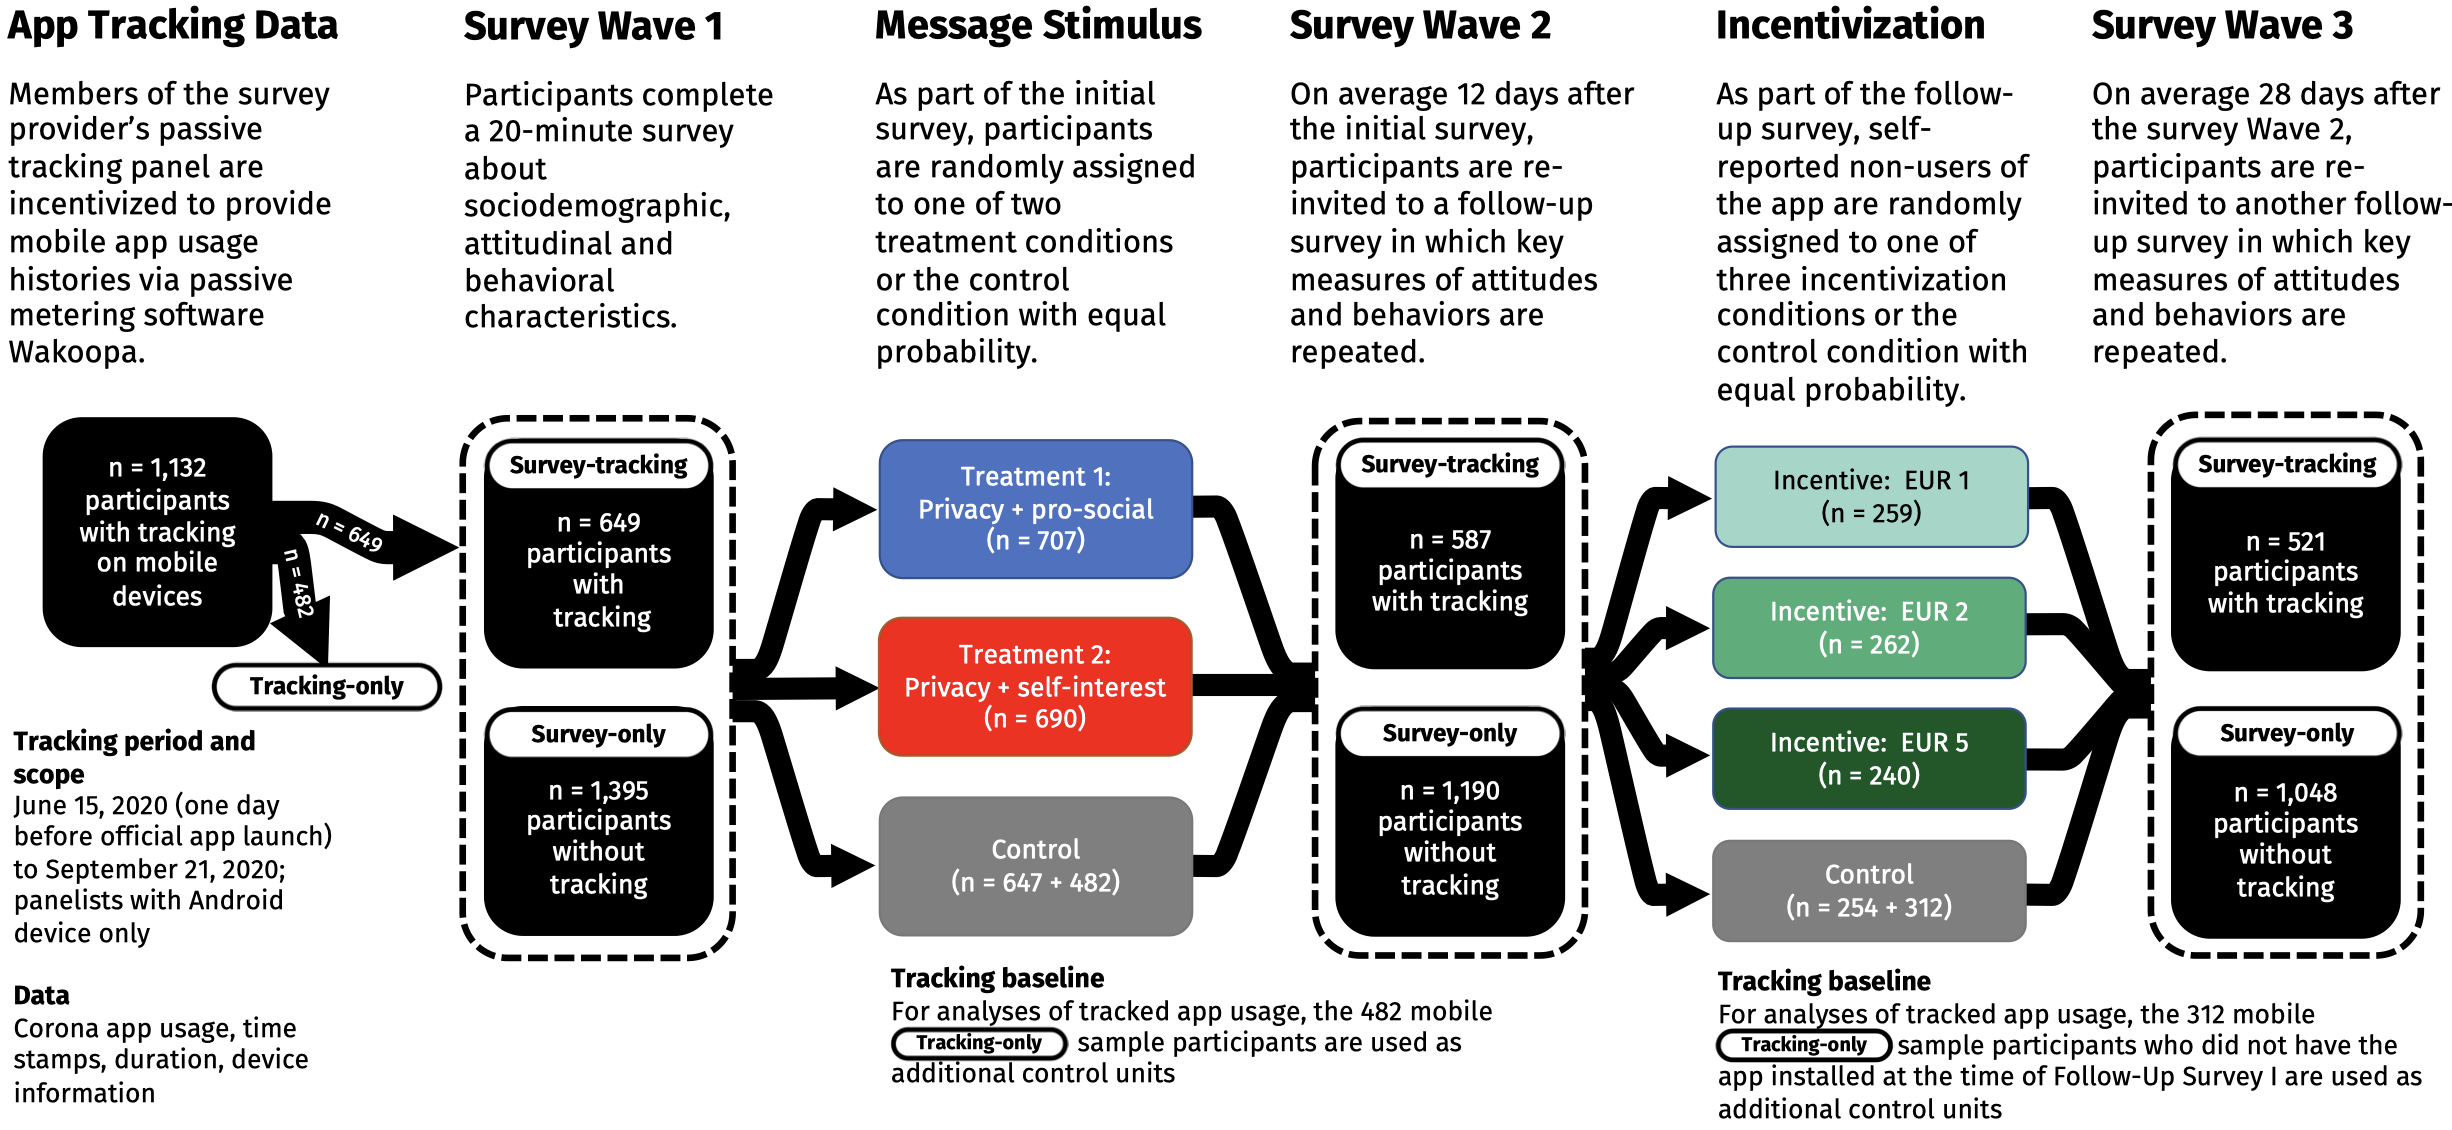
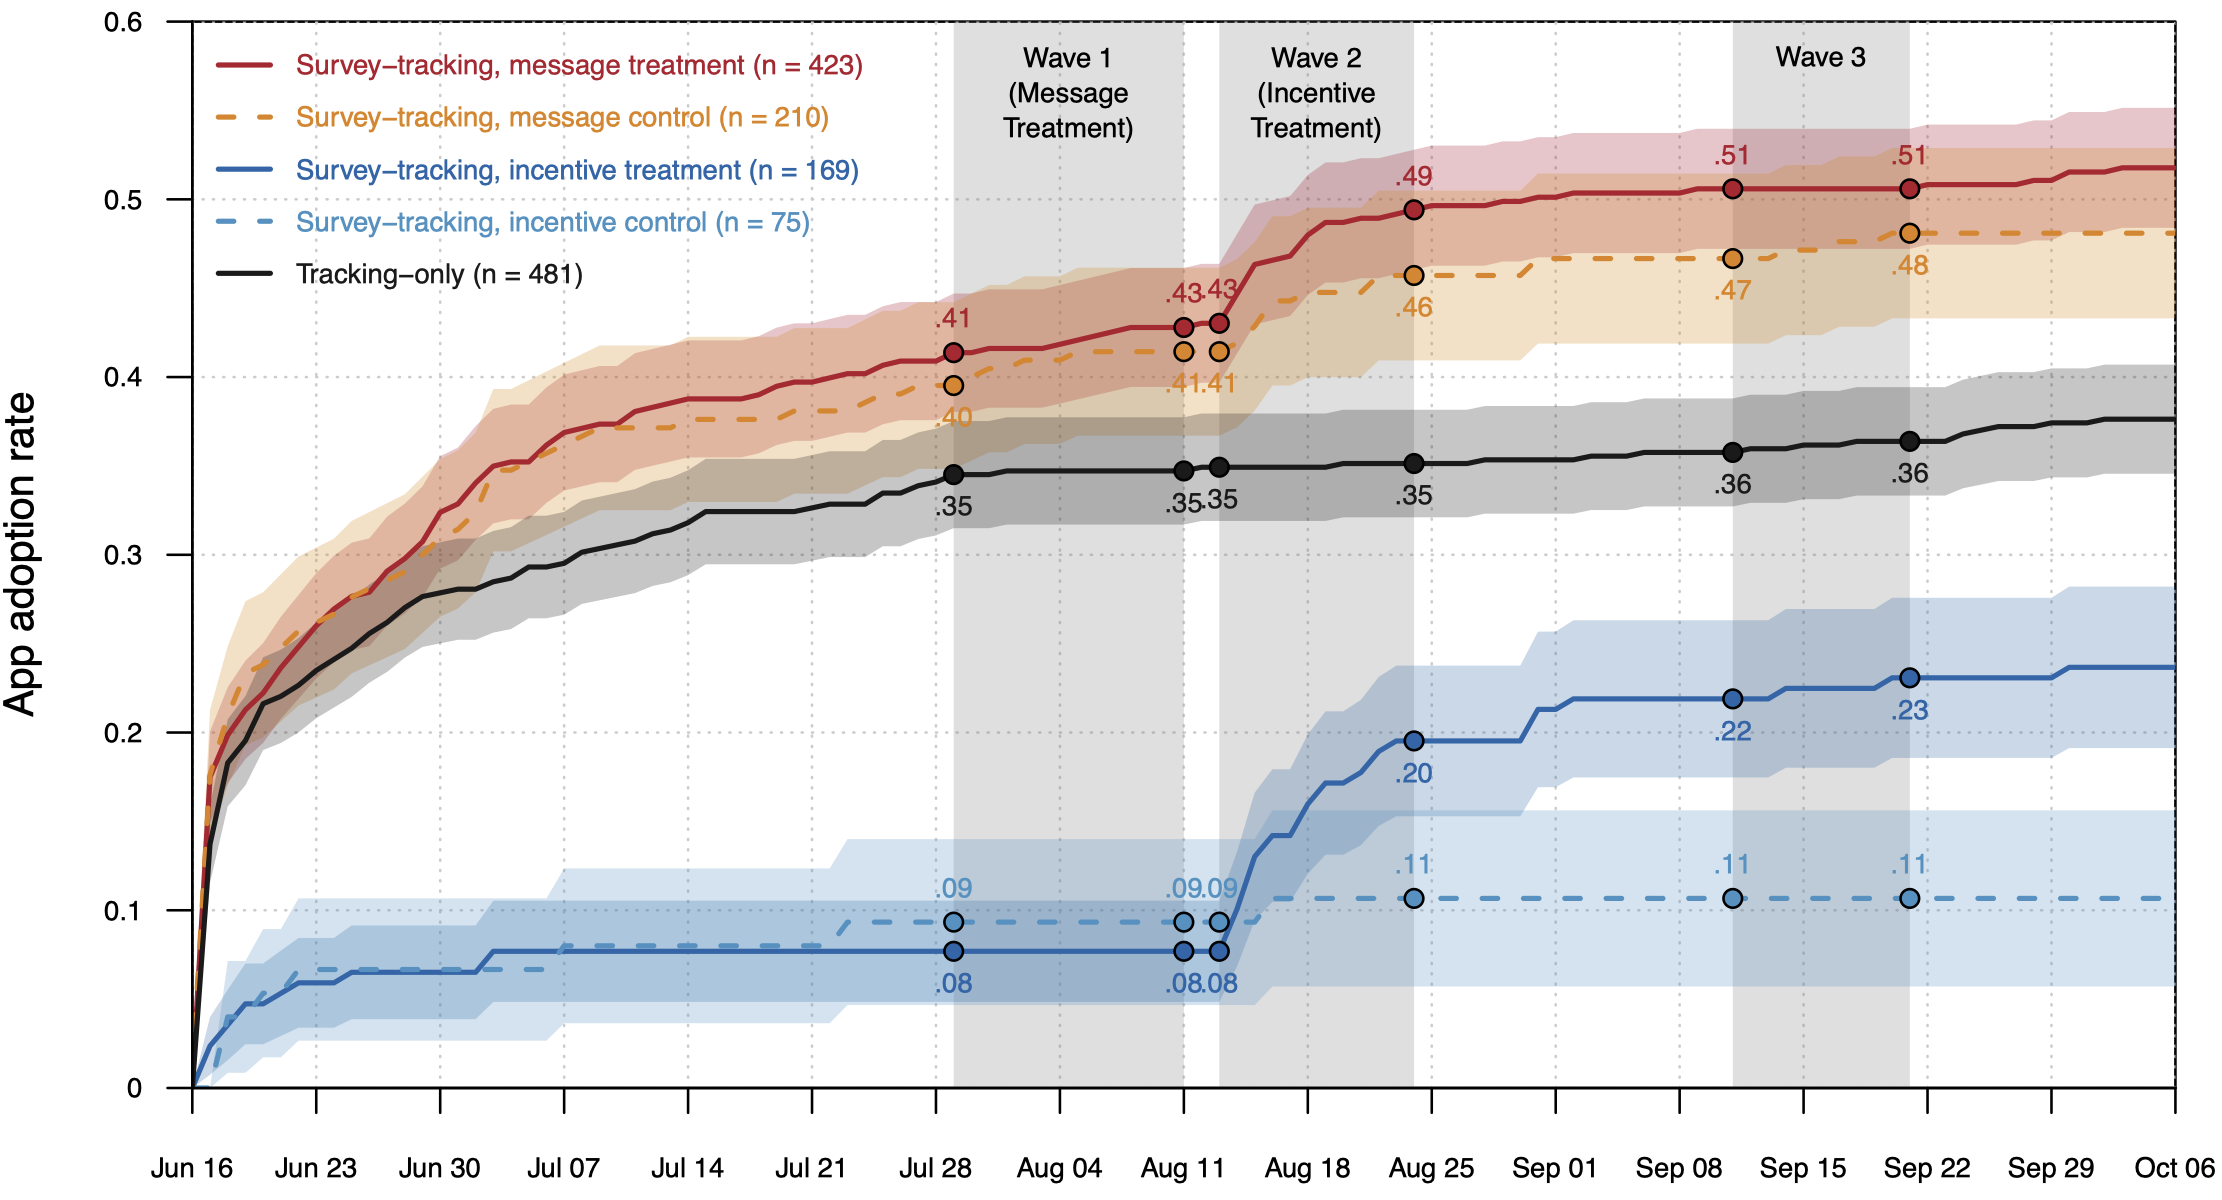
# Tracking the usage of a contact tracing app
.pull-left-center[

]
.pull-right-center[
]
---
class: center
background-color: #fff
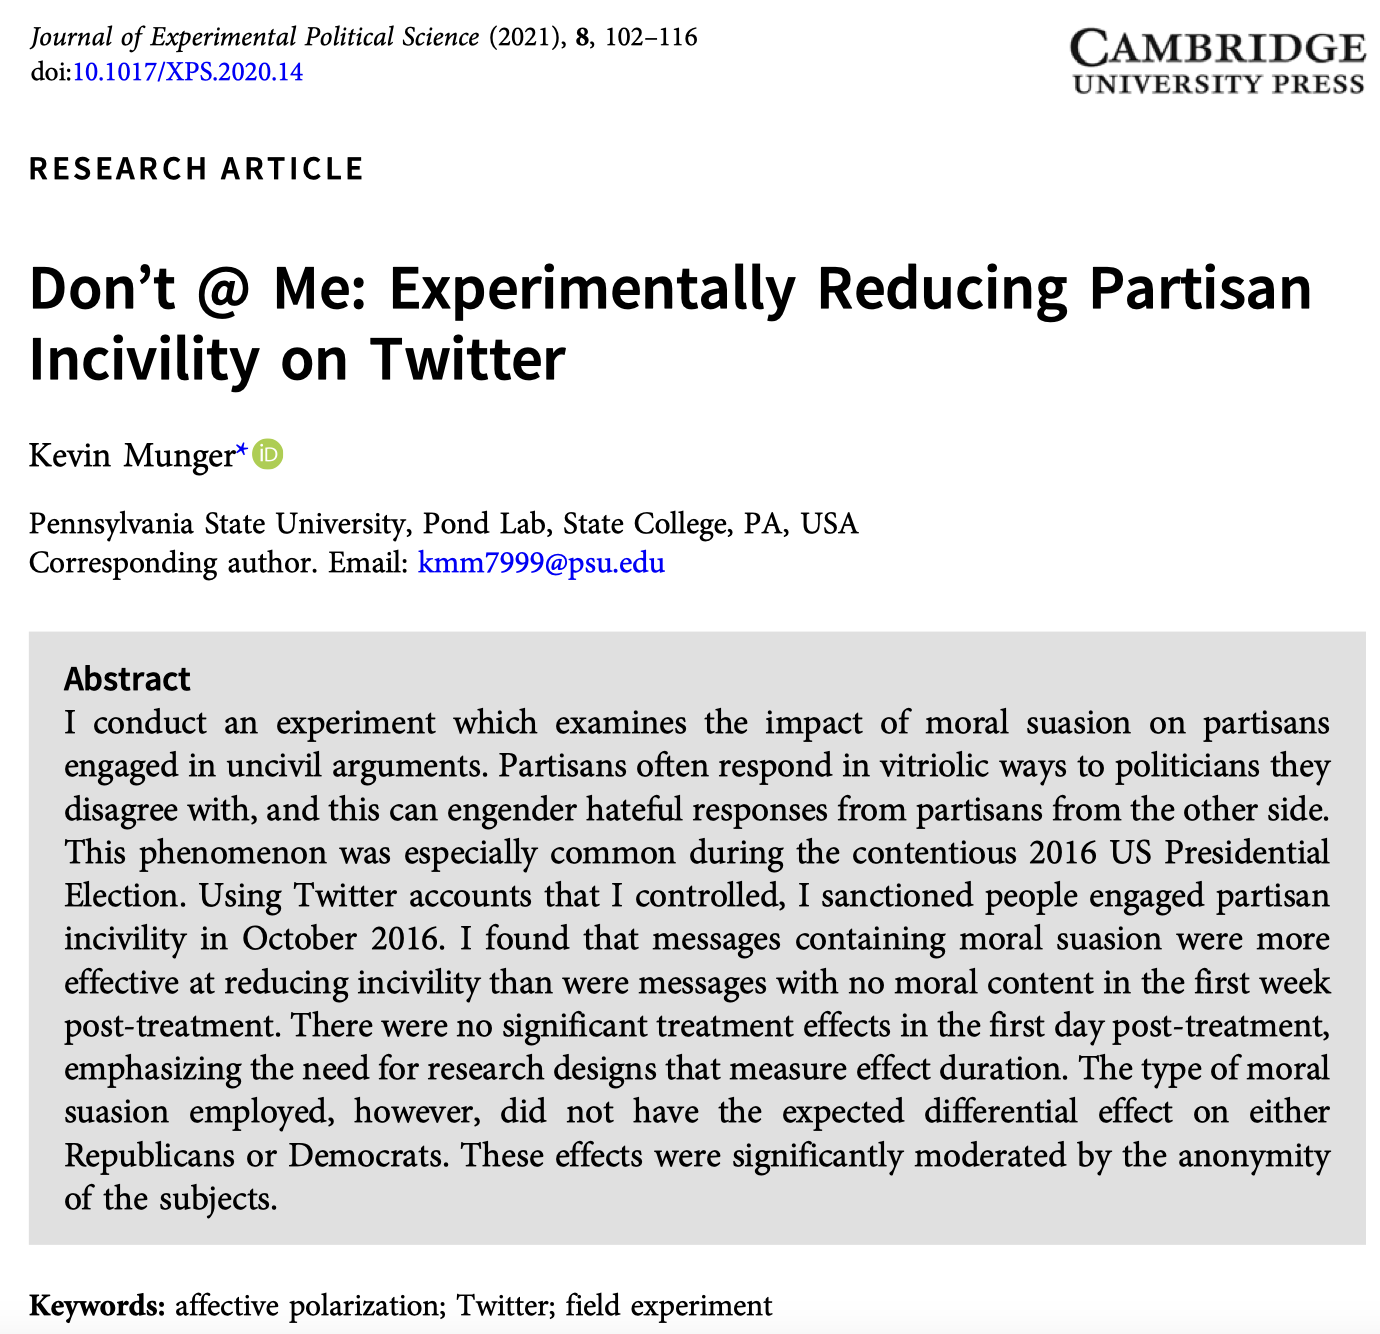
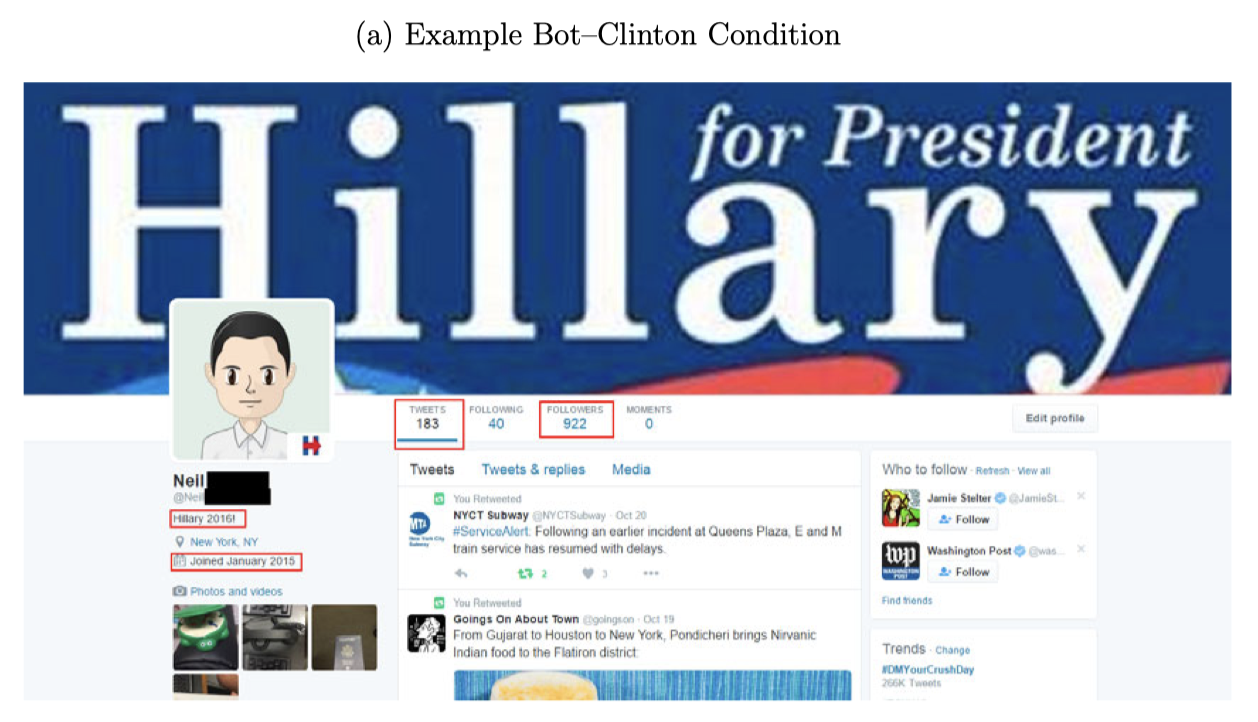
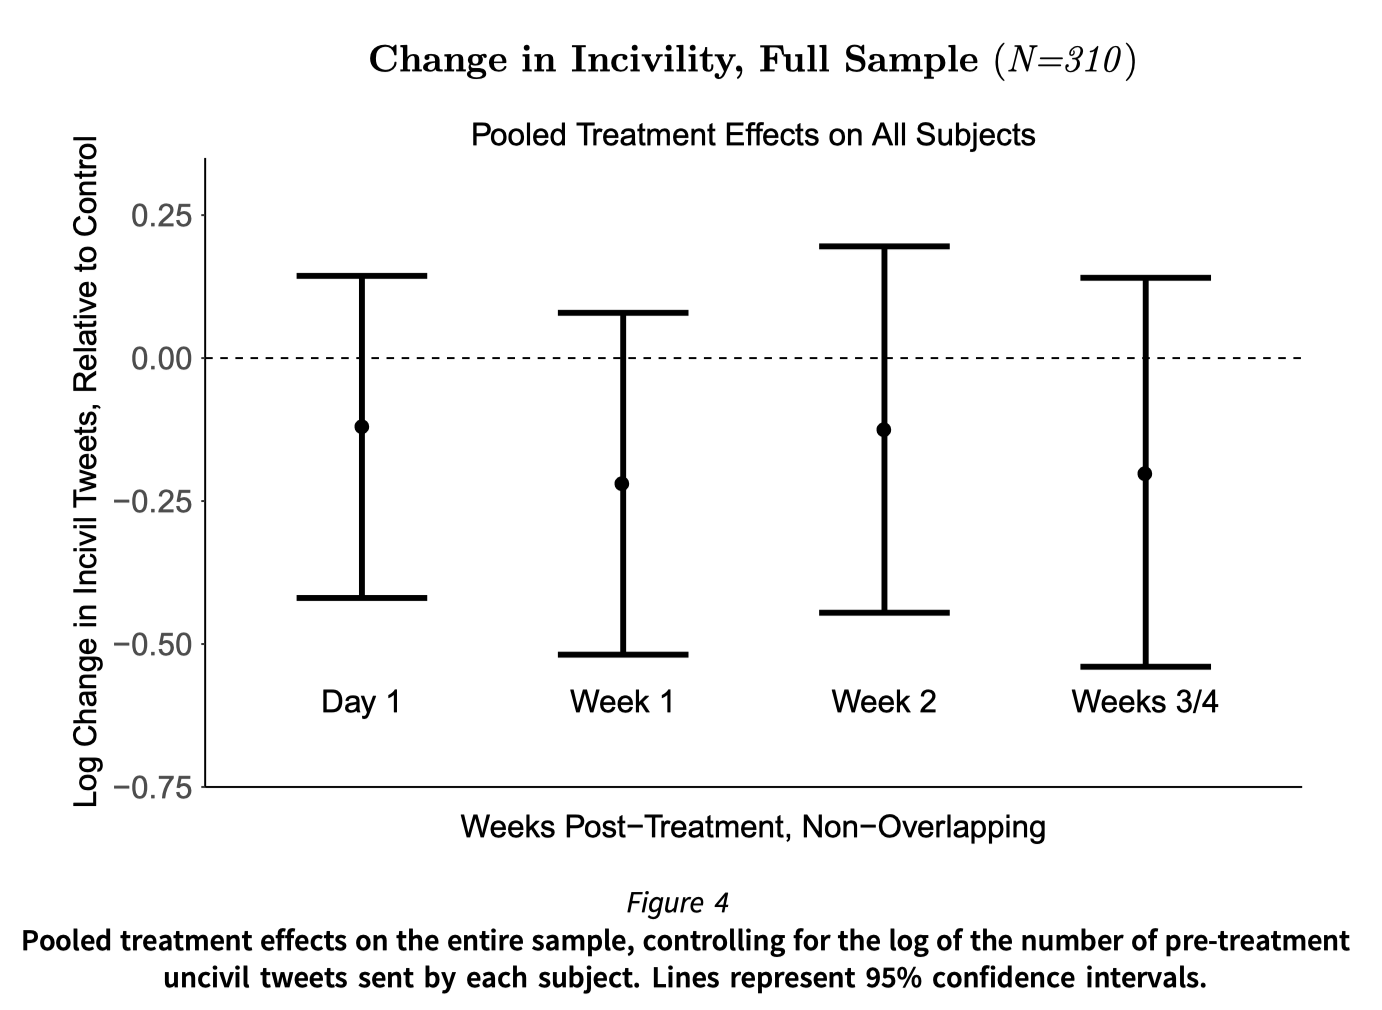
# Reducing hate speech on social media
.pull-left-center[
]
.pull-right-center[
]
---
class: center
background-color: #fff
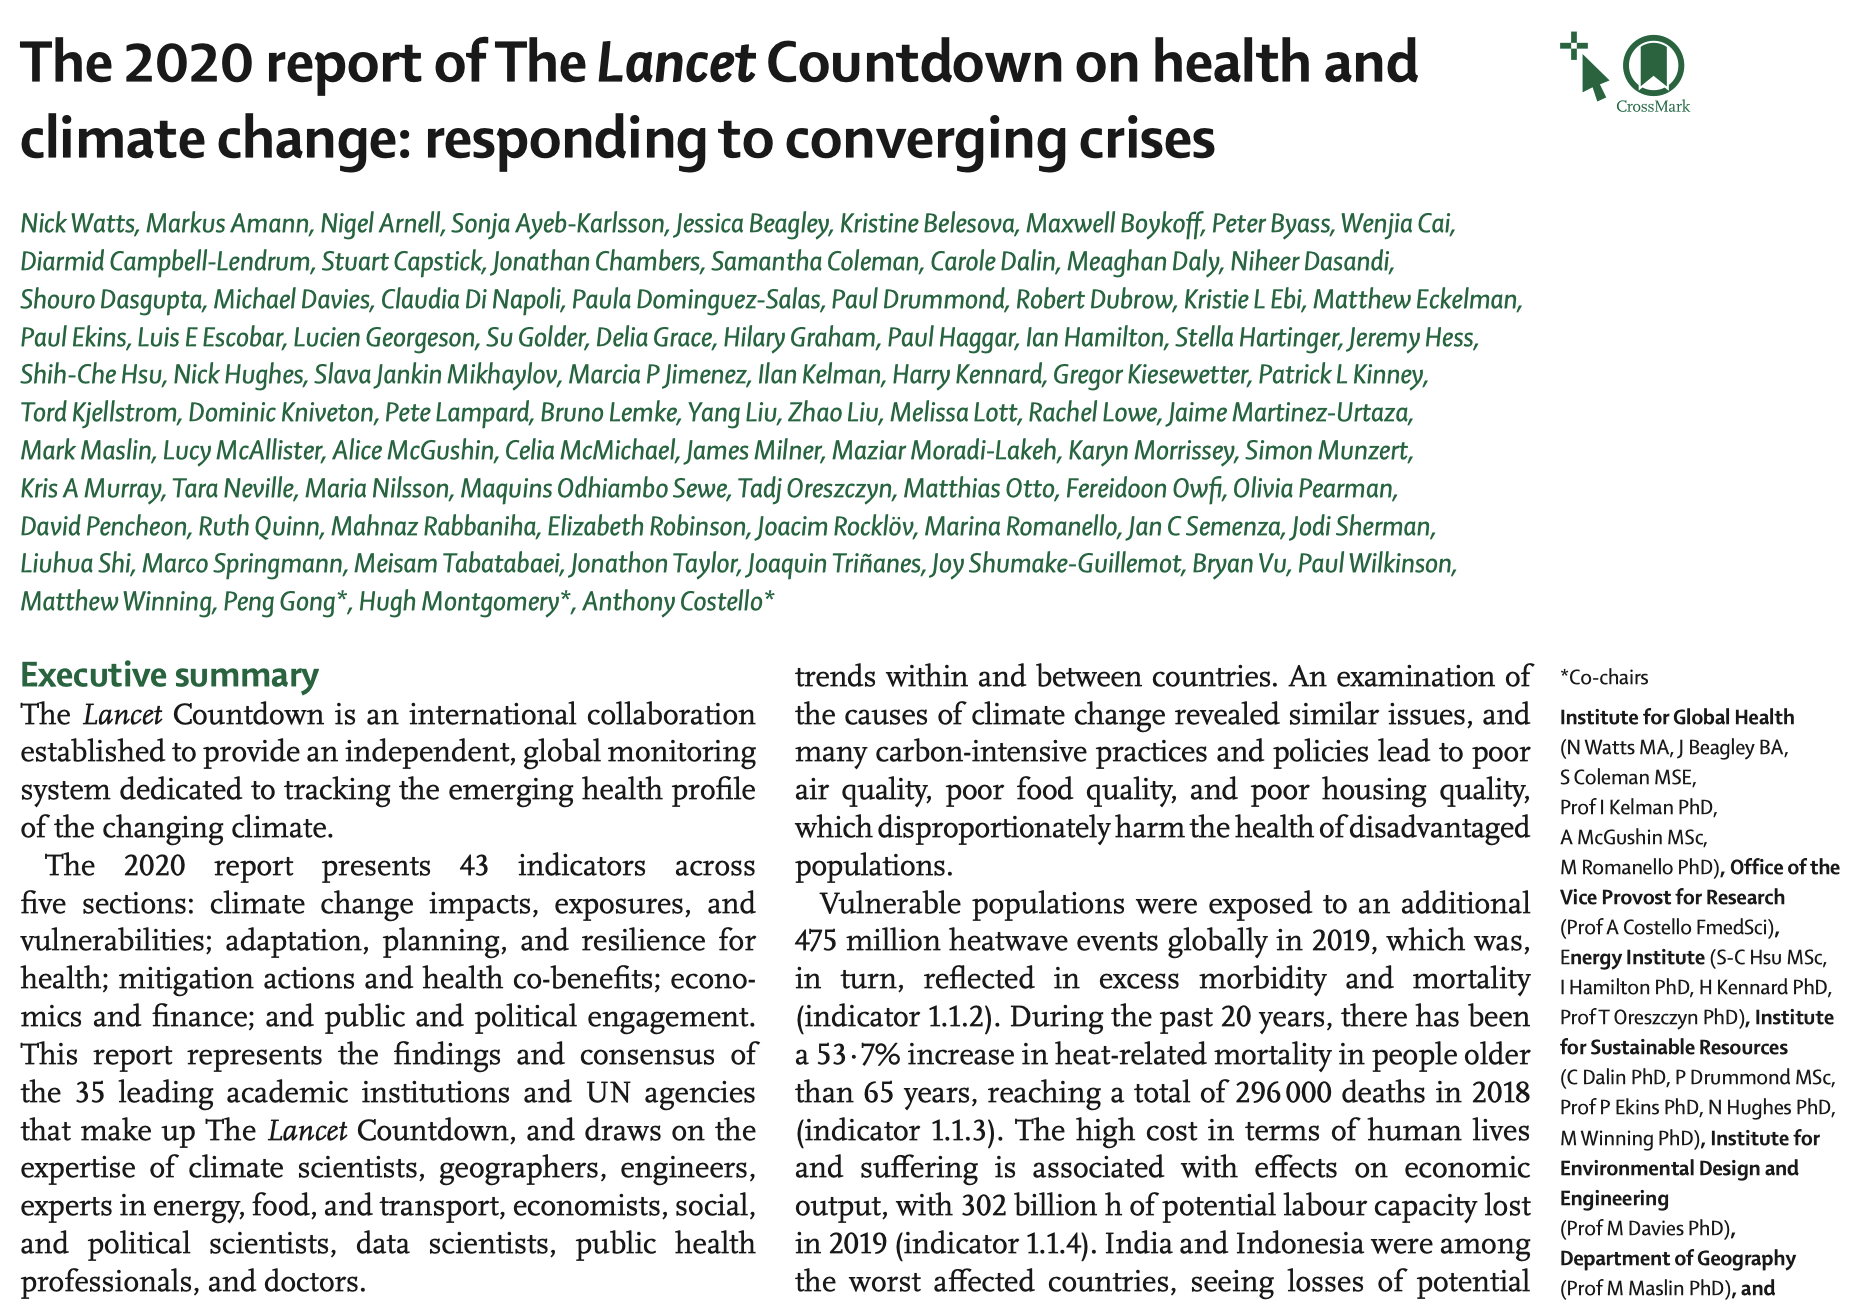
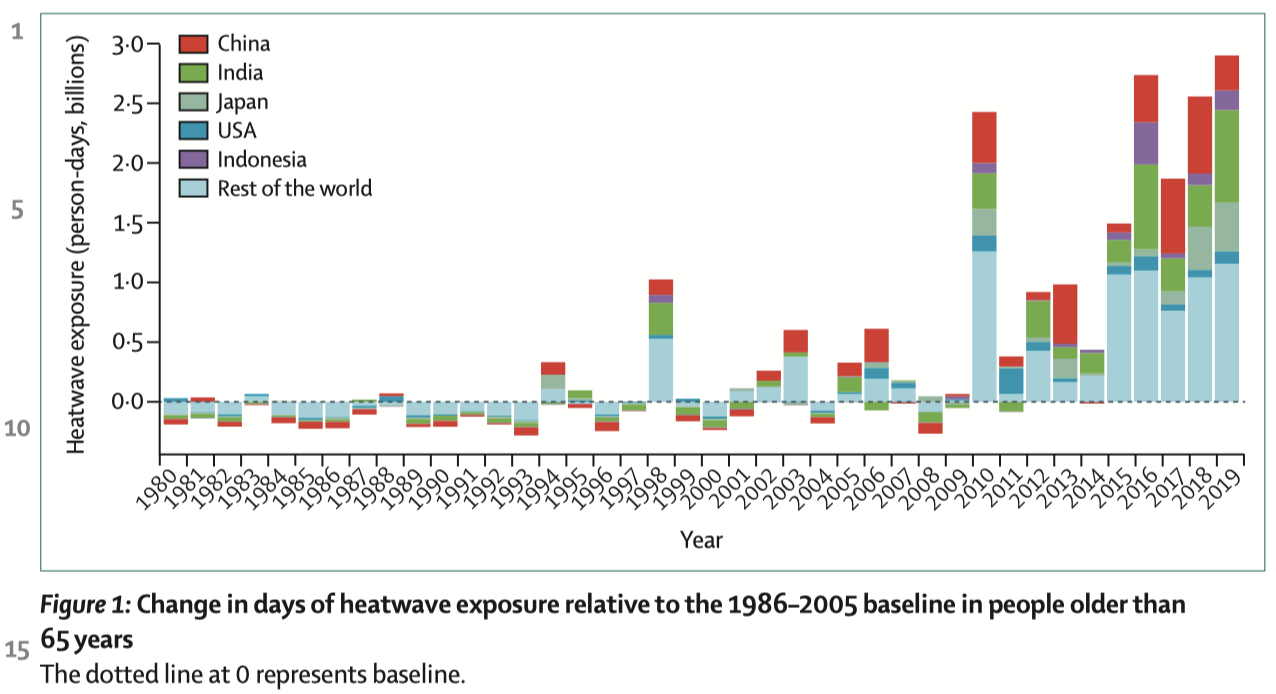
# Monitoring the effects of climate change on health
.pull-left-center[
]
.pull-right-center[
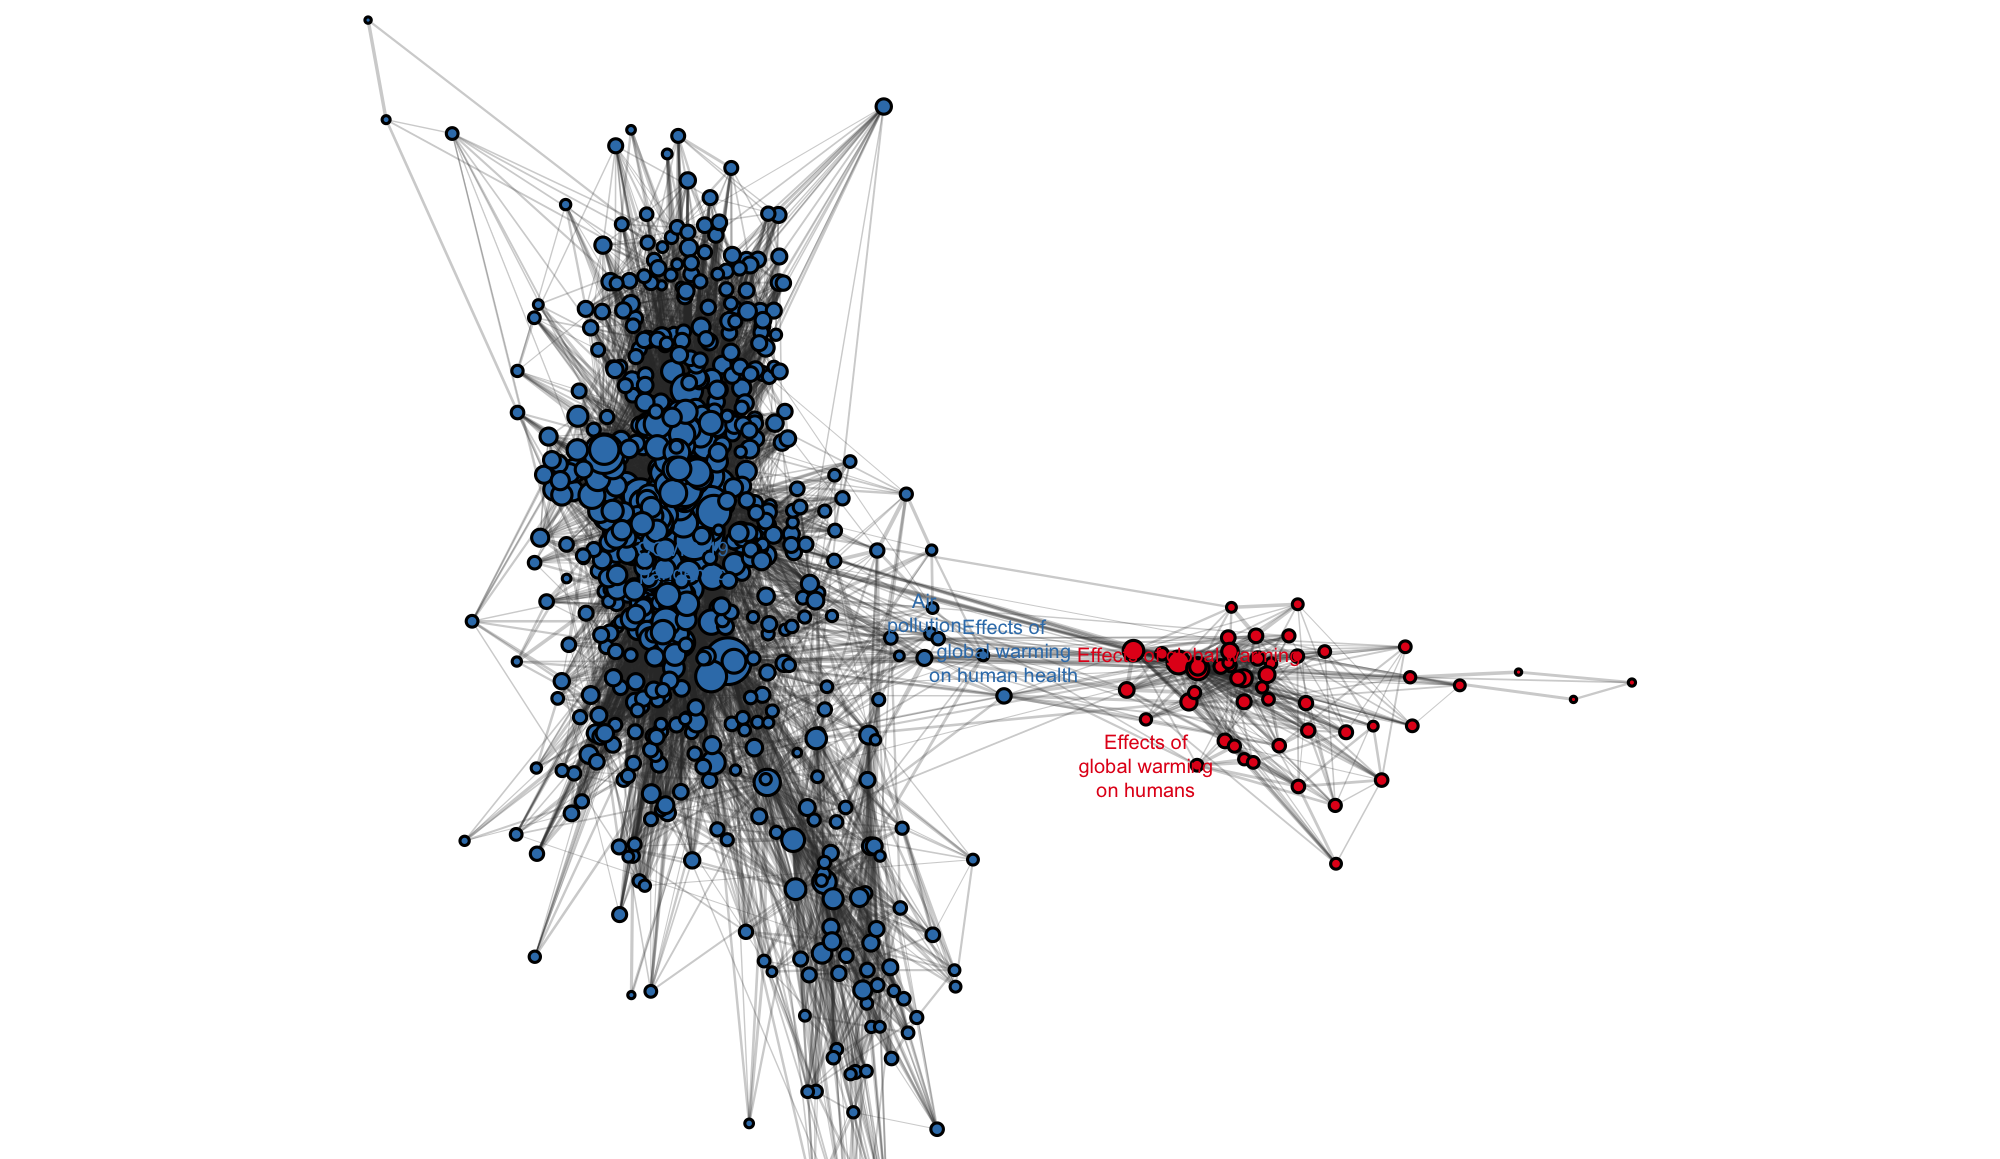
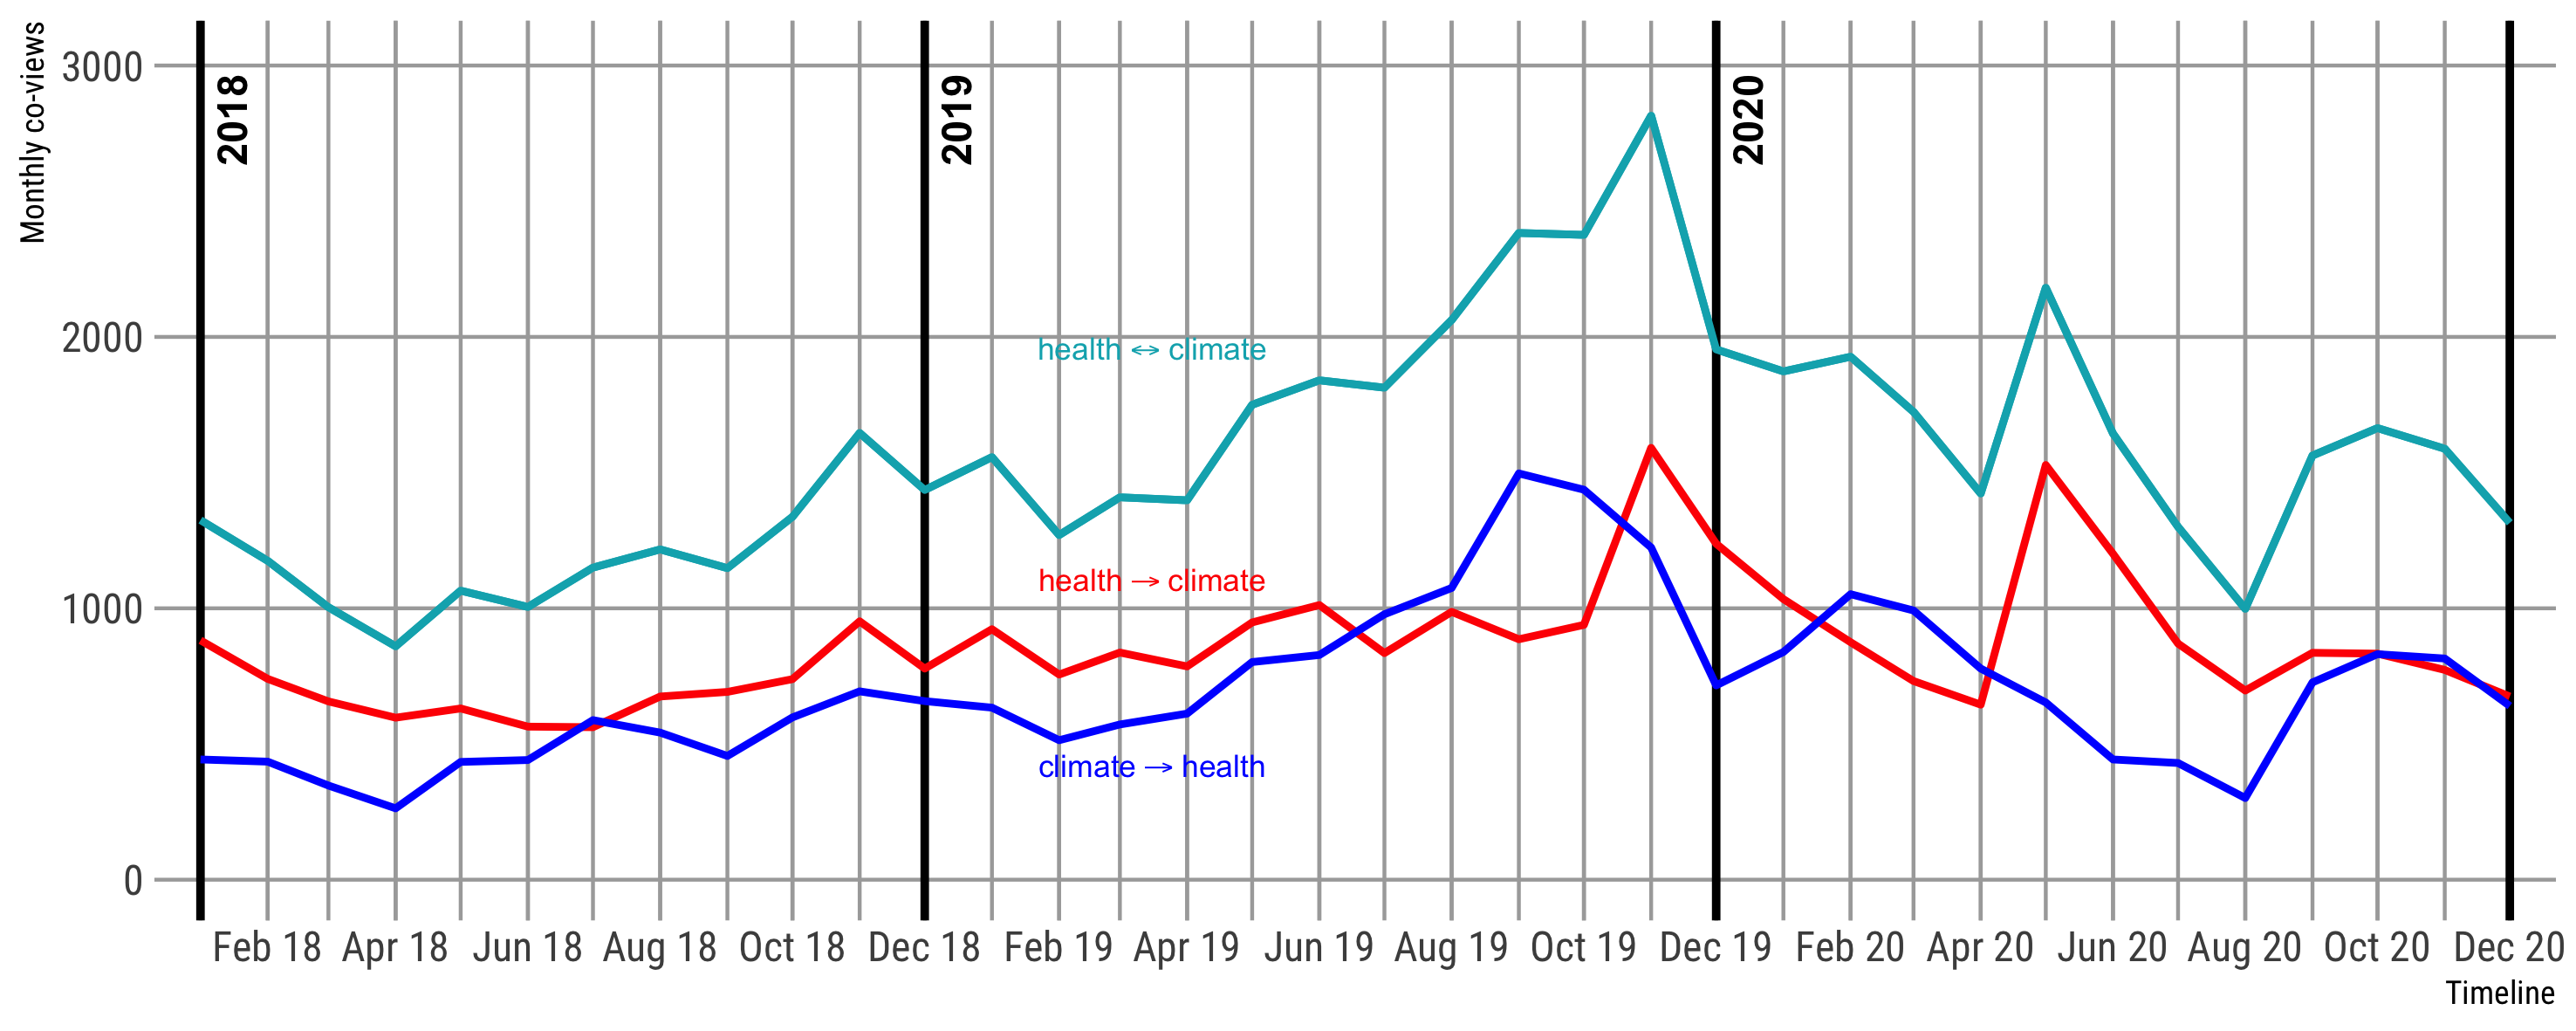
]
---
class: inverse, center, middle
# Sneak preview
Getting to know the limits of data
---
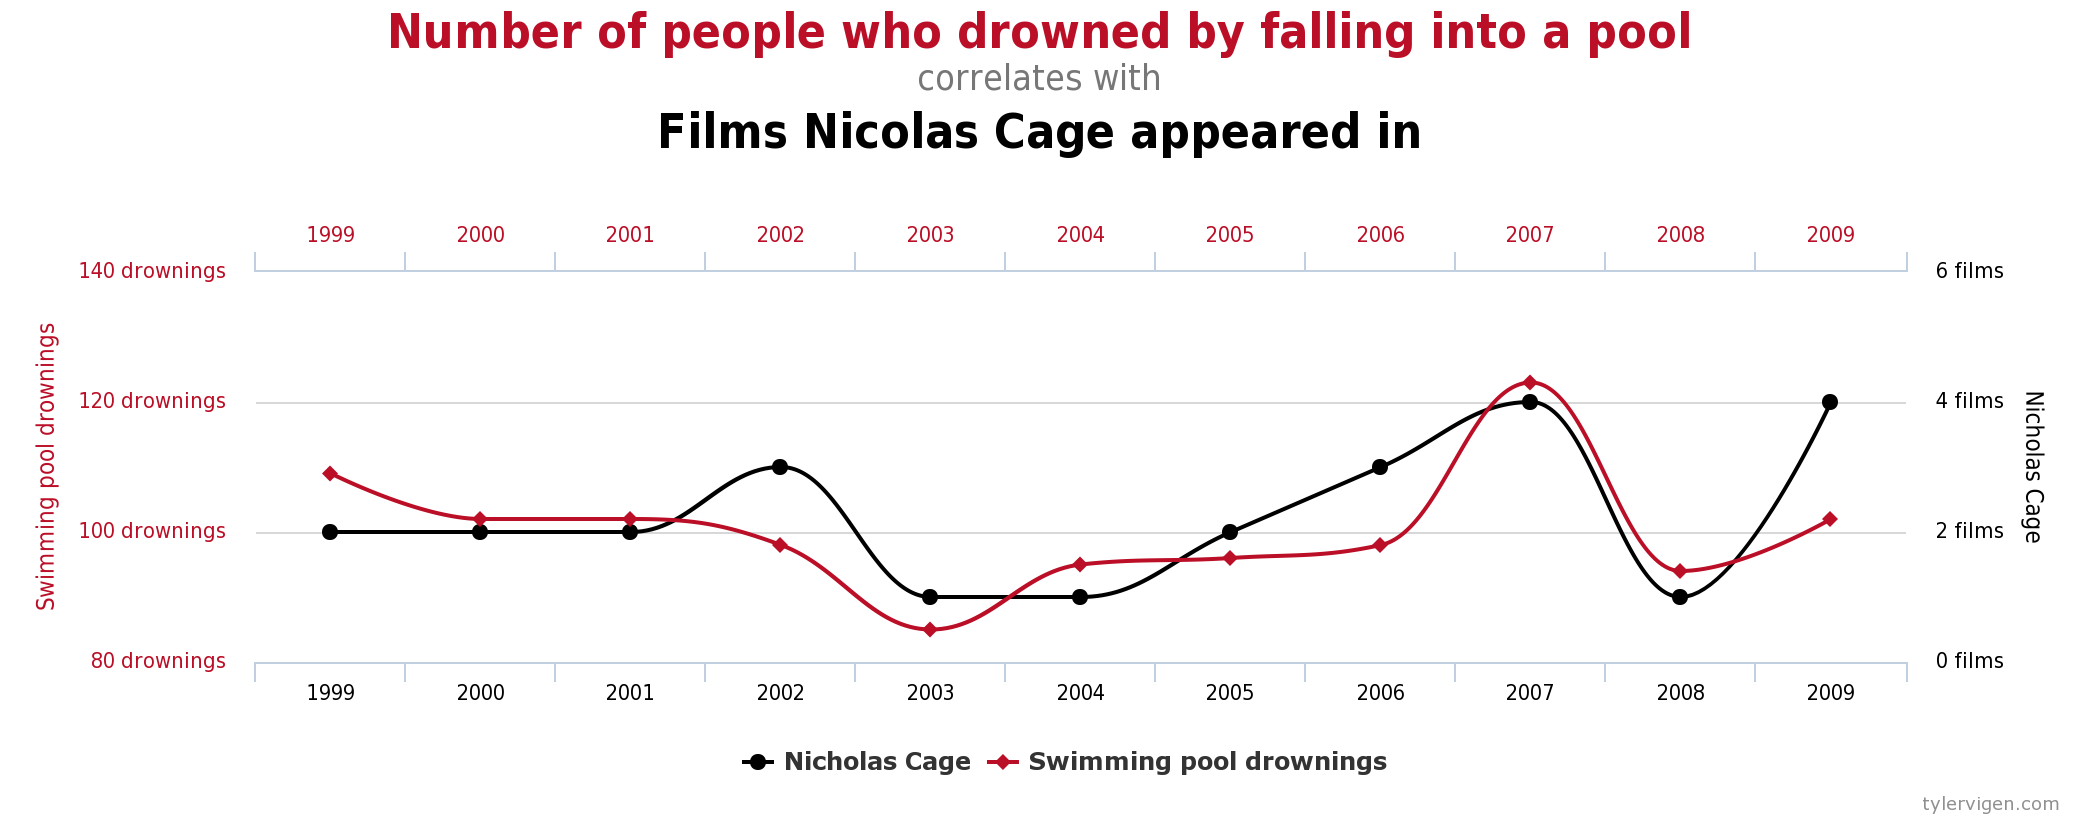
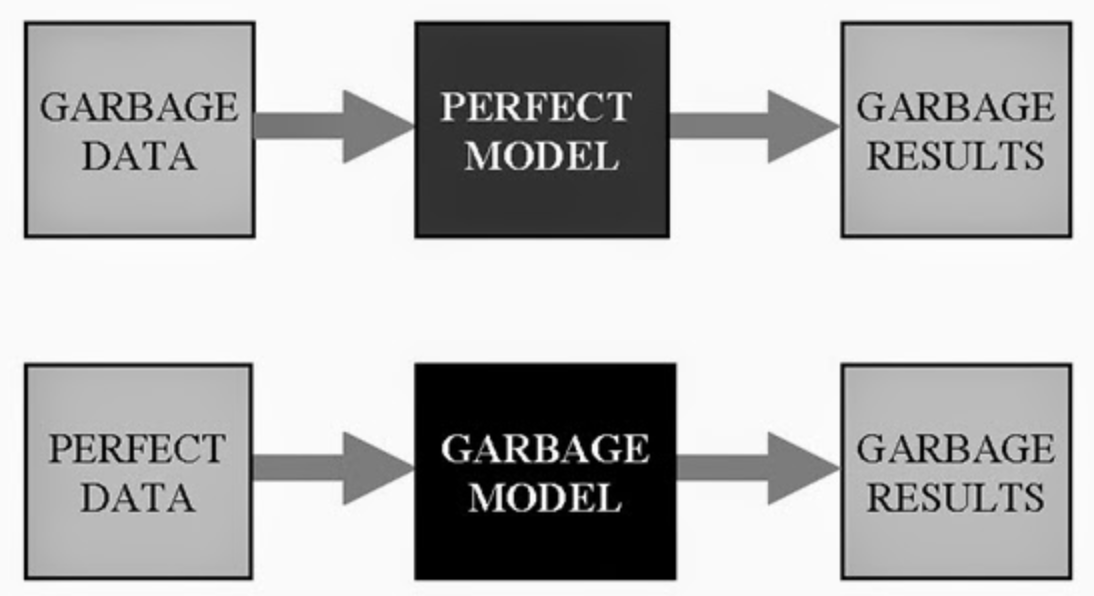
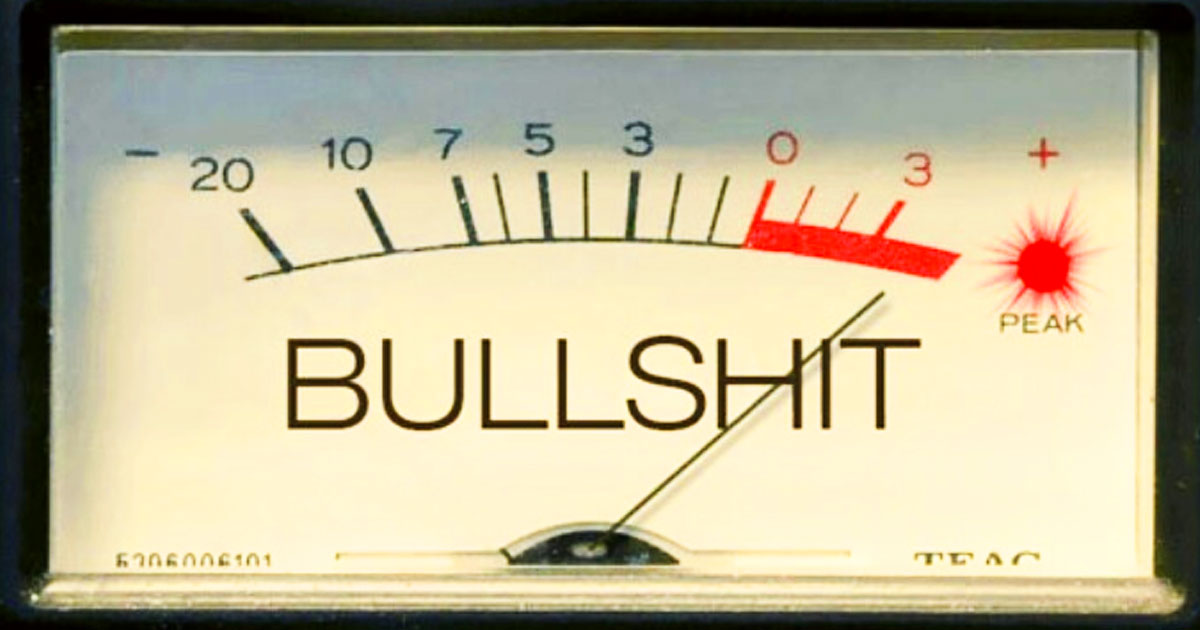
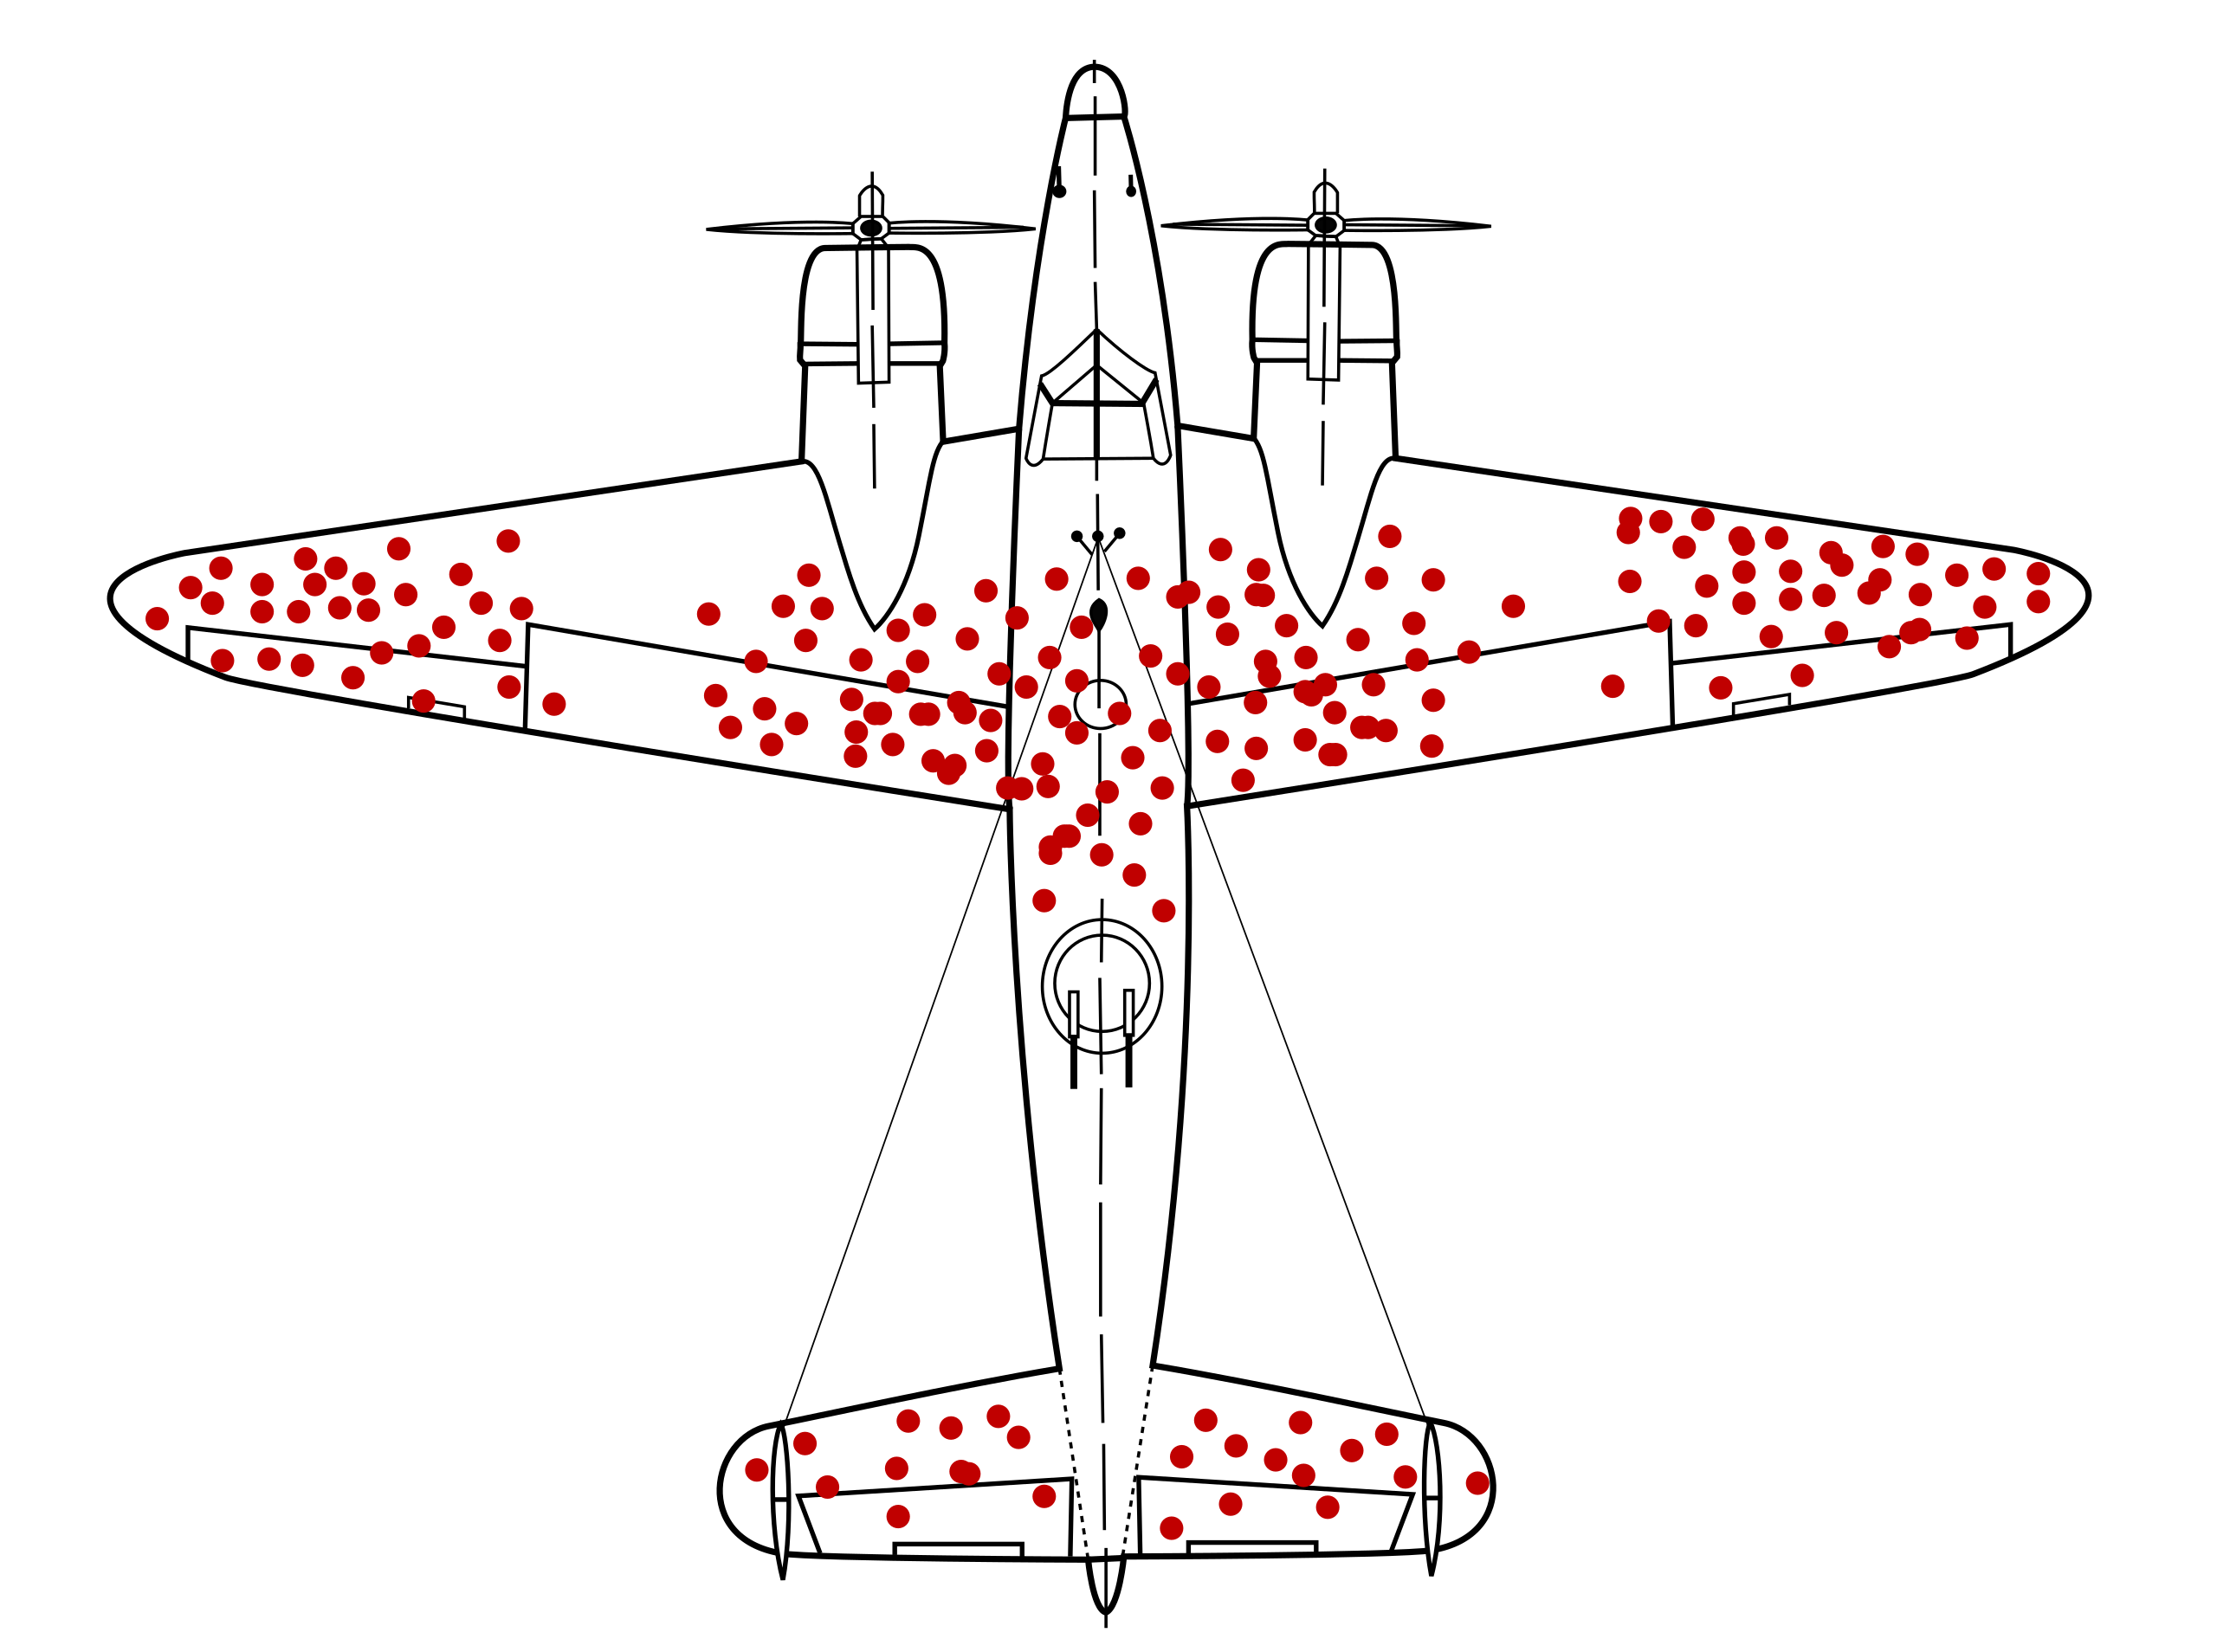
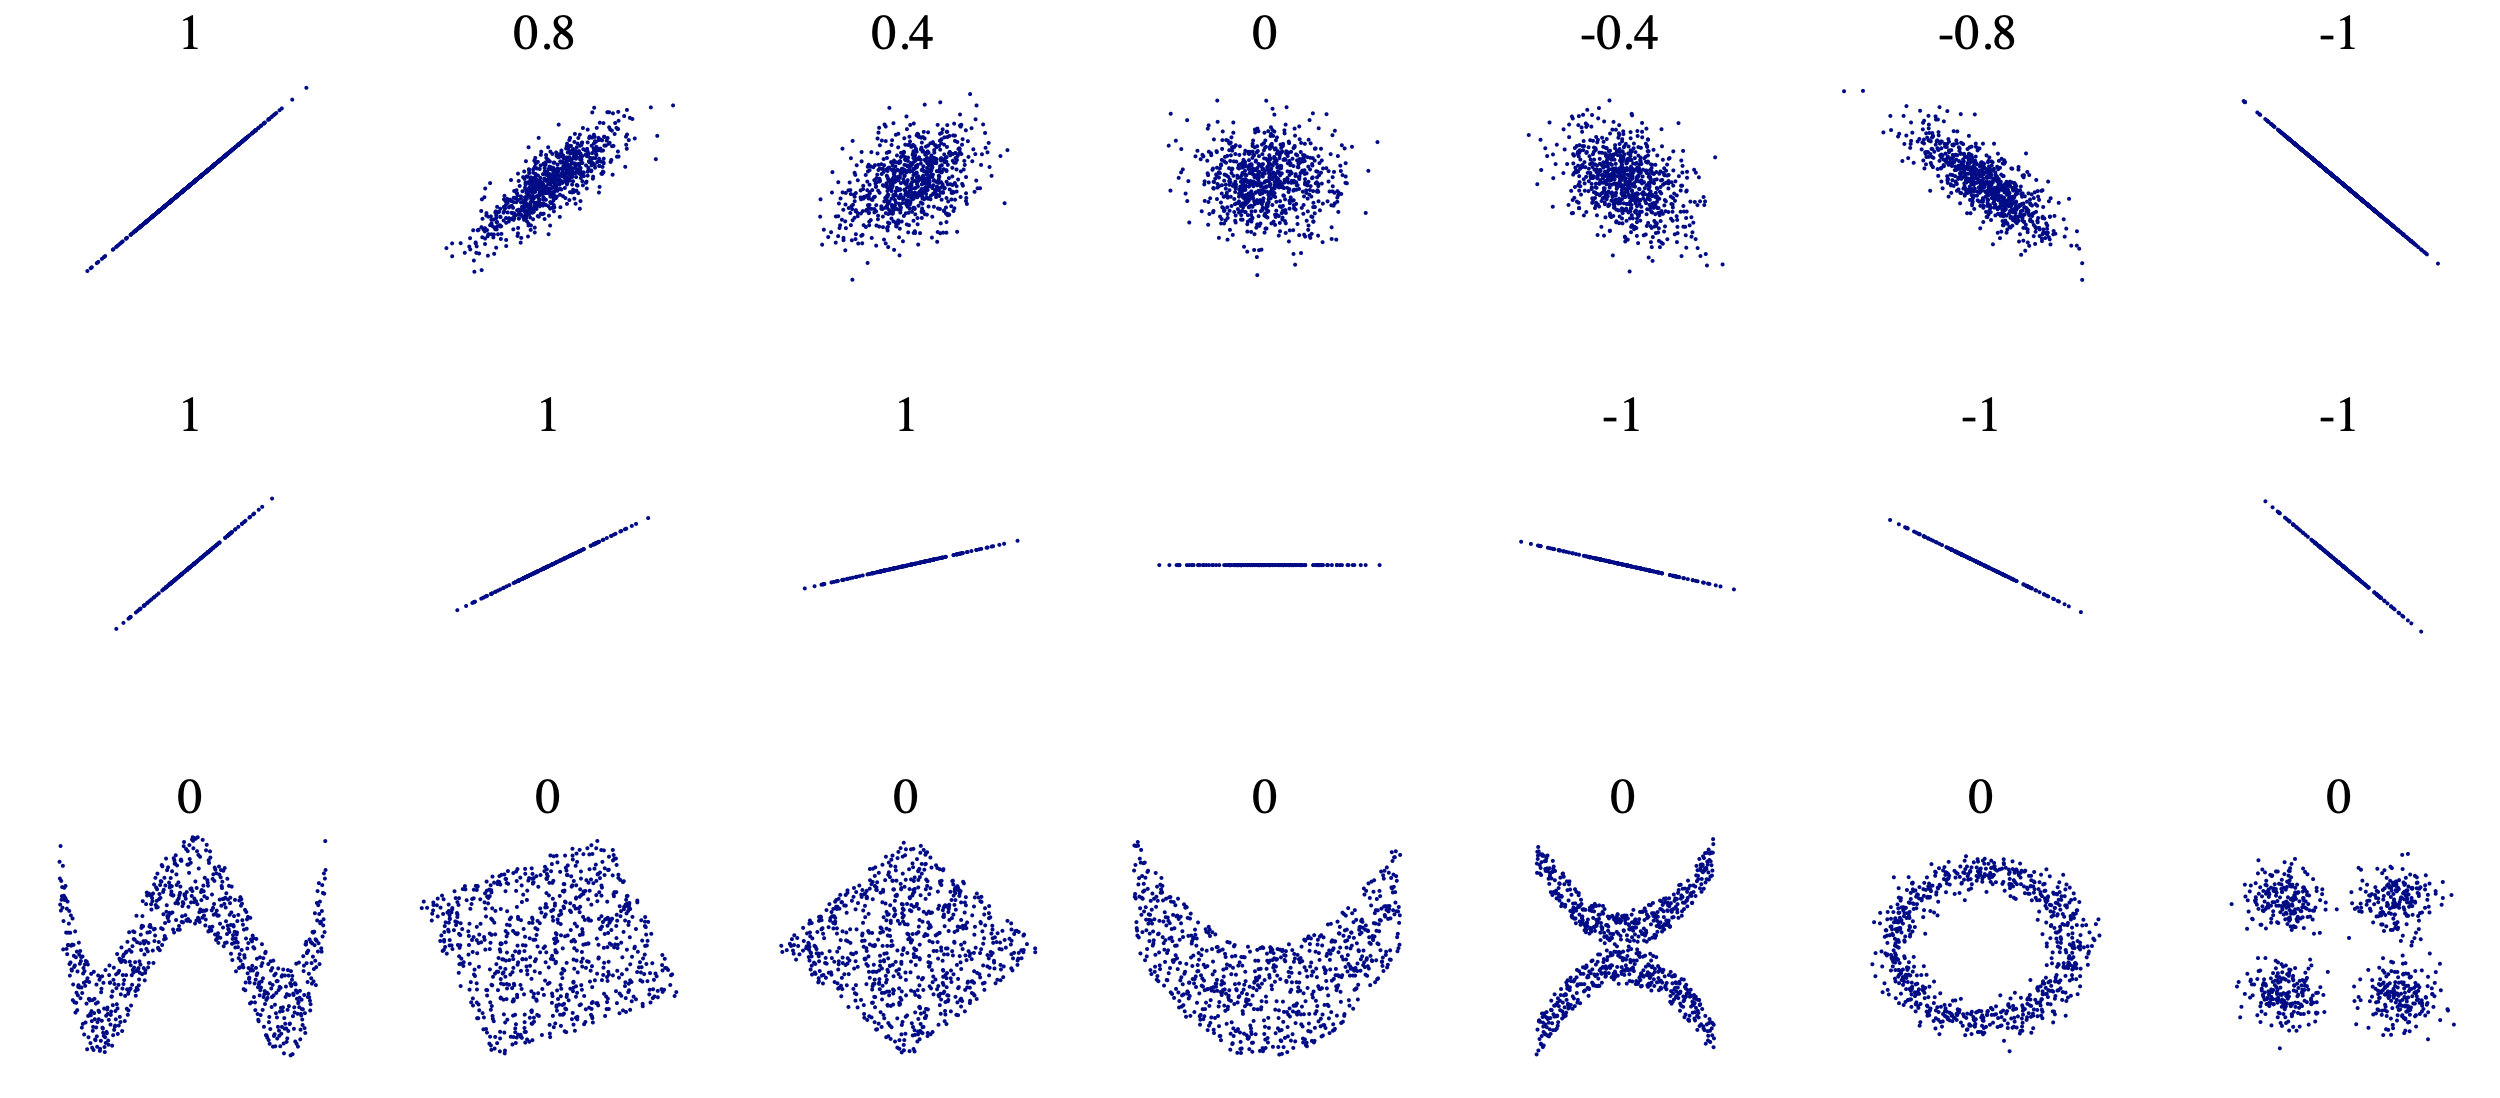
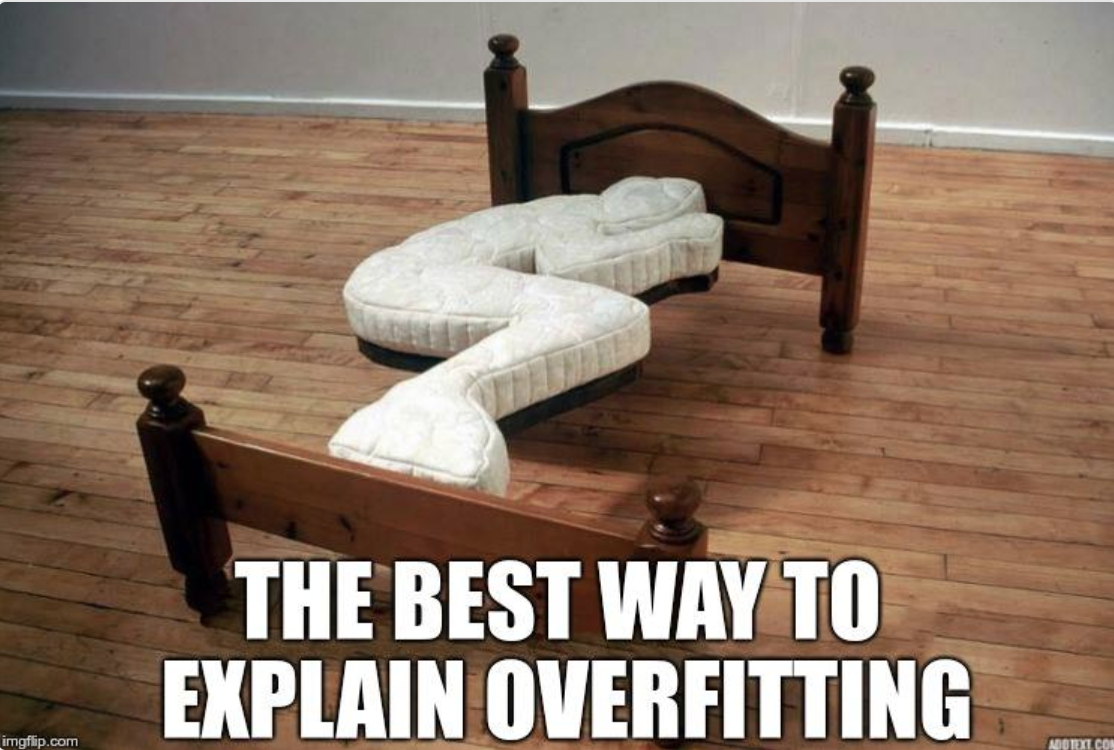
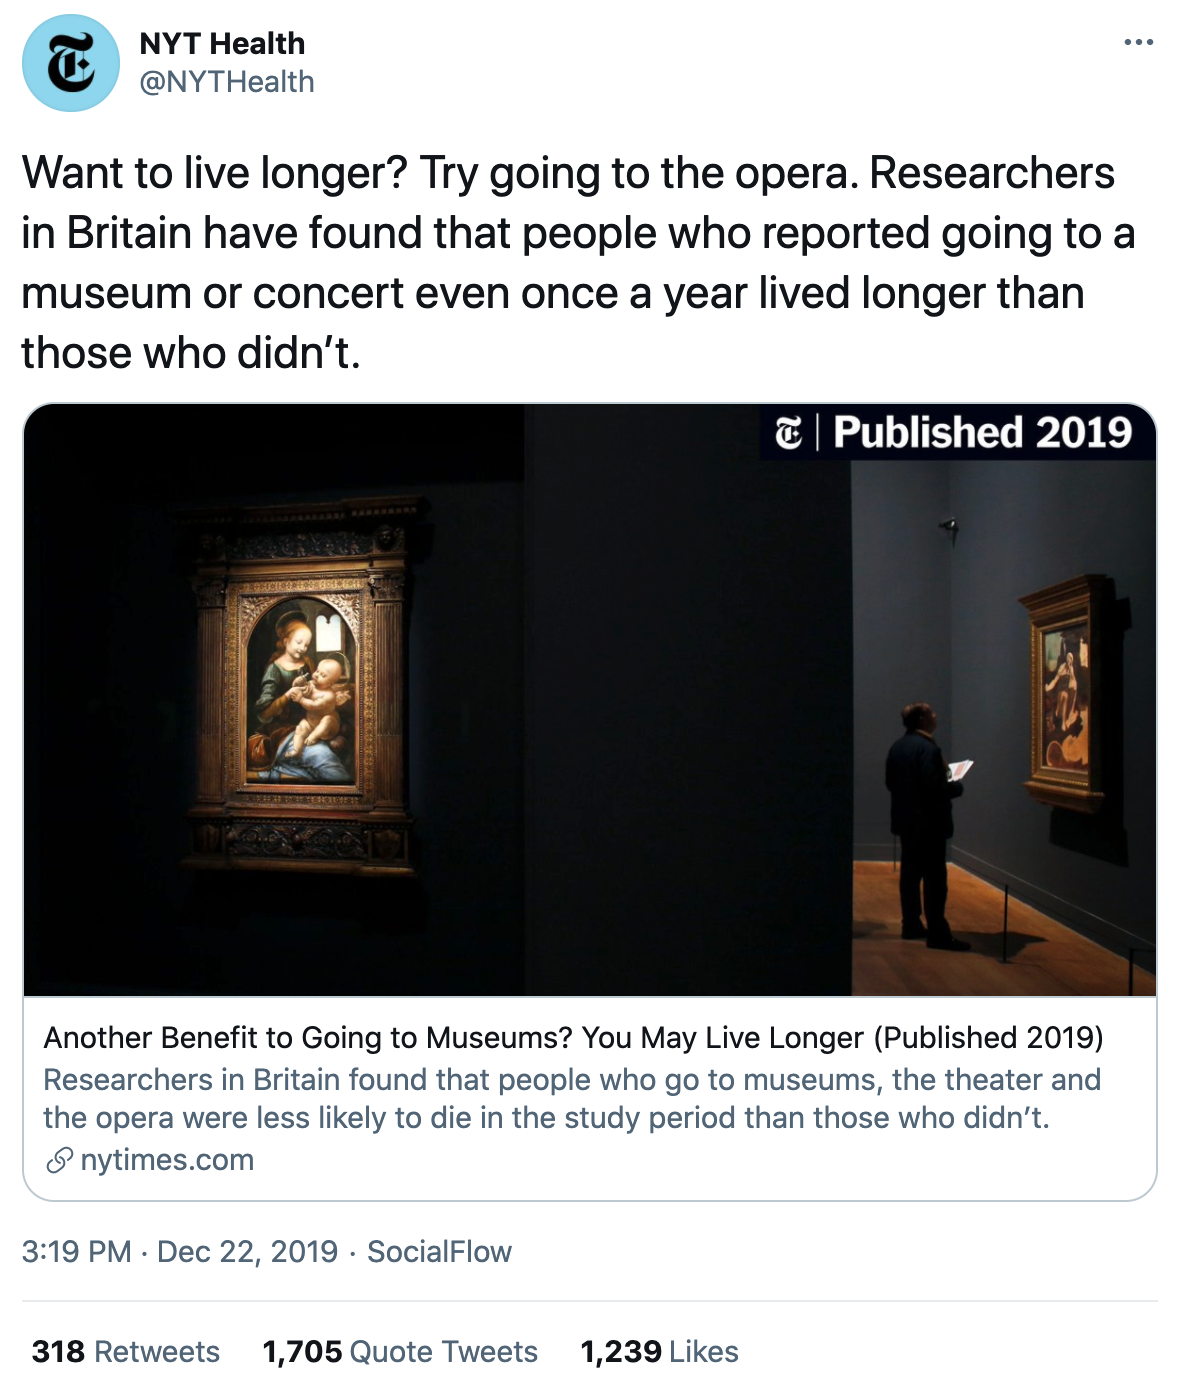
# Calling bullsh*t when you see it
.pull-left-vsmall[
**Learn not to be fooled** by
- big data
- garbage data
- garbage models
- weird samples
- claims of generality
- statistical significance
- implausibly large effect sizes
- highly precise forecasts
- overfitted models
And much more...
]
.pull-right-vwide[
]
---
class: inverse, center, middle
# Sneak preview
Reflecting everyday ethics in data science
---
class: center
background-image: url("pics/clickworker.png")
# How do I pay clickworkers fairly?
---
class: center
background-image: url("pics/webscraping2.jpeg")
background-size: contain
# How do I respect intellectual property?
---
class: center
background-image: url("pics/google-streetview.webp")
background-size: contain
background-color: #000000
# How do I protect the privacy of my research subjects?
---
class: center
background-image: url("pics/hate-online.jpeg")
background-size: contain
background-color: #000000
# How do I protect the safety of my research subjects?
---
class: center
background-image: url("pics/xkcd.png")
background-size: contain
background-color: #000000
# How do I ensure statistical, measurement validity, etc.?
---
class: center
background-image: url("pics/versioncontrol.jpeg")
background-size: contain
background-color: #000000
# How do I ensure an open science workflow?
---
class: center
background-image: url("pics/meeting-presentation.png")
background-size: contain
background-color: #000000
# How do I communicate results honestly?
---
class: inverse, center, middle
name: logistics
# Class logistics
---
# The plan
.pull-left[
### Goals of the course
- This course equips you with conceptual knowledge about the data science pipeline and coding workflow, data structures, and data wrangling.
- It enables you to apply this knowledge with statistical software.
- It prepares you for our other core courses and electives as well as the master’s thesis.
]
--
.pull-right[
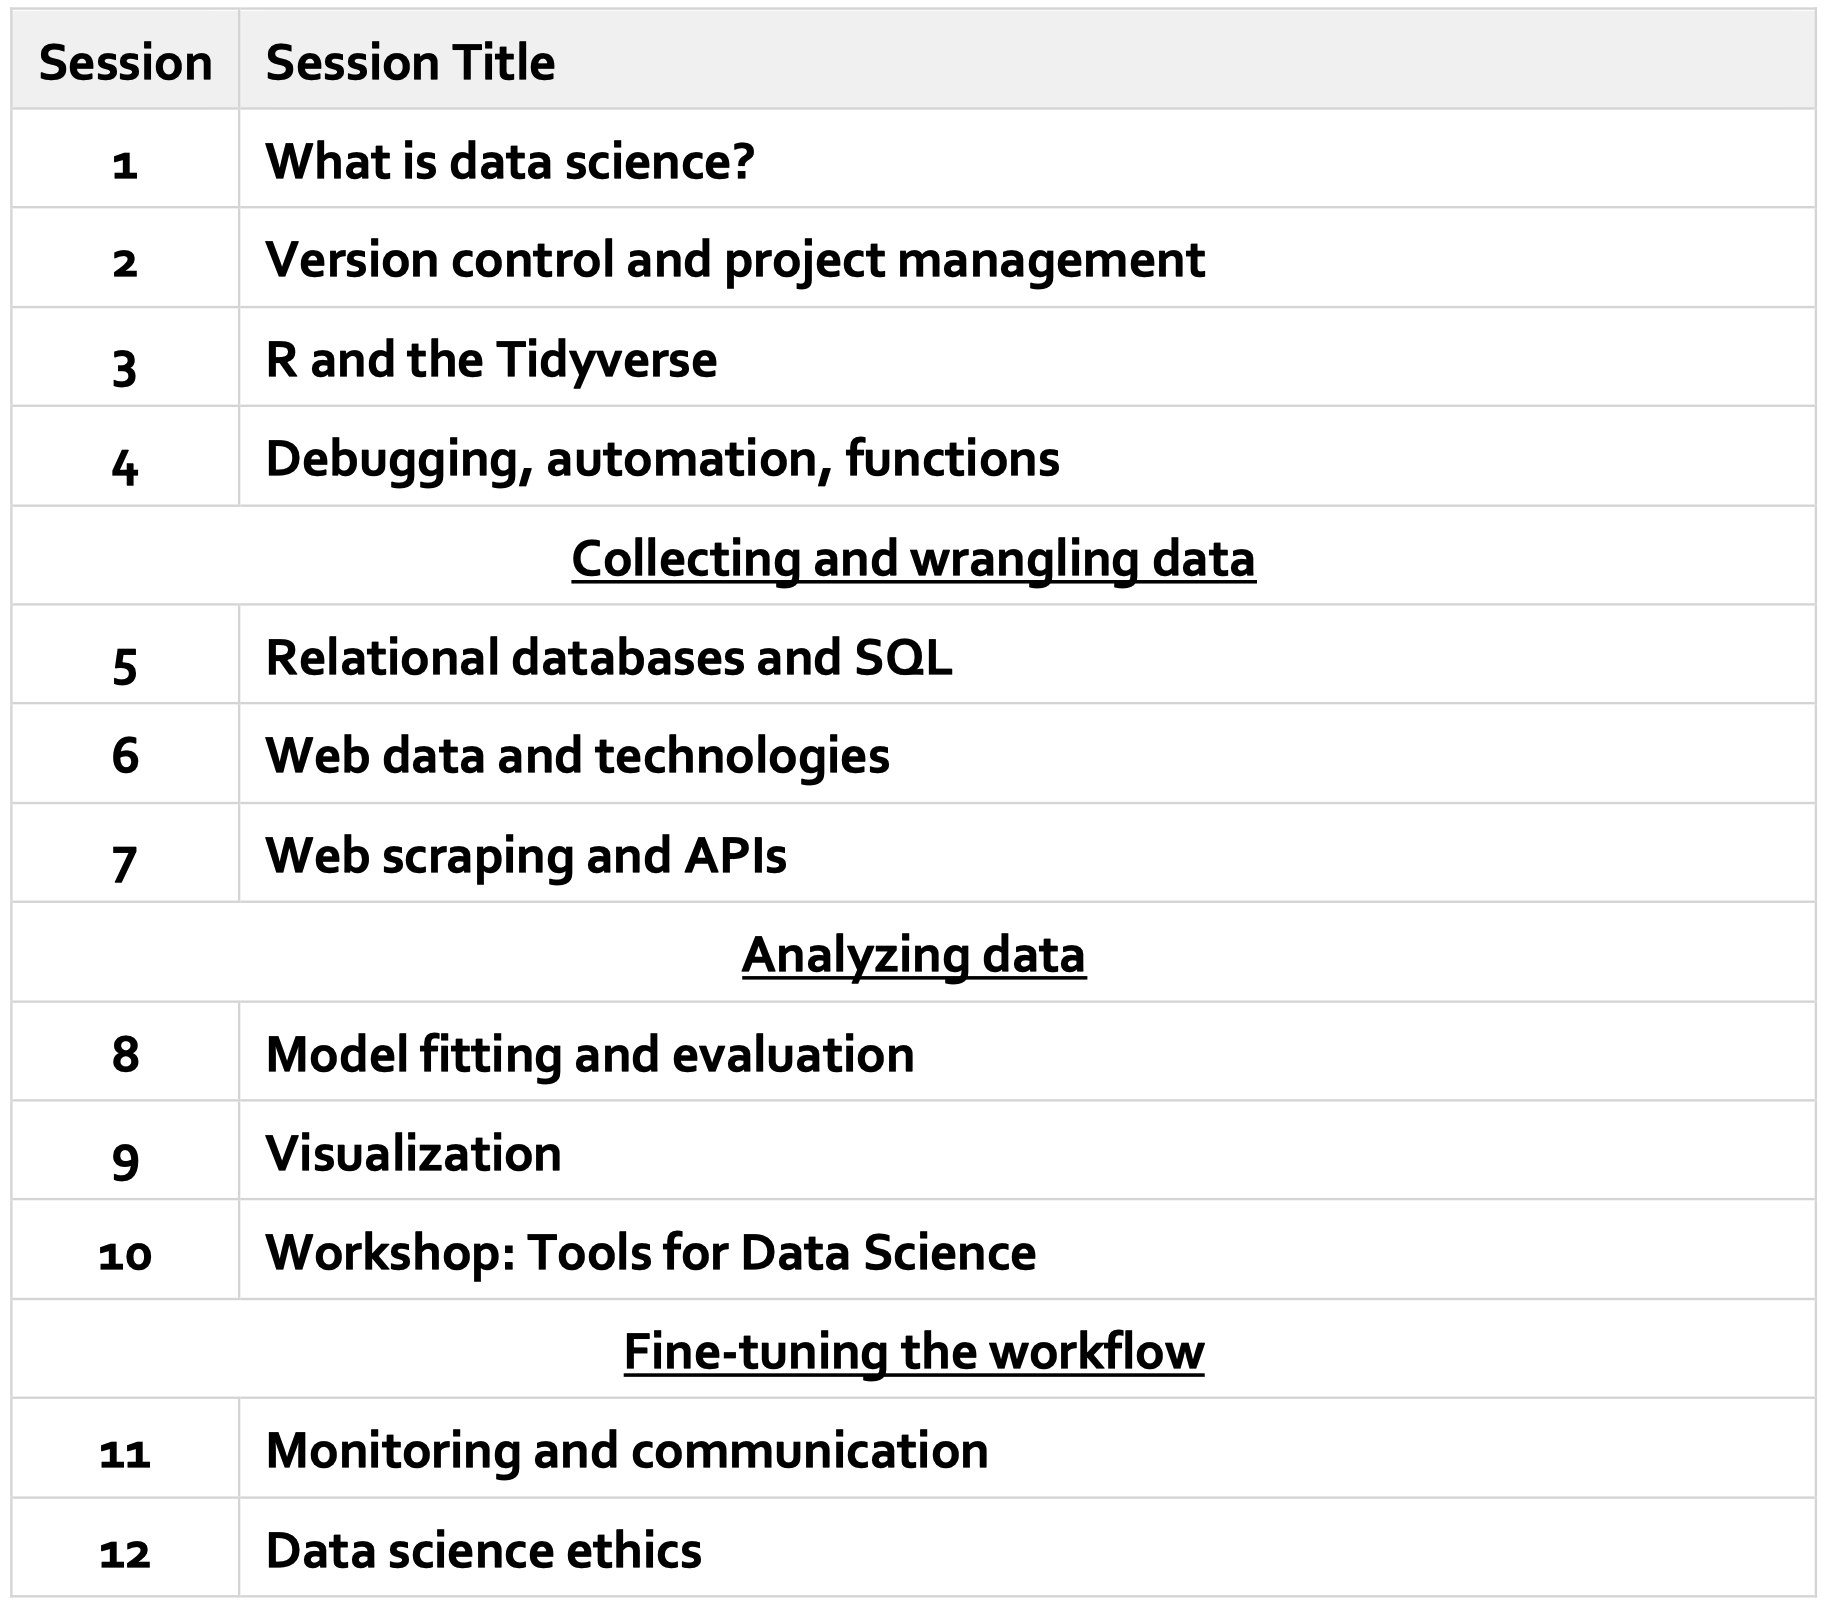
### What we will cover
- Version control and project management
- R and the tidyverse
- Programming workflow: debugging, automation, packaging
- Relational databases and SQL
- Web data and technologies
- Model fitting and evaluation
- Viusalization
- Monitoring and communication
- Data science ethics
- (The command line)
]
---
background-image: url("pics/harry-ron-hermione-start.jpeg")
background-size: contain
background-color: #000000
# You at the beginning of the course
---
background-image: url("pics/harry-ron-hermione-end.jpeg")
background-size: contain
background-color: #000000
# You at the end of the course
---
# Why R and RStudio?
### Data science positivism
- Alongside Python, R has become the *de facto* language for data science.
- See: [*The Impressive Growth of R*](https://stackoverflow.blog/2017/10/10/impressive-growth-r/), [*The Popularity of Data Science Software*](http://r4stats.com/articles/popularity/)
- Open-source (free!) with a global user-base spanning academia and industry.
- "Do you want to be a profit source or a cost center?"
--
### Bridge to multiple other programming environments, with statistics at heart
- Already has all of the statistics support, and is amazingly adaptable as a “glue” language to other
programming languages and APIs.
- The RStudio IDE and ecosystem allow for further, seemless integration.
--
### Path dependency
- It's also the language that I know best.
- (Learning multiple languages is a good idea, though.)
---
# Why R and RStudio? (cont.)
```{R, indeeddotcom, echo = F, fig.height = 6, fig.width = 9, dev = "svg", warning = F}
# The popularity data
pop_df =
data.frame(
lang = c("Python", "SQL", "R", "SAS", "Matlab", "Julia", "SPSS", "Stata"),
n_jobs = c(12203, 10291, 6812, 1005, 838, 474, 296, 67), # 2022/09/03
#n_jobs = c(8150, 7264, 3484, 950, 687, 270, 74), # 2021/08/27
#n_jobs = c(99756, 132860, 41242, 31943, NA, 4843, 2302),
free = c(T, T, T, F, F, T, F, F)
)
## Plot it
pop_df %>%
mutate(lang = lang %>% factor(ordered = T)) %>%
ggplot(aes(x = lang, y = n_jobs, fill = free)) +
geom_col() +
geom_hline(yintercept = 0) +
aes(x = reorder(lang, -n_jobs), fill = reorder(free, -free)) +
xlab("Statistical language") +
scale_y_continuous(label = scales::comma) +
ylab("Number of jobs") +
labs(
title = "Comparing statistical languages",
subtitle = "Number of job postings for ' data' on de.indeed.com, 2022/09/03"
) +
scale_fill_manual(
"Free?",
labels = c("True", "False"),
values = c("#f92672", "darkslategray")
) +
ggthemes::theme_pander(base_size = 17) +
# theme_ipsum() +
theme(legend.position = "bottom")
```
---
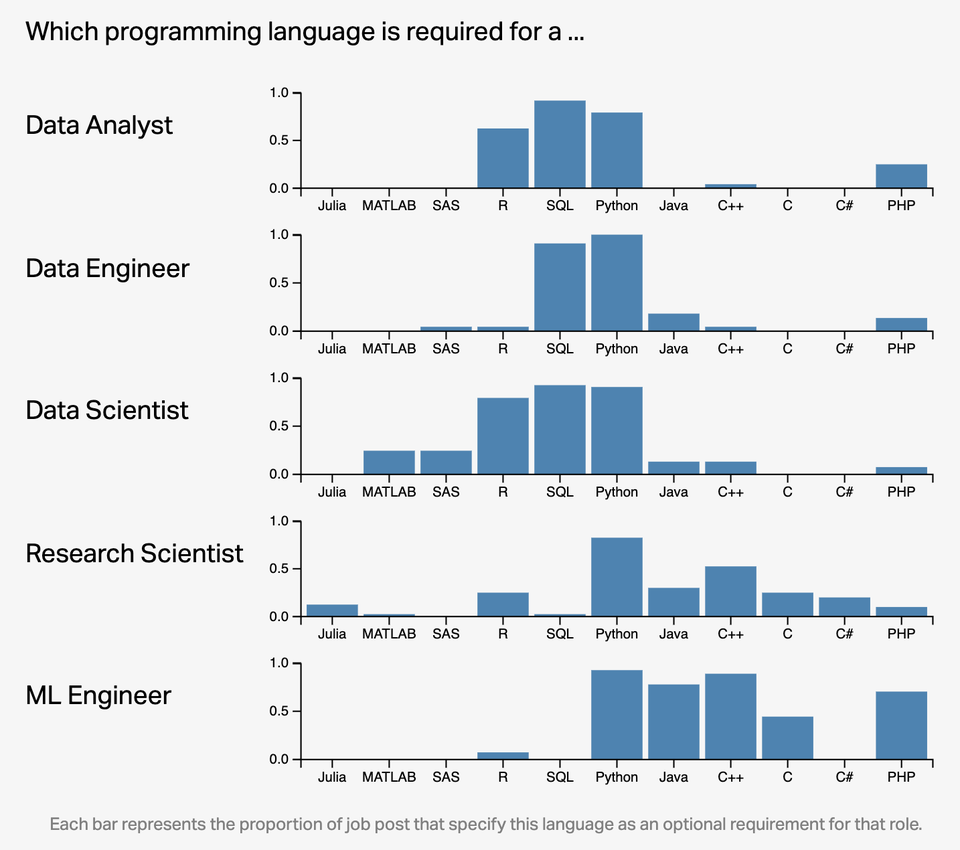
# Why R and RStudio? (cont.)
`Credit` [Left_Ad8361/Reddit](https://www.reddit.com/r/dataisbeautiful/comments/qw1bew/oc_which_programming_language_is_required_to_land/)
---
# Core (and optional) readings
---
# Attendance
## General rules
- You cannot miss more than two sessions. If you have to miss a session for medical reasons or personal emergencies, please **inform Examination Office** and they will inform me about your absence. There is no need to notify me in advance or ex post.
- We will check attendance on-site.
- The current **Hertie hygiene rules** apply!
---
# Office hours and advice
- If you want to discuss content from class, please first do so in the lab sessions.
- If you still need more feedback on course topics, use the Moodle forum.
- If you want to discuss any other matters with me, drop my assistance a message (`r fa('envelope')` [kwoyila@hertie-school.org](mailto:kwoyila@hertie-school.org)) and she will arrange a meeting.
- For general technical advice, the [Research Consulting Team at the Data Science Lab](https://hertie-data-science-lab.github.io/research-consulting/) is there for you.
---
# Assignments and grading
| Component | Weight |
|:-|-:|
| 4 × homework assignments (10% each) | 40% |
| 1 × workshop presentation | 30% |
| 1 × data science project exam | 30% |
--
### Homework assignments
- The assignments are distributed via our own [GitHub Classroom](https://classroom.github.com/classrooms/112495184-introduction-to-data-science-fall-2022).
- Each assignment is a mix of practical problems that are to be solved with R.
- You are encouraged to collaborate, but everyone will hand in a separate solution.
- There will be 5 assignments (one every ~2 weeks; see [overview on GitHub](https://github.com/intro-to-data-science-22/assignments)) and the 4 best will contribute to the final grade.
- You'll have one week to work on each assignment (deadline: Tuesdays at noon).
- You submit your solutions via GitHub.
- Grades will be based on (1) the accuracy of your solutions and (2) the adherence of a clean and efficient coding style that you will learn in the first sessions.
---
# Assignments and grading
| Component | Weight |
|:-|-:|
| 4 × homework assignments (10% each) | 40% |
| 1 × workshop presentation | 30% |
| 1 × data science project exam | 30% |
### Workshop presentation
- In one of the last sessions of the course, we will flip the roles and you will become the instructor of a workshop on **Tools for Data Science**. Whether this will happen onsite (hybrid) or online will still be determined.
- Timing: November 21 (regular class times)
- You, in (randomly allocated) groups of 2 students, will present a data science workflow tool (randomly [allocated](https://github.com/intro-to-data-science-22/workshop-presentations)).
- Your contribution will include
1. A lightning talk (recorded) where you briefly introduce and motivate the tool
2. A hands-on session where you showcase the tool and provide practice material
- Both the talk and the prepared exercise materials, which must also be hosted openly on GitHub, will be graded.
- Check out the materials from last year's workshop [online](https://intro-to-data-science-21-workshop.github.io/)!
---
# Assignments and grading
| Component | Weight |
|:-|-:|
| 4 × homework assignments (10% each) | 40% |
| 1 × workshop presentation | 30% |
| 1 × data science project exam | 30% |
### Data science project exam
- You get to solve a set of coding problems and develop a creative solution to a resarch problem.
- Timing: Week of December 12 or 19 (exact date TBD)
- After the instructions have been made available, you will have 48 hours to submit your solutions.
- You are supposed to collaborate in groups of three students.
- The task is similar to the homework assignments but put more emphasis on creative problem-solving using the tools and techniques you have learned in class.
- On the first day of the exam, we plan to host a hackathon at Hertie where we introduce the data and provide an environment that should facilitate you getting started with the project.
---
# Further reading
---
# Further listening
---
# Further watching
---
# Getting started for the course
### Software
1. Download [R](https://cran.rstudio.com/).
2. Download [RStudio](https://www.rstudio.com/products/rstudio/download/preview/).
3. Download [Git](https://git-scm.com/downloads).
4. Create an account on [GitHub](https://github.com/) and register for a student/educator [discount](https://education.github.com/discount_requests/new). You will soon receive an invitation to the course organization on GitHub, as well as [GitHub classroom](https://classroom.github.com), which is how we'll disseminate and submit assignments, receive feedback and grading, etc.
--
### OS extras
- **Windows:** Install [Rtools](https://cran.r-project.org/bin/windows/Rtools/). You might also want to install [Chocolately](https://chocolatey.org/).
- **Mac:** Install [Homebrew](https://brew.sh/).
- **Linux:** None (you should be good to go).
---
# Checklist
☑ Do you have the most recent version of R?
```{r, cache=FALSE}
version$version.string
```
☑ Do you have the most recent version of RStudio? (The [preview version](https://www.rstudio.com/products/rstudio/download/preview/) is fine.)
```{r eval=FALSE}
RStudio.Version()$version
## Requires an interactive session but should return something like "[1] ‘1.4.1100’"
```
☑ Have you updated all of your R packages?
```{r eval=FALSE}
update.packages(ask = FALSE, checkBuilt = TRUE)
```
---
# Checklist (cont.)
Open up the [shell](http://happygitwithr.com/shell.html#shell).
- Windows users, make sure that you installed a Bash-compatible version of the shell. If you installed [Git for Windows](https://gitforwindows.org), then you should be good to go.
☑ Which version of Git have you installed?
```{bash, cache=FALSE}
git --version
```
☑ Did you introduce yourself to Git? (Substitute in your details.)
```{bash, eval=FALSE}
git config --global user.name 'Simon Munzert'
git config --global user.email 'munzert@hertie-school.org'
git config --global --list
```
☑ Did you register an account in GitHub?
---
# This semester
---
# Coming up
### The first lab session
Get to know Lisa, Tom, R, and RStudio, four of your best friends for the next months!
### Next lecture
Version control and project management