ZoomPlot
MATLAB Code for Interactive Magnification of Customized Regions.
Version 1.5.1, 5-FEB-2024
Email: iqiukp@outlook.com
## ✨ Main features
- Easy application with just two lines of code
- Interactive plotting
- Support for image and figure classes
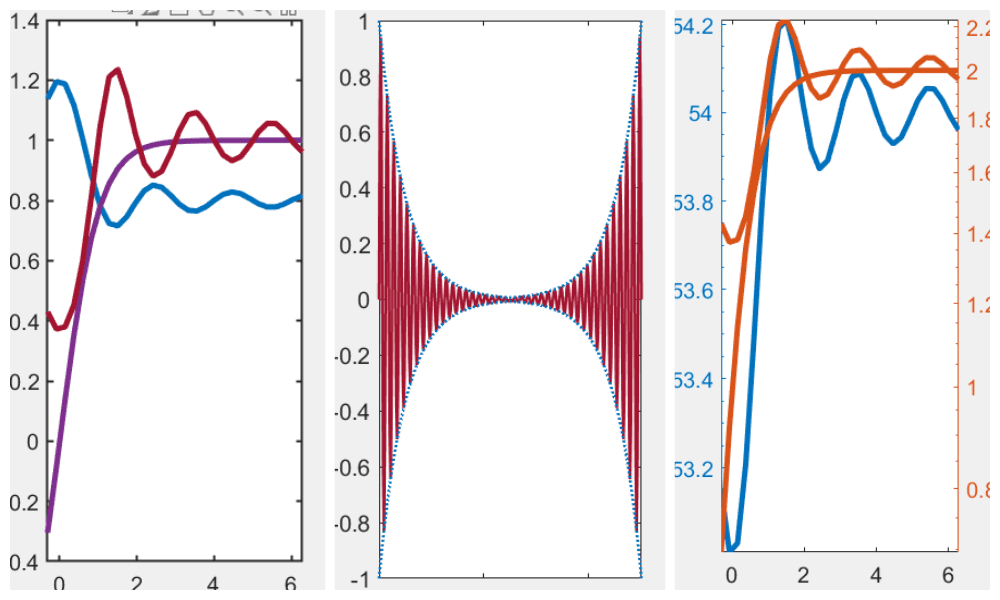
- Support for multiple zoomed zones
- Custom settings of parameters and themes
## ⚠️ Requirements
- R201Bb and later releases
- Image Processing Toolbox
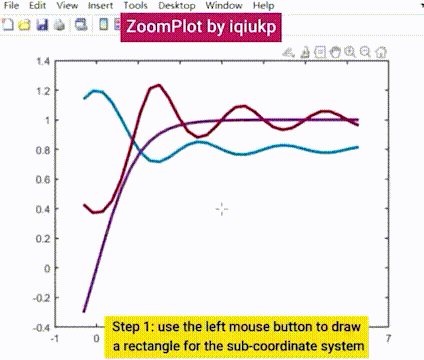
## 👉 How to use
1. Add `BaseZoom.m` and `parameters.json` to MATLAB search path or current working directory
2. After completing the basic drawing, enter the following two lines of code in the command line window or your m-file:
```MATLAB
% add a zoomed zone
zp = BaseZoom();
zp.run;
```
*if multiple zoomed zones are required, for example, 3 zoomed zones, the code is as follows:*
```MATLAB
% add 3 zoomed zones
zp = BaseZoom();
zp.run;
zp.run;
zp.run;
```
⚠️⚠️⚠️ For More details please see the `manual.pdf`.
## ✨ About `manual.pdf`:
The `manual.pdf` file is the official user manual for the ZoomPlot MATLAB code. It provides users with detailed instructions on using the code, including the syntax, descriptions, example code, and requirements to run the ZoomPlot for interactive magnification of plots and images within MATLAB.
- Introduction
- Syntax
- Description
- Files
- Requirements
- Preparations
- Examples
- Interactive Local Magnification for Figure Class
- Implement Multiple Local Magnifications for Figure Class
- Specify Axes for Local Magnification for Figure Class
- Manually Set SubAxes and Zoom Area for Figure Class
- Manually ZoomPlot in Sub Plots for Figure Class
- Interactive Local Magnification for Image Class
- Manually Set Zoom Area for Image Class
- Parameter Configuration
- Sub Axes Theme
- Zoomed Area Theme
- Dynamic Rectangle Theme
- Connection Lines Theme
- More Parameter Configuration
## 👉 Examples for image class
Multiple types of image are supported for interactive magnification of customized regions in the `ZoomPlot`.

## 👉 Examples for figure class
Multiple zoomed zones are supported for figure class.
## Star History
[](https://star-history.com/#iqiukp/ZoomPlot-MATLAB)


