
| k-Wave Toolbox |
 
|
Filter input with high or low pass filter
filtered_signal = applyFilter(signal, Fs, cutoff_f, filter_type)
filtered_signal = applyFilter(signal, Fs, cutoff_f, filter_type, ...)
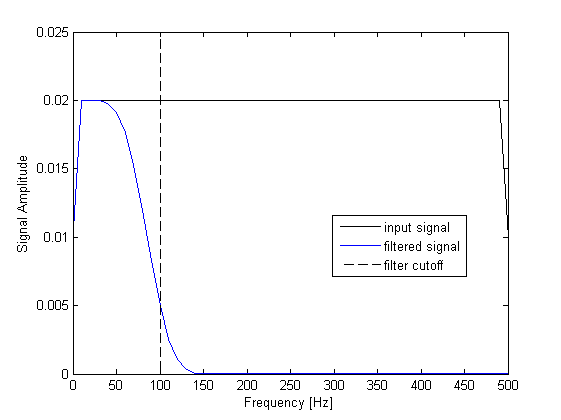
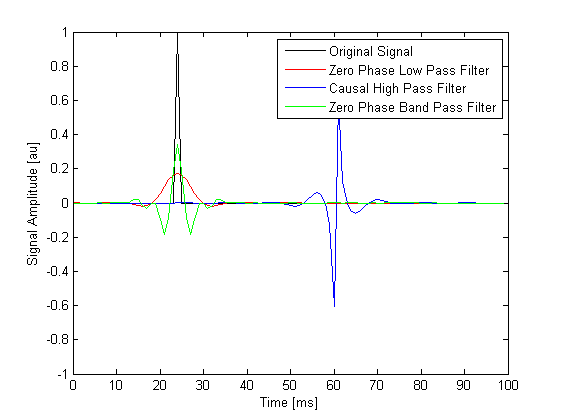
applyFilter filters an input signal using filter. The FIR filter coefficients are based on a Kaiser window with the specified cut-off frequency and filter type ('HighPass', 'LowPass' or 'BandPass'). Both causal and zero phase filters can be applied. An example of using applyFilter is given below.
% create a time series with a single monopolar pulse
N = 100;
dt = 1e-3;
t = 0:dt:dt*(N-1);
pulse = zeros(length(t), 1);
pulse(25) = 1;

% filter using applyFilter
pulse_filtered_lp = applyFilter(pulse, 1/dt, 100, 'LowPass', 'Plot', true, 'ZeroPhase', true);
pulse_filtered_hp = applyFilter(pulse, 1/dt, 100, 'HighPass', 'Plot', true);
pulse_filtered_bp = applyFilter(pulse, 1/dt, [50, 250], 'BandPass', 'Plot', true, 'ZeroPhase', true);

% plot the filtered time series
figure;
[~, scale, prefix] = scaleSI(max(t));
plot(t*scale, pulse, 'k-', t*scale, pulse_filtered_lp, 'r-', t*scale, pulse_filtered_hp, 'b-', t*scale, pulse_filtered_bp, 'g-');
xlabel(['Time [' prefix 's]']);
ylabel('Signal Amplitude [au]');
legend('Original Signal', 'Zero Phase Low Pass Filter', 'Causal High Pass Filter', 'Zero Phase Band Pass Filter');


|
signal to filter |
|
sampling frequency [Hz] |
|
filter cutoff frequency/s [Hz] |
|
|
Optional 'string', value pairs that may be used to modify the default computational settings.
| Input | Valid Settings | Default | Description |
|---|---|---|---|
|
(boolean scalar) |
|
Boolean controlling whether the amplitude spectrum is displayed before and after filtering. |
|
(numeric scalar) |
|
Attenuation in decibels in the stop band. |
|
(numeric scalar) |
|
Size of the transition based on the temporal sampling frequency. |
|
(boolean scalar) |
|
boolean controlling whether a zero phase filter is used. |
|
the filtered signal |
filter, filterTimeSeries
 |
addNoise | attenComp |  |
© 2009-2014 Bradley Treeby and Ben Cox.